| Param | Original file | Final file |
|---|---|---|
| Filename | modeM0/AS1T04_069T01_9000005158_36024cztM0_level2.evt | modeM0/AS1T04_069T01_9000005158_36024cztM0_level2_quad_clean.evt |
| Size (bytes) | 487,275,840 | 65,378,880 |
| Size | 464.7 MB | 62.4 MB |
| Events in quadrant A | 2,656,337 | 424,616 |
| Events in quadrant B | 4,143,386 | 378,126 |
| Events in quadrant C | 3,038,580 | 406,212 |
| Events in quadrant D | 4,543,207 | 382,953 |
| Mode M0 | |||
|---|---|---|---|
| Quadrant | BADHDUFLAG | Total packets | Discarded packets |
| A | 0 | 11515 | 3 |
| B | 0 | 15970 | 2 |
| C | 0 | 12567 | 2 |
| D | 0 | 17351 | 2 |
| Mode M9 | |||
|---|---|---|---|
| Quadrant | BADHDUFLAG | Total packets | Discarded packets |
| A | 0 | 27 | 0 |
| B | 0 | 27 | 0 |
| C | 0 | 27 | 0 |
| D | 0 | 28 | 0 |
| Mode SS | |||
|---|---|---|---|
| Quadrant | BADHDUFLAG | Total packets | Discarded packets |
| A | 0 | 112 | 0 |
| B | 0 | 112 | 0 |
| C | 0 | 112 | 0 |
| D | 0 | 112 | 0 |
| Quadrant | Total seconds | Saturated seconds | Saturation percentage |
|---|---|---|---|
| A | 5536 | 12 | 0.216763% |
| B | 5536 | 647 | 11.687139% |
| C | 5536 | 104 | 1.878613% |
| D | 5536 | 347 | 6.268064% |
Noise dominated data is calculated using 1-second bins in cleaned event files. If a bin has >2000 counts, and if more than 50% of those come from <1% of pixels, then it is considered to be noise-dominated and hence unusable.
| Quadrant | # 1 sec bins | Bins with >0 counts | Bins with >2000 counts | High rate bins dominated by noise | Noise dominated (total time) | Noise dominated (detector-on time) | Marked lightcurve |
|---|---|---|---|---|---|---|---|
| A | 7150 | 5537 | 0 | 0 | 0.00% | 0.00% | 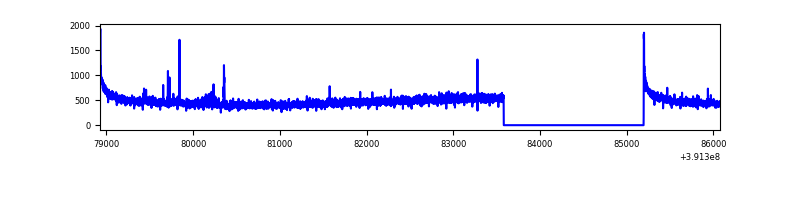 |
| B | 7150 | 5537 | 529 | 529 | 7.40% | 9.55% | 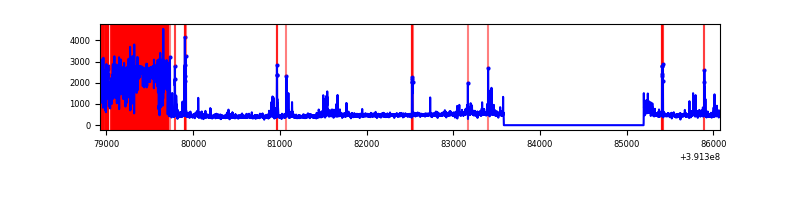 |
| C | 7150 | 5537 | 82 | 82 | 1.15% | 1.48% | 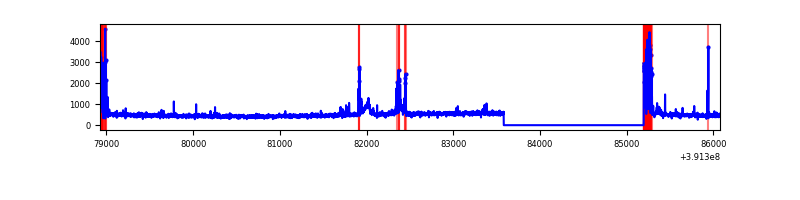 |
| D | 7150 | 5537 | 300 | 300 | 4.20% | 5.42% | 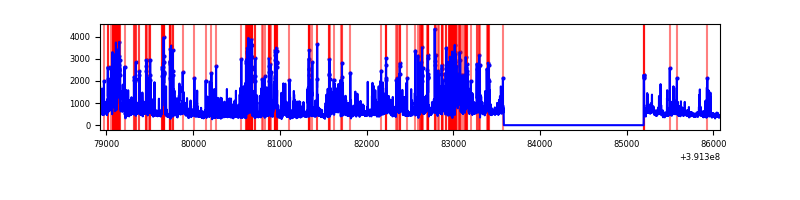 |
Top three noisy pixels from each quadrant. If the there are fewer than three noisy pixels in the level2.evt file, extra rows are filled as -1
| Pixel properties | Quadrant properties | ||||||
|---|---|---|---|---|---|---|---|
| Quadrant | DetID | PixID | Counts | Sigma | Mean | Median | Sigma |
| A | 10 | 83 | 173468 | 1328.81 | 634 | 621 | 130.1 |
| A | 15 | 232 | 17256 | 127.89 | 634 | 621 | 130.1 |
| A | 13 | 254 | 8762 | 62.59 | 634 | 621 | 130.1 |
| B | 5 | 172 | 1467417 | 12746.41 | 596 | 580 | 115.1 |
| B | 4 | 171 | 131613 | 1138.64 | 596 | 580 | 115.1 |
| B | 5 | 255 | 103676 | 895.88 | 596 | 580 | 115.1 |
| C | 0 | 10 | 262436 | 1850.41 | 606 | 611 | 141.5 |
| C | 15 | 214 | 230203 | 1622.61 | 606 | 611 | 141.5 |
| C | 9 | 187 | 168931 | 1189.58 | 606 | 611 | 141.5 |
| D | 12 | 235 | 1107140 | 7463.17 | 599 | 582 | 148.3 |
| D | 1 | 52 | 317292 | 2136.04 | 599 | 582 | 148.3 |
| D | 12 | 17 | 217043 | 1459.92 | 599 | 582 | 148.3 |
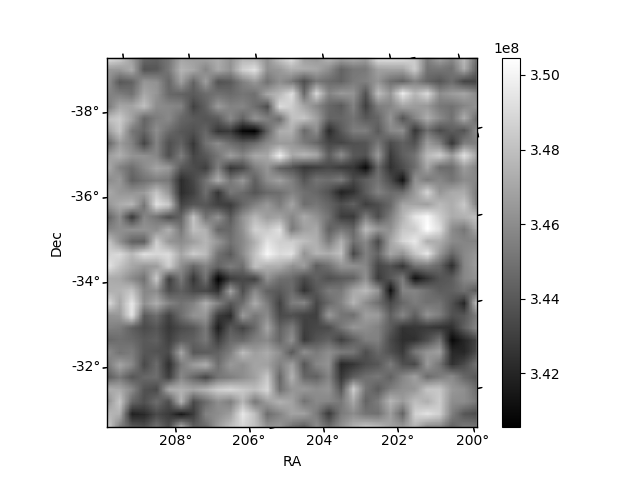
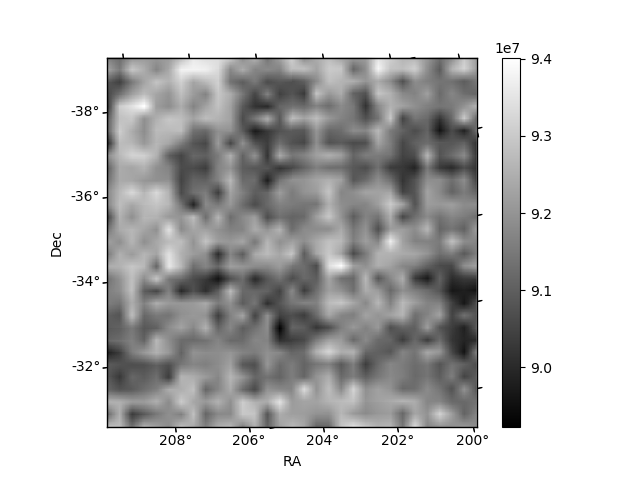
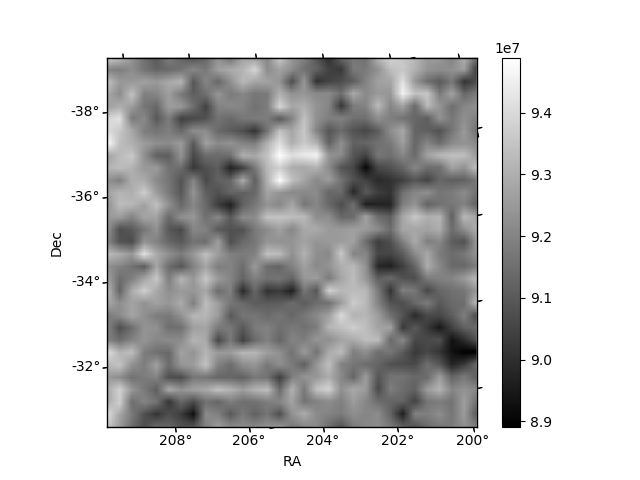
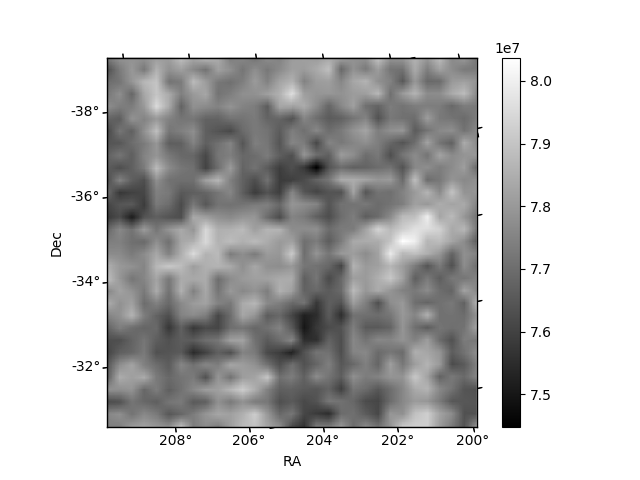
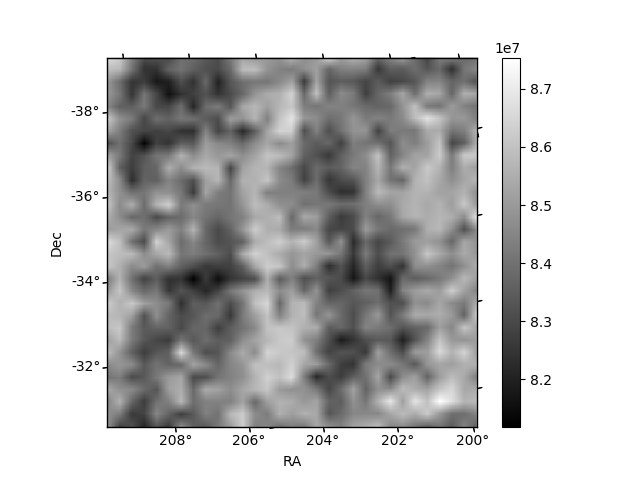
Histogram calculated using DETX and DETY for each event in the final _common_clean file
| Quadrant A | 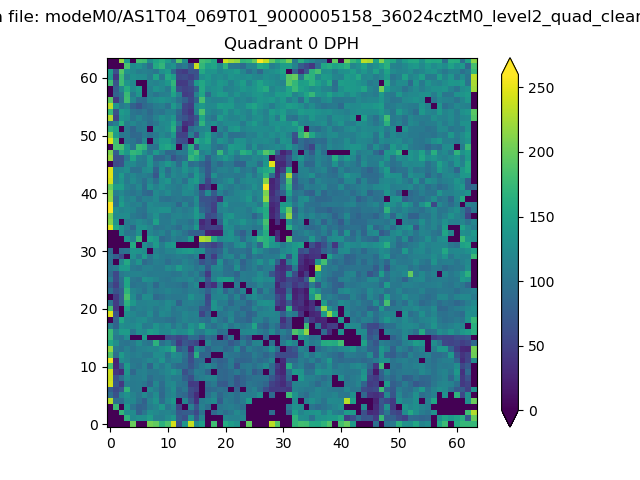 |
 |
Quadrant B |
|---|---|---|---|
| Quadrant D | 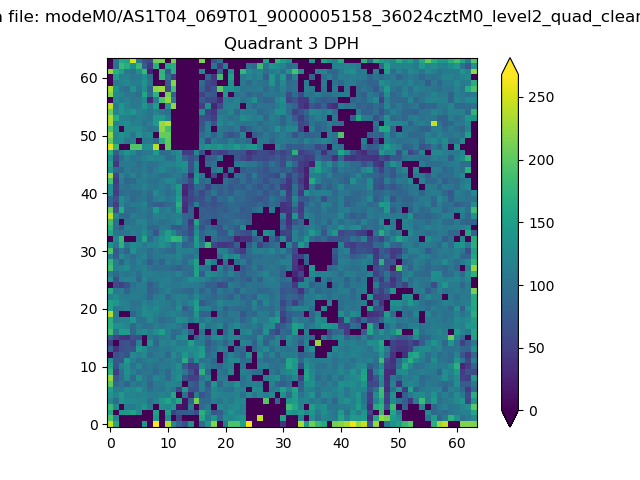 |
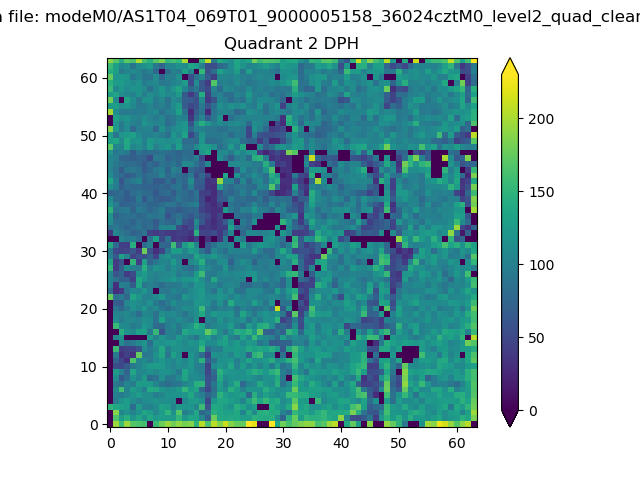 |
Quadrant C |
| Plot type | Count rate plots | Images |
|---|---|---|
| Comparison with Poisson distribution Blue bars denote a histogram of data divided into 1 sec bins. Red curve is a Poisson curve with rate = median count rate of data. |
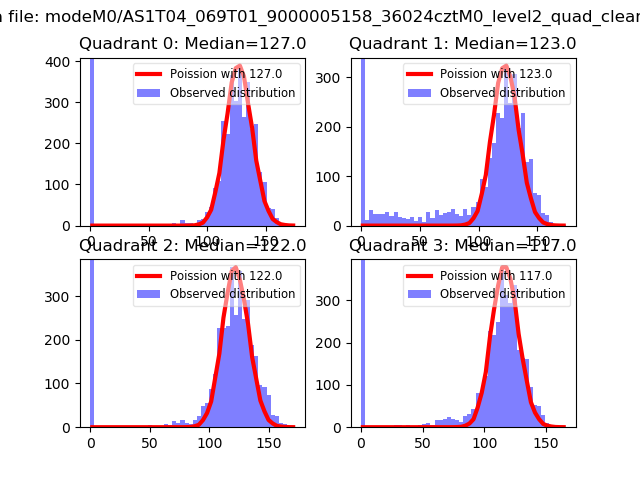 |
 |
| Quadrant-wise count rates Data is divided into 100 sec bins |
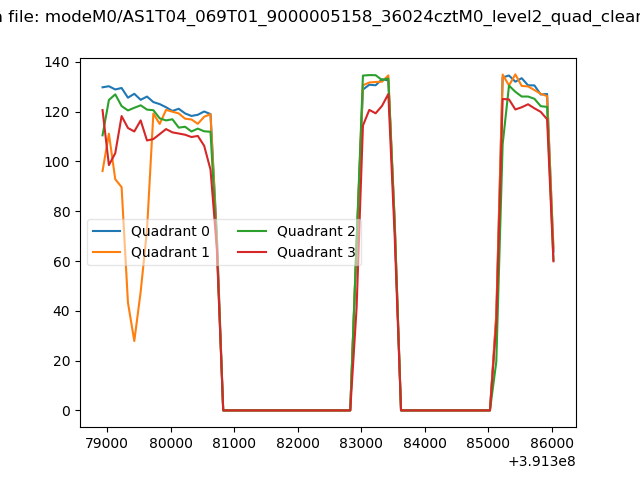 |
|
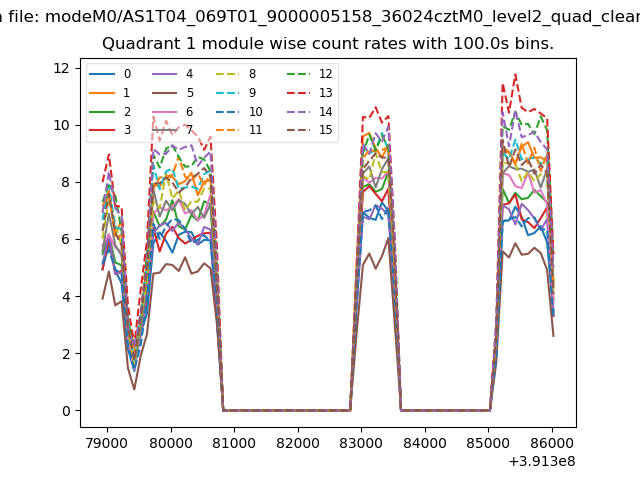
| Module-wise count rates for Quadrant A Data is divided into 100 sec bins |
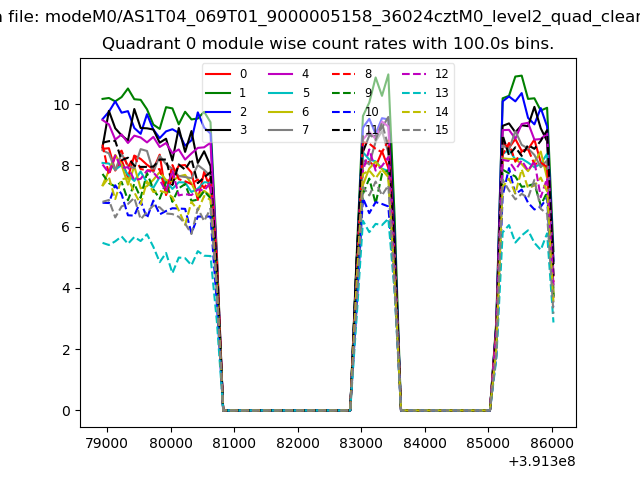 |
 |
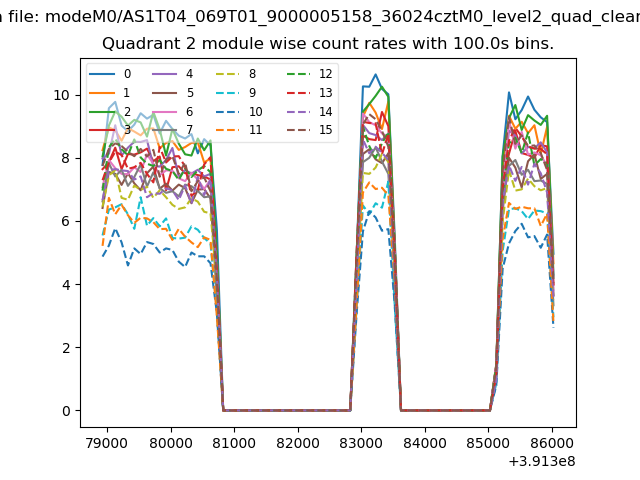
| Module-wise count rates for Quadrant B Data is divided into 100 sec bins |
 |
 |
| Module-wise count rates for Quadrant C Data is divided into 100 sec bins |
 |
 |
| Module-wise count rates for Quadrant D Data is divided into 100 sec bins |
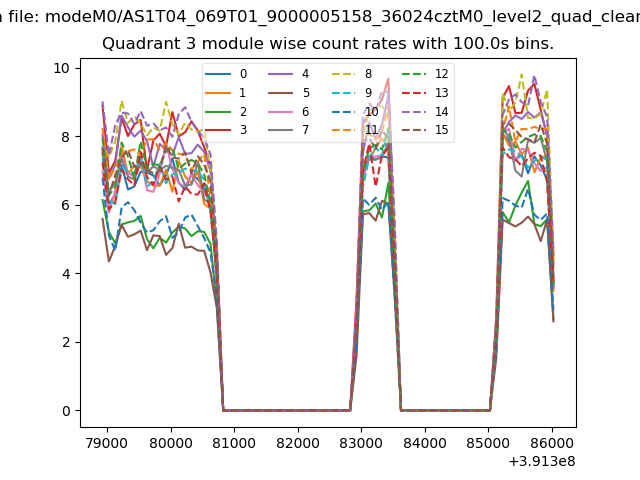 |
 |
| Parameter | Plot |
|---|---|
| CZT HV Monitor | 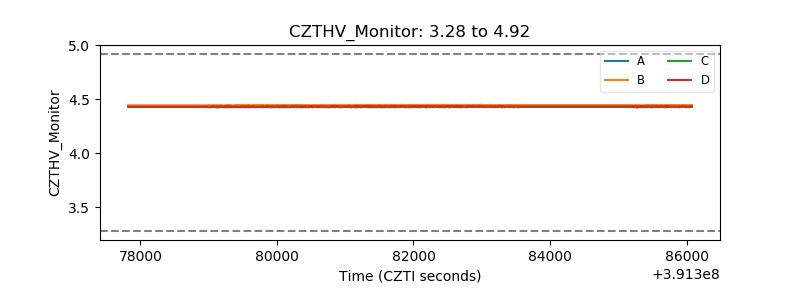 |
| D_VDD | 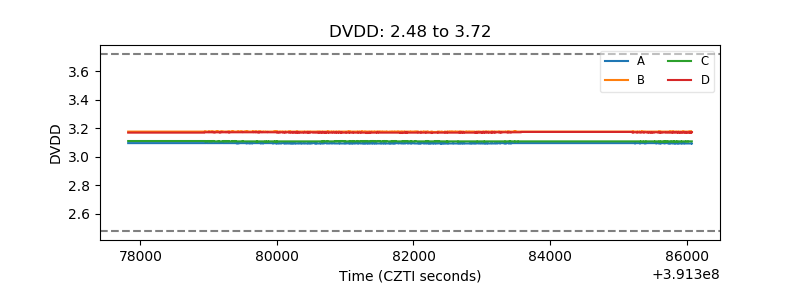 |
| Temperature 1 | 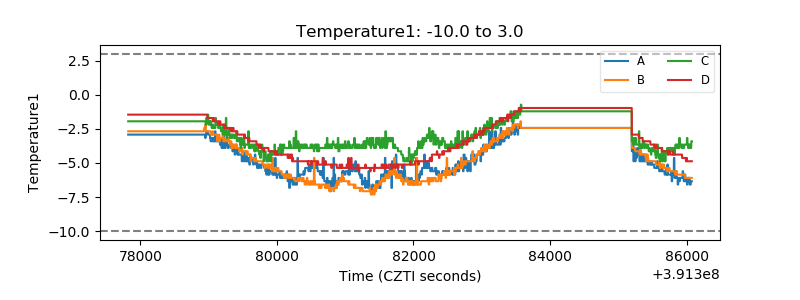 |
| Veto HV Monitor | 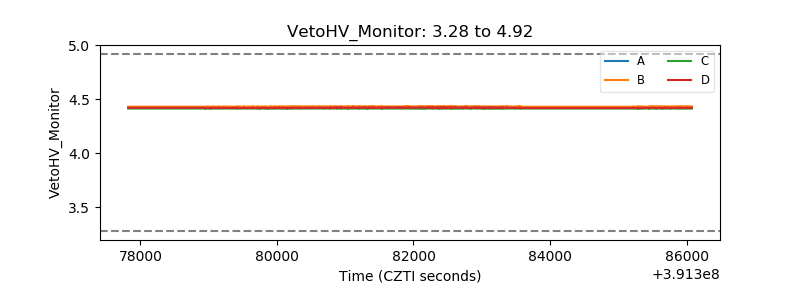 |
| Veto LLD | 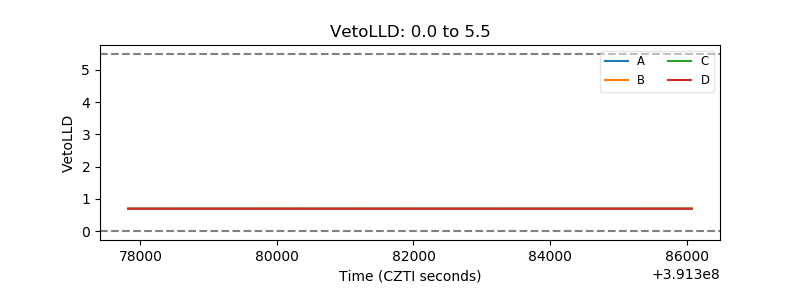 |
| Alpha Counter | 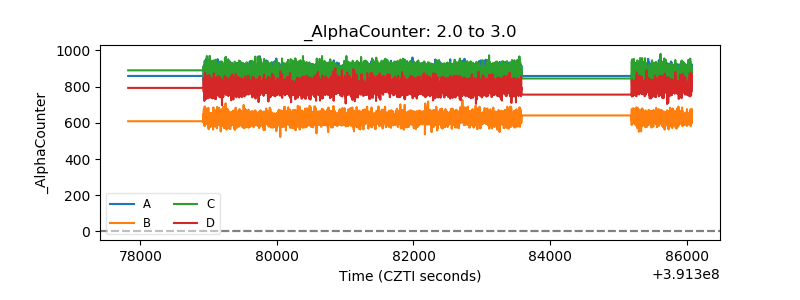 |
| _CPM_Rate | 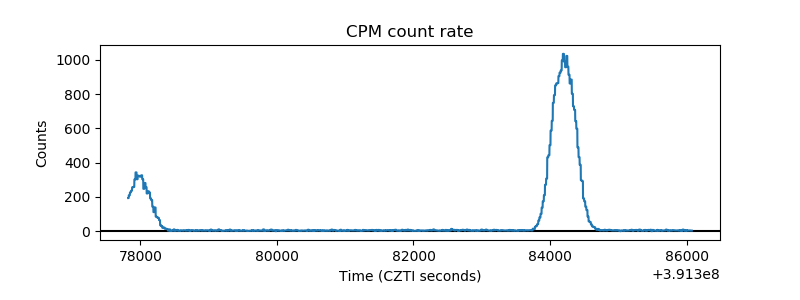 |
| CZT Counter | 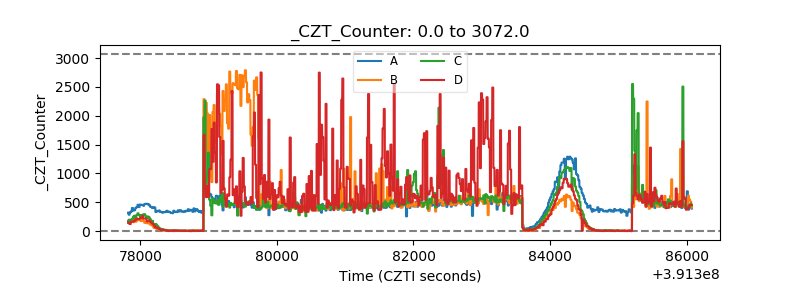 |
| +2.5 Volts monitor | 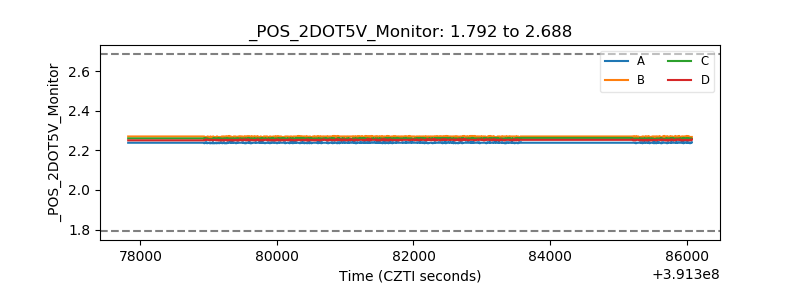 |
| +5 Volts monitor | 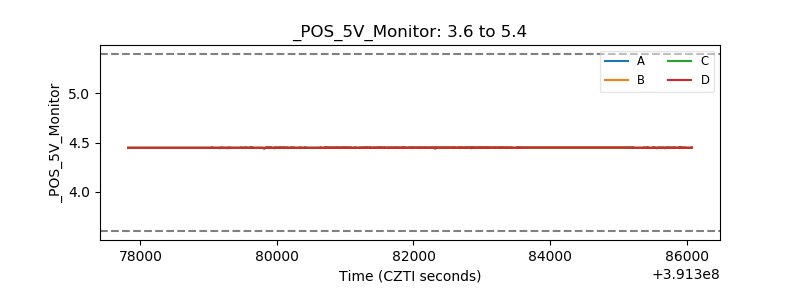 |
| _ROLL_ROT | 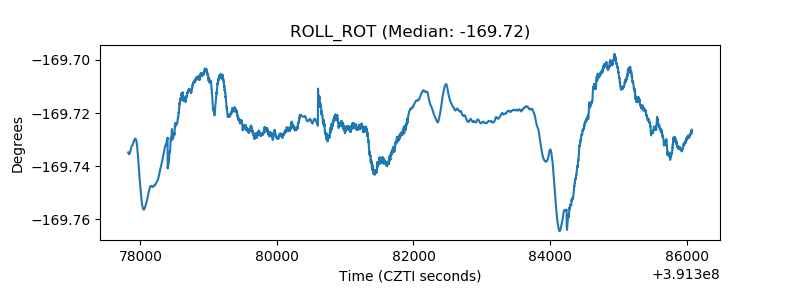 |
| _Roll_DEC | 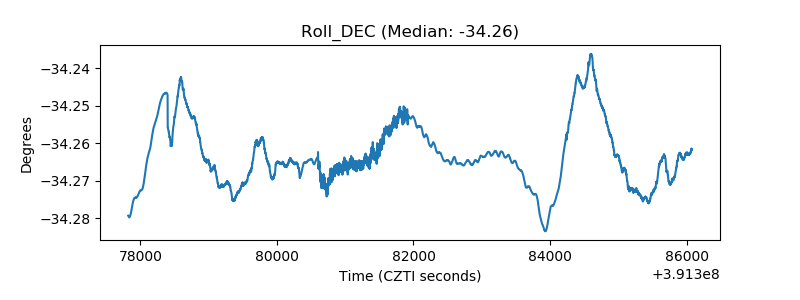 |
| _Roll_RA | 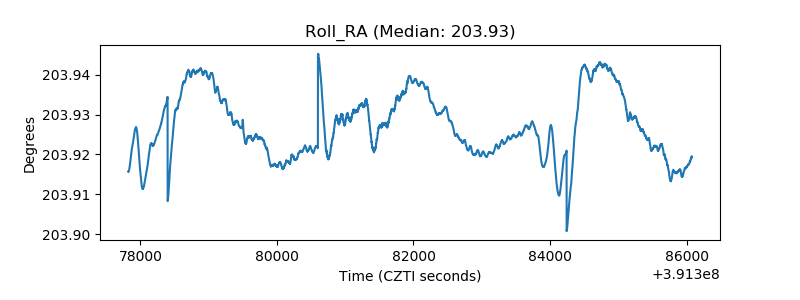 |
| Veto Counter | 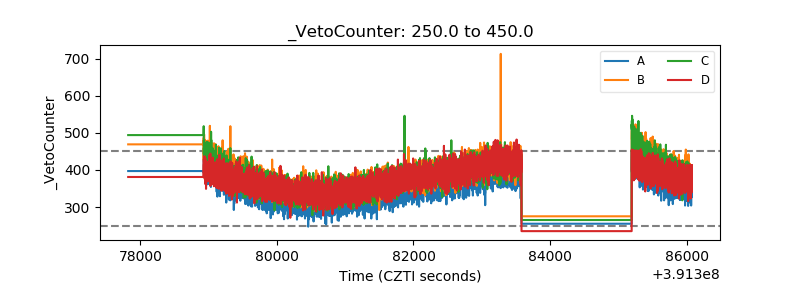 |