| Param | Original file | Final file |
|---|---|---|
| Filename | modeM0/AS1T04_069T01_9000005158_36020cztM0_level2.evt | modeM0/AS1T04_069T01_9000005158_36020cztM0_level2_quad_clean.evt |
| Size (bytes) | 511,850,880 | 85,855,680 |
| Size | 488.1 MB | 81.9 MB |
| Events in quadrant A | 2,874,571 | 563,140 |
| Events in quadrant B | 3,957,273 | 553,938 |
| Events in quadrant C | 3,133,809 | 550,080 |
| Events in quadrant D | 5,135,191 | 519,617 |
| Mode M0 | |||
|---|---|---|---|
| Quadrant | BADHDUFLAG | Total packets | Discarded packets |
| A | 0 | 12249 | 3 |
| B | 0 | 15681 | 2 |
| C | 0 | 12953 | 2 |
| D | 0 | 19314 | 2 |
| Mode M9 | |||
|---|---|---|---|
| Quadrant | BADHDUFLAG | Total packets | Discarded packets |
| A | 0 | 20 | 0 |
| B | 0 | 20 | 0 |
| C | 0 | 20 | 0 |
| D | 0 | 21 | 0 |
| Mode SS | |||
|---|---|---|---|
| Quadrant | BADHDUFLAG | Total packets | Discarded packets |
| A | 0 | 120 | 0 |
| B | 0 | 120 | 0 |
| C | 0 | 120 | 0 |
| D | 0 | 120 | 0 |
| Quadrant | Total seconds | Saturated seconds | Saturation percentage |
|---|---|---|---|
| A | 5914 | 8 | 0.135272% |
| B | 5914 | 134 | 2.265810% |
| C | 5914 | 65 | 1.099087% |
| D | 5914 | 292 | 4.937437% |
Noise dominated data is calculated using 1-second bins in cleaned event files. If a bin has >2000 counts, and if more than 50% of those come from <1% of pixels, then it is considered to be noise-dominated and hence unusable.
| Quadrant | # 1 sec bins | Bins with >0 counts | Bins with >2000 counts | High rate bins dominated by noise | Noise dominated (total time) | Noise dominated (detector-on time) | Marked lightcurve |
|---|---|---|---|---|---|---|---|
| A | 7227 | 5915 | 0 | 0 | 0.00% | 0.00% | 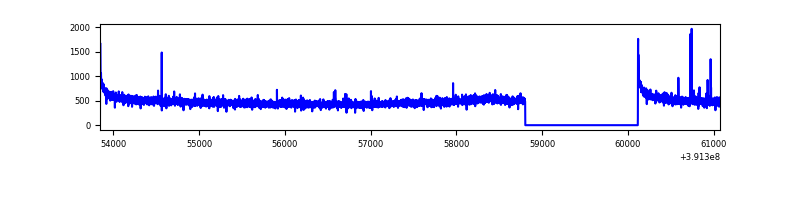 |
| B | 7227 | 5915 | 74 | 74 | 1.02% | 1.25% | 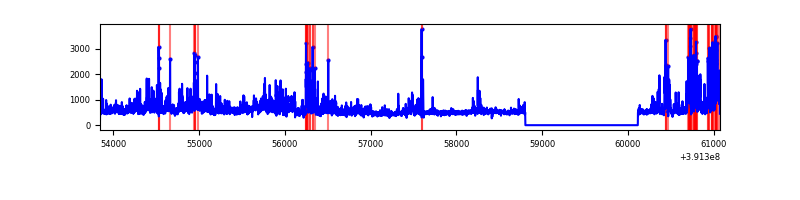 |
| C | 7227 | 5915 | 44 | 44 | 0.61% | 0.74% | 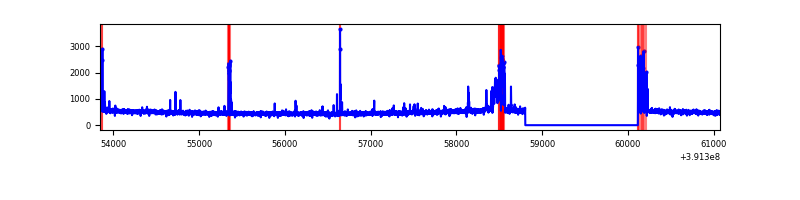 |
| D | 7227 | 5915 | 267 | 267 | 3.69% | 4.51% | 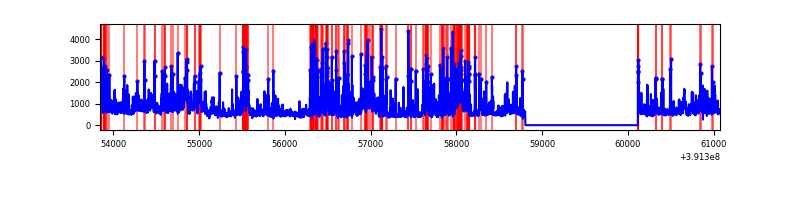 |
Top three noisy pixels from each quadrant. If the there are fewer than three noisy pixels in the level2.evt file, extra rows are filled as -1
| Pixel properties | Quadrant properties | ||||||
|---|---|---|---|---|---|---|---|
| Quadrant | DetID | PixID | Counts | Sigma | Mean | Median | Sigma |
| A | 10 | 83 | 184187 | 1302.45 | 690 | 677 | 140.9 |
| A | 10 | 255 | 11631 | 77.75 | 690 | 677 | 140.9 |
| A | 13 | 254 | 9280 | 61.06 | 690 | 677 | 140.9 |
| B | 5 | 172 | 514881 | 3947.1 | 677 | 661 | 130.3 |
| B | 0 | 190 | 351375 | 2692.04 | 677 | 661 | 130.3 |
| B | 4 | 171 | 163475 | 1249.74 | 677 | 661 | 130.3 |
| C | 15 | 214 | 248663 | 1605.21 | 660 | 664 | 154.5 |
| C | 9 | 187 | 224928 | 1451.59 | 660 | 664 | 154.5 |
| C | 0 | 10 | 77431 | 496.89 | 660 | 664 | 154.5 |
| D | 12 | 235 | 1044717 | 6434.76 | 656 | 638 | 162.3 |
| D | 12 | 6 | 511080 | 3145.9 | 656 | 638 | 162.3 |
| D | 12 | 227 | 371517 | 2285.76 | 656 | 638 | 162.3 |
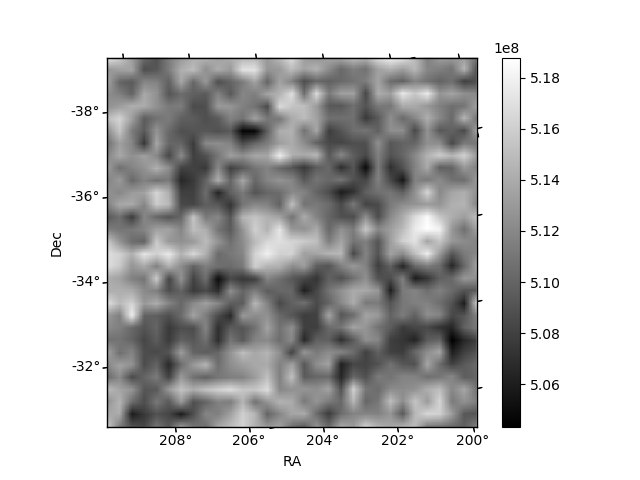
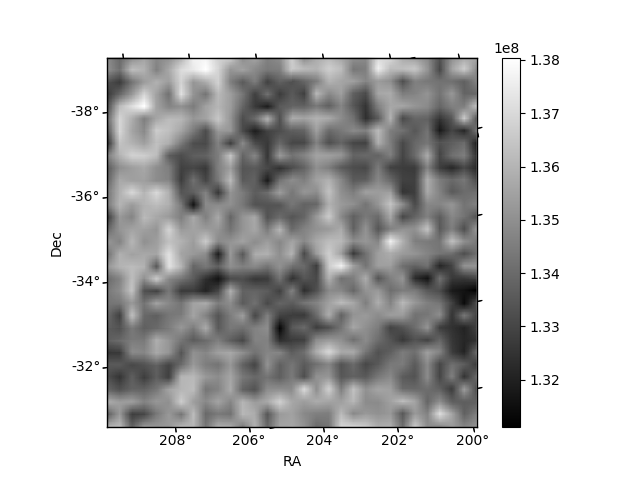
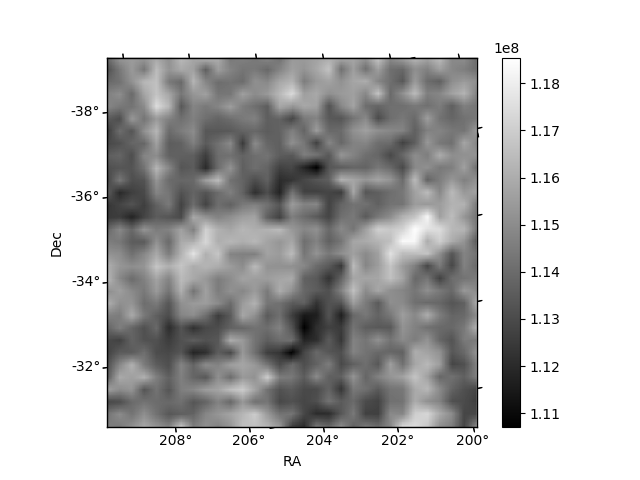
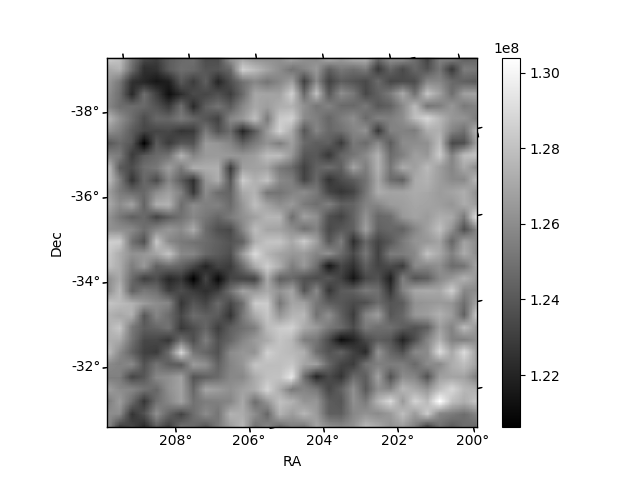
Histogram calculated using DETX and DETY for each event in the final _common_clean file
| Quadrant A | 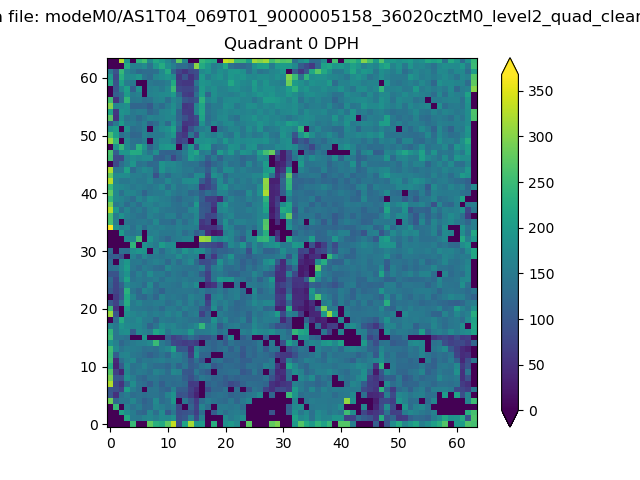 |
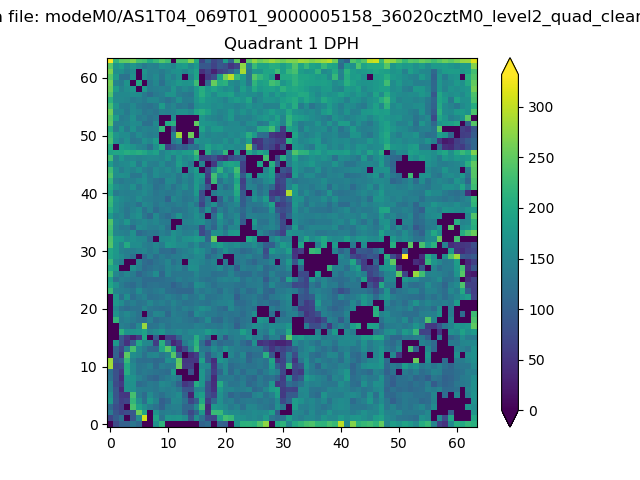 |
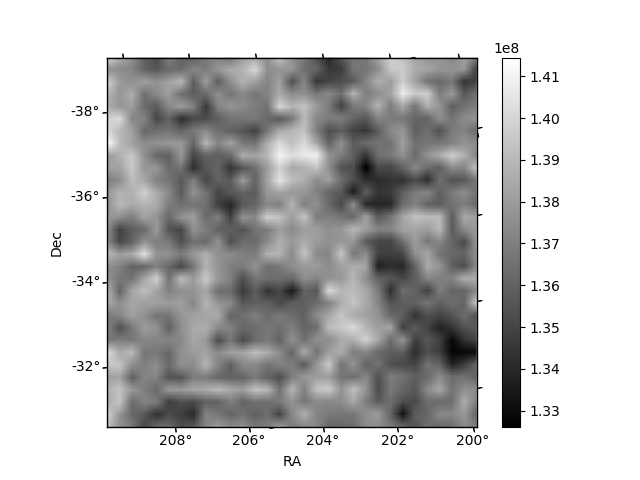
Quadrant B |
|---|---|---|---|
| Quadrant D | 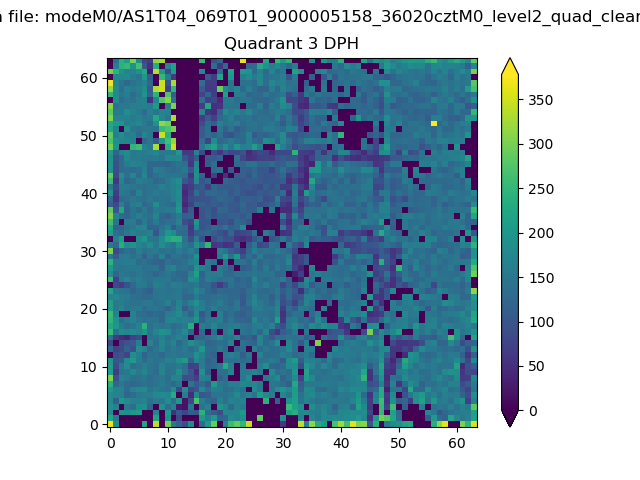 |
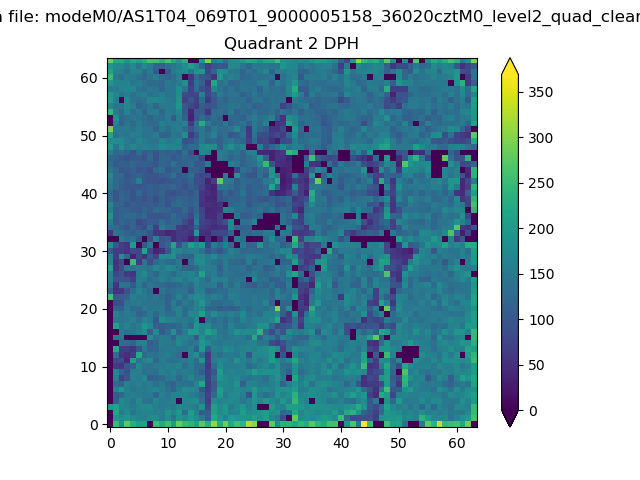 |
Quadrant C |
| Plot type | Count rate plots | Images |
|---|---|---|
| Comparison with Poisson distribution Blue bars denote a histogram of data divided into 1 sec bins. Red curve is a Poisson curve with rate = median count rate of data. |
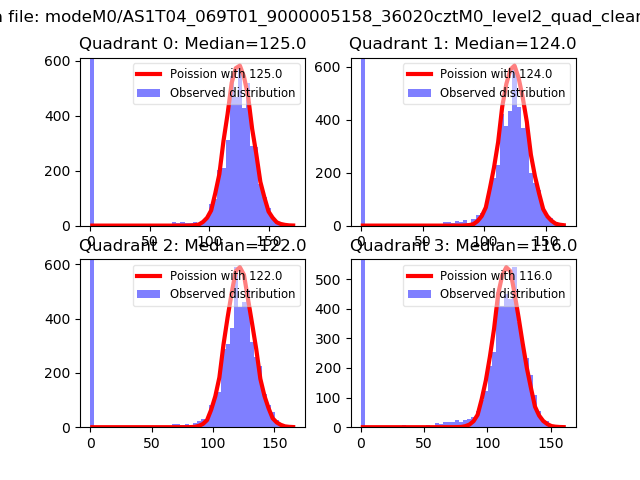 |
 |
| Quadrant-wise count rates Data is divided into 100 sec bins |
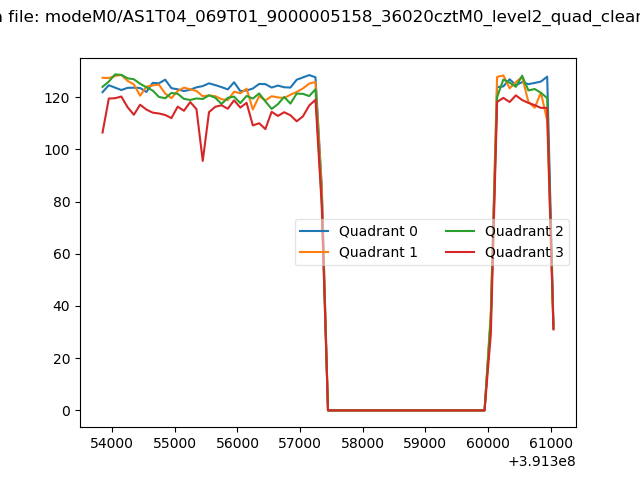 |
|
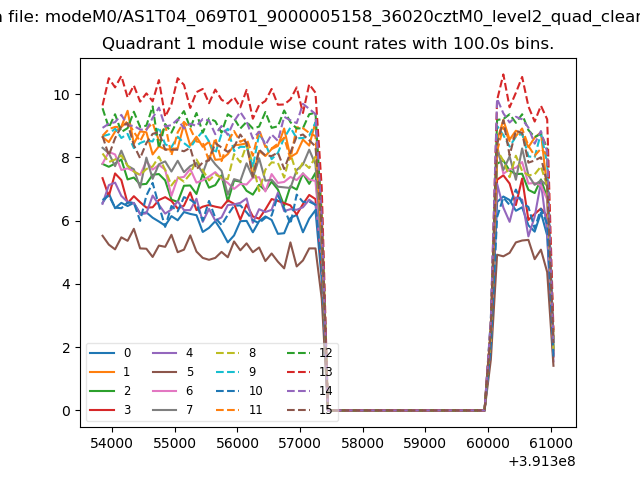
| Module-wise count rates for Quadrant A Data is divided into 100 sec bins |
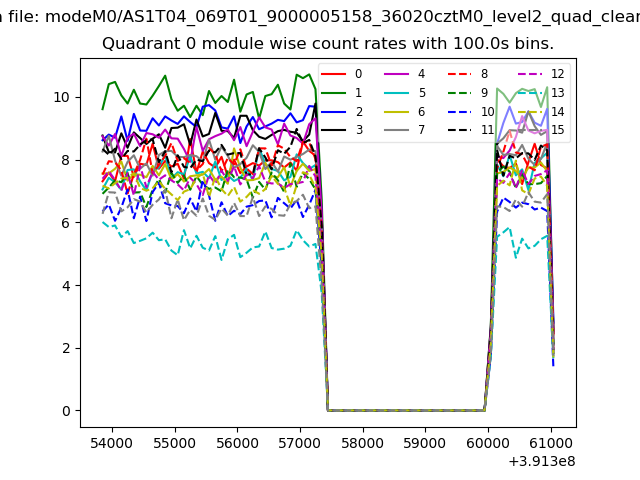 |
 |
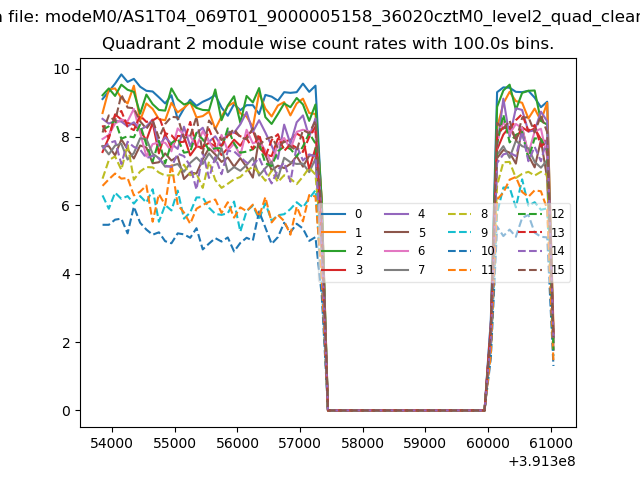
| Module-wise count rates for Quadrant B Data is divided into 100 sec bins |
 |
 |
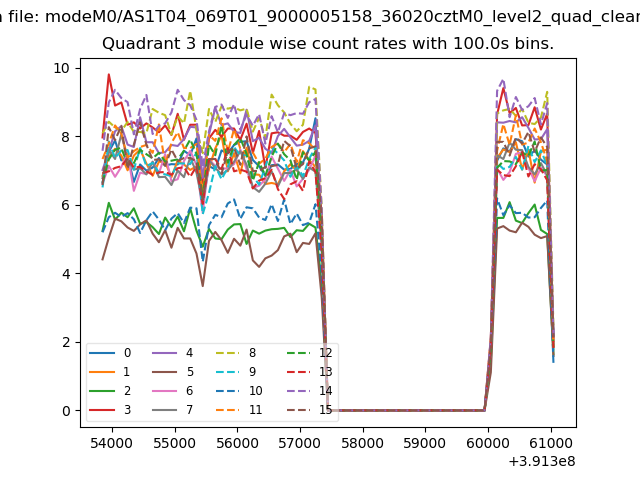
| Module-wise count rates for Quadrant C Data is divided into 100 sec bins |
 |
 |
| Module-wise count rates for Quadrant D Data is divided into 100 sec bins |
 |
 |
| Parameter | Plot |
|---|---|
| CZT HV Monitor | 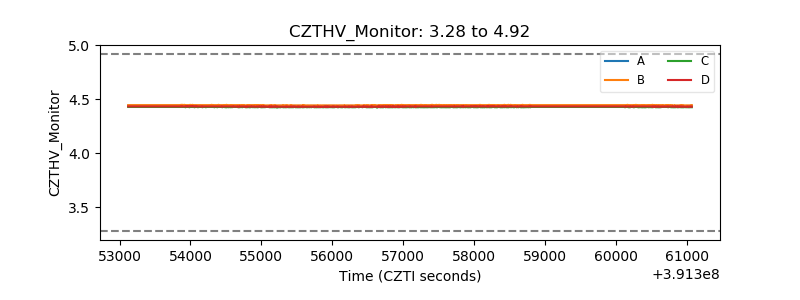 |
| D_VDD | 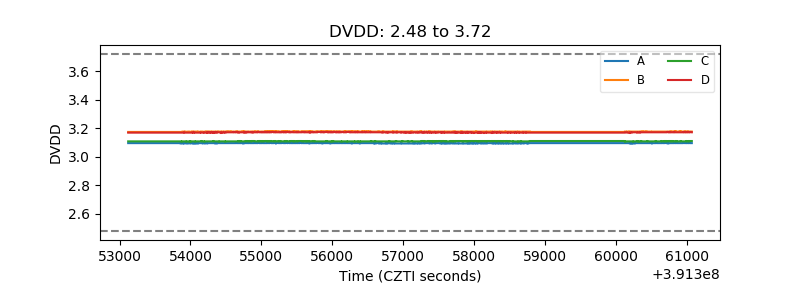 |
| Temperature 1 | 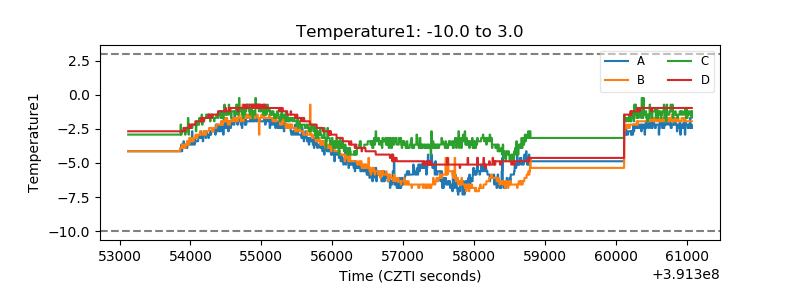 |
| Veto HV Monitor | 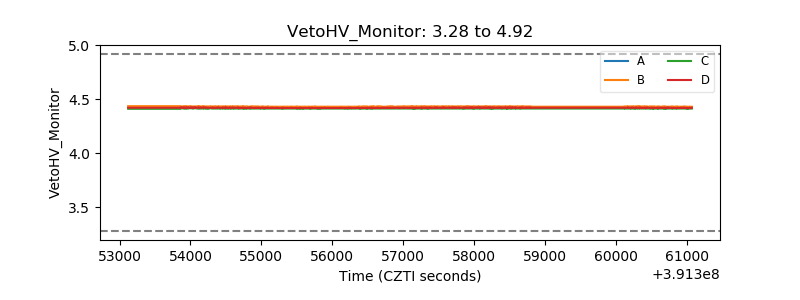 |
| Veto LLD | 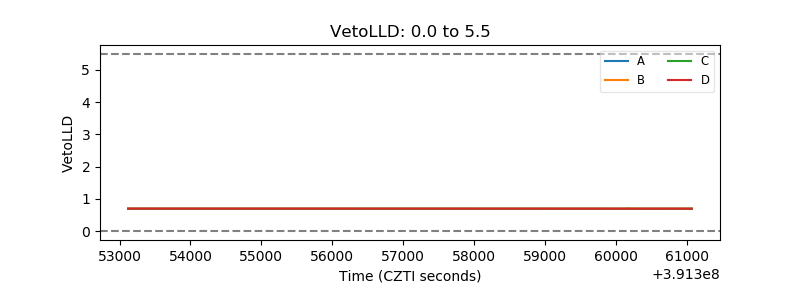 |
| Alpha Counter | 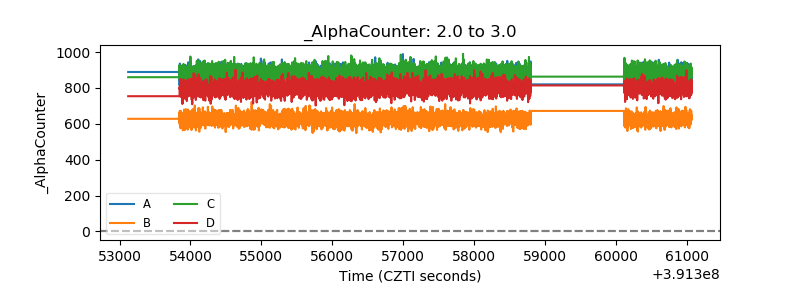 |
| _CPM_Rate | 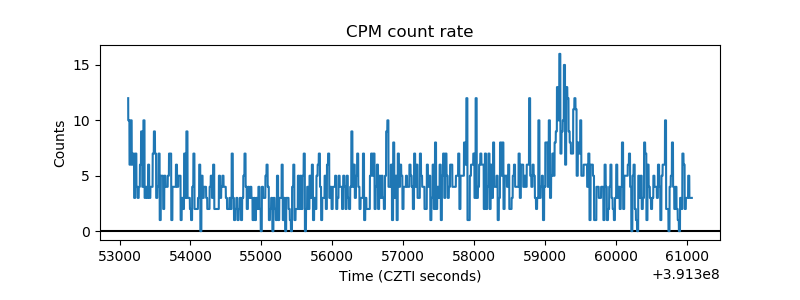 |
| CZT Counter | 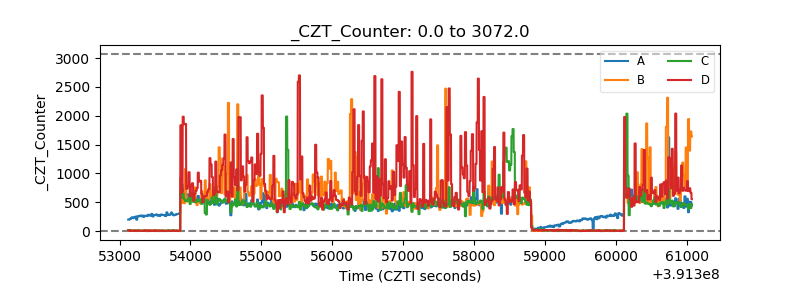 |
| +2.5 Volts monitor | 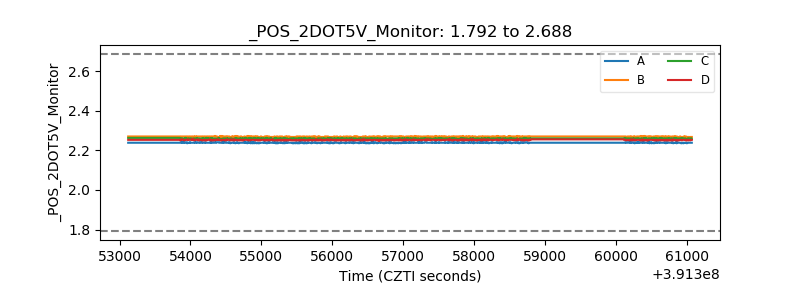 |
| +5 Volts monitor | 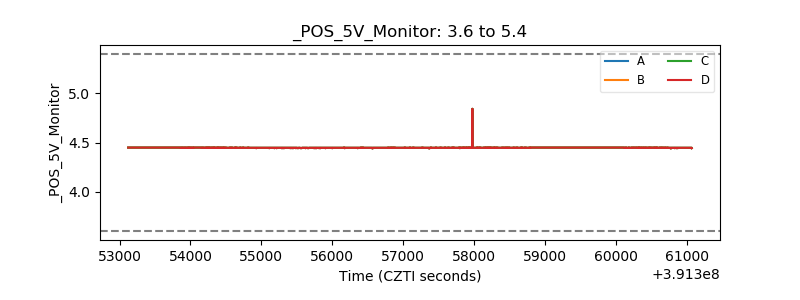 |
| _ROLL_ROT | 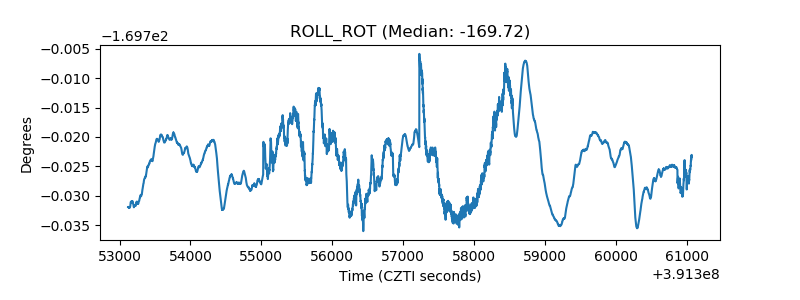 |
| _Roll_DEC | 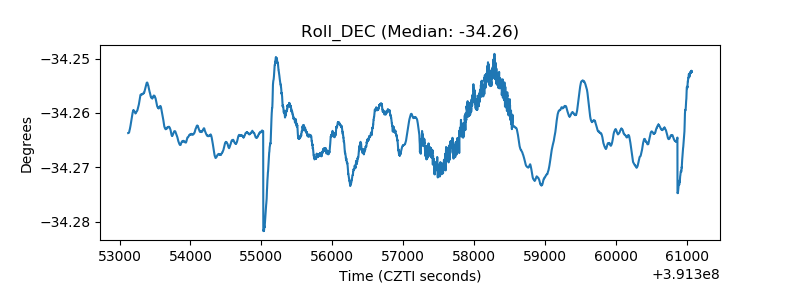 |
| _Roll_RA | 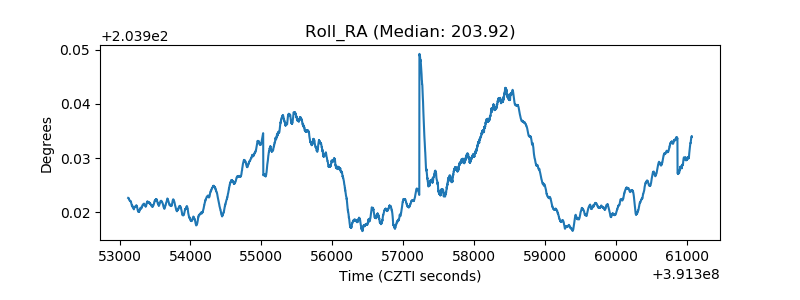 |
| Veto Counter | 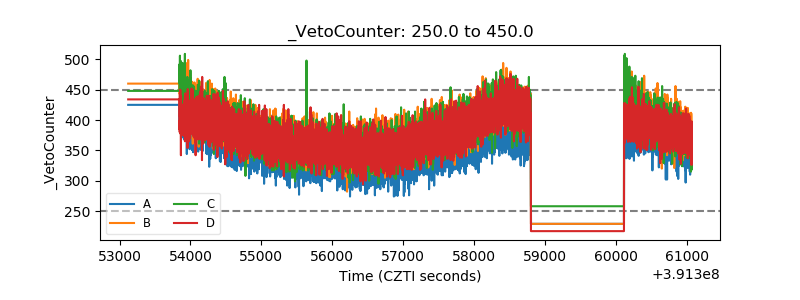 |