| Param | Original file | Final file |
|---|---|---|
| Filename | modeM0/AS1T04_069T01_9000005158_36019cztM0_level2.evt | modeM0/AS1T04_069T01_9000005158_36019cztM0_level2_quad_clean.evt |
| Size (bytes) | 636,096,960 | 84,052,800 |
| Size | 606.6 MB | 80.2 MB |
| Events in quadrant A | 2,799,273 | 575,068 |
| Events in quadrant B | 5,212,687 | 524,046 |
| Events in quadrant C | 3,387,268 | 564,213 |
| Events in quadrant D | 7,476,659 | 479,625 |
| Mode M0 | |||
|---|---|---|---|
| Quadrant | BADHDUFLAG | Total packets | Discarded packets |
| A | 0 | 11870 | 3 |
| B | 0 | 19250 | 2 |
| C | 0 | 13532 | 5 |
| D | 0 | 26269 | 2 |
| Mode M9 | |||
|---|---|---|---|
| Quadrant | BADHDUFLAG | Total packets | Discarded packets |
| A | 0 | 23 | 0 |
| B | 0 | 23 | 0 |
| C | 0 | 23 | 0 |
| D | 0 | 24 | 0 |
| Mode SS | |||
|---|---|---|---|
| Quadrant | BADHDUFLAG | Total packets | Discarded packets |
| A | 0 | 116 | 0 |
| B | 0 | 116 | 0 |
| C | 0 | 116 | 0 |
| D | 0 | 116 | 0 |
| Quadrant | Total seconds | Saturated seconds | Saturation percentage |
|---|---|---|---|
| A | 5748 | 6 | 0.104384% |
| B | 5748 | 812 | 14.126653% |
| C | 5746 | 221 | 3.846154% |
| D | 5748 | 1092 | 18.997912% |
Noise dominated data is calculated using 1-second bins in cleaned event files. If a bin has >2000 counts, and if more than 50% of those come from <1% of pixels, then it is considered to be noise-dominated and hence unusable.
| Quadrant | # 1 sec bins | Bins with >0 counts | Bins with >2000 counts | High rate bins dominated by noise | Noise dominated (total time) | Noise dominated (detector-on time) | Marked lightcurve |
|---|---|---|---|---|---|---|---|
| A | 7181 | 5749 | 0 | 0 | 0.00% | 0.00% | 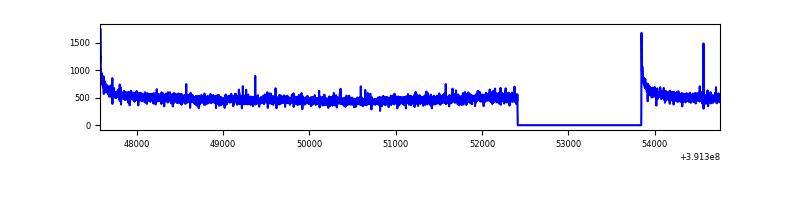 |
| B | 7181 | 5749 | 674 | 674 | 9.39% | 11.72% | 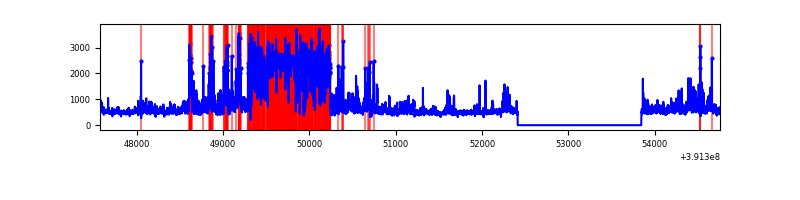 |
| C | 7181 | 5748 | 177 | 177 | 2.46% | 3.08% | 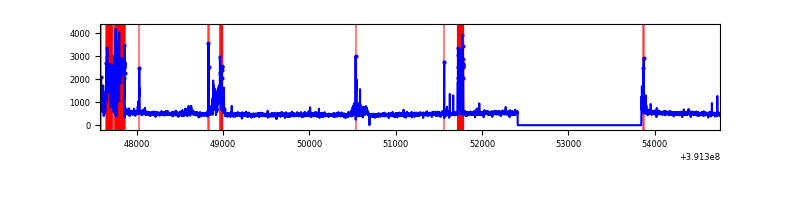 |
| D | 7181 | 5749 | 1144 | 1144 | 15.93% | 19.90% | 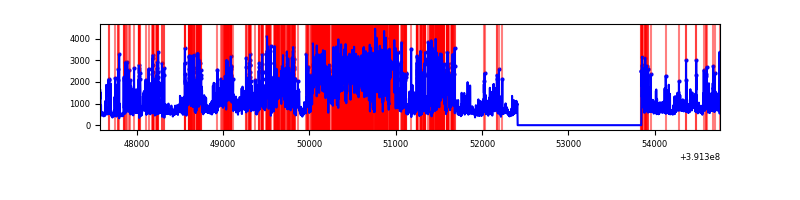 |
Top three noisy pixels from each quadrant. If the there are fewer than three noisy pixels in the level2.evt file, extra rows are filled as -1
| Pixel properties | Quadrant properties | ||||||
|---|---|---|---|---|---|---|---|
| Quadrant | DetID | PixID | Counts | Sigma | Mean | Median | Sigma |
| A | 10 | 83 | 178731 | 1303.79 | 672 | 658 | 136.6 |
| A | 13 | 6 | 13955 | 97.36 | 672 | 658 | 136.6 |
| A | 13 | 254 | 9270 | 63.05 | 672 | 658 | 136.6 |
| B | 5 | 172 | 1966452 | 16209.76 | 626 | 609 | 121.3 |
| B | 0 | 190 | 415507 | 3421.13 | 626 | 609 | 121.3 |
| B | 4 | 171 | 97438 | 798.42 | 626 | 609 | 121.3 |
| C | 9 | 187 | 591337 | 4003.93 | 631 | 635 | 147.5 |
| C | 15 | 214 | 240269 | 1624.3 | 631 | 635 | 147.5 |
| C | 0 | 10 | 90654 | 610.17 | 631 | 635 | 147.5 |
| D | 12 | 235 | 3837848 | 25546.19 | 610 | 595 | 150.2 |
| D | 12 | 6 | 650702 | 4328.03 | 610 | 595 | 150.2 |
| D | 10 | 118 | 93246 | 616.82 | 610 | 595 | 150.2 |
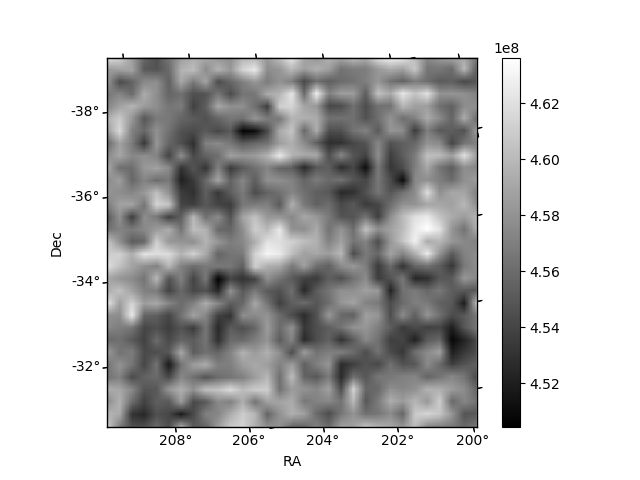
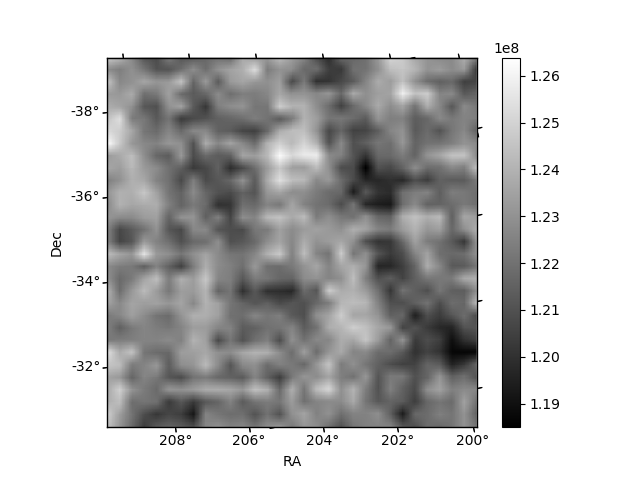
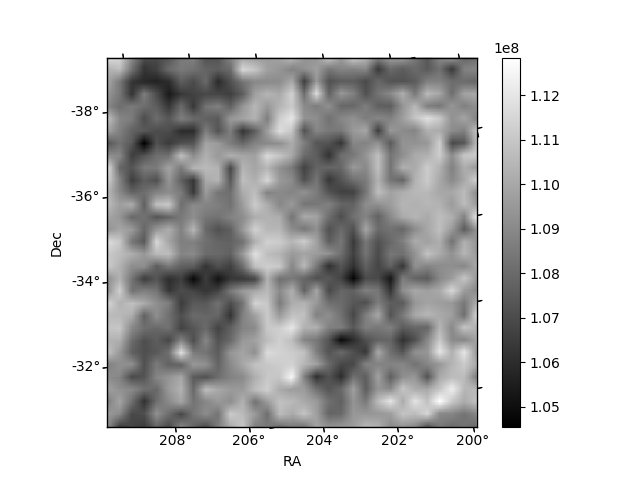
Histogram calculated using DETX and DETY for each event in the final _common_clean file
| Quadrant A | 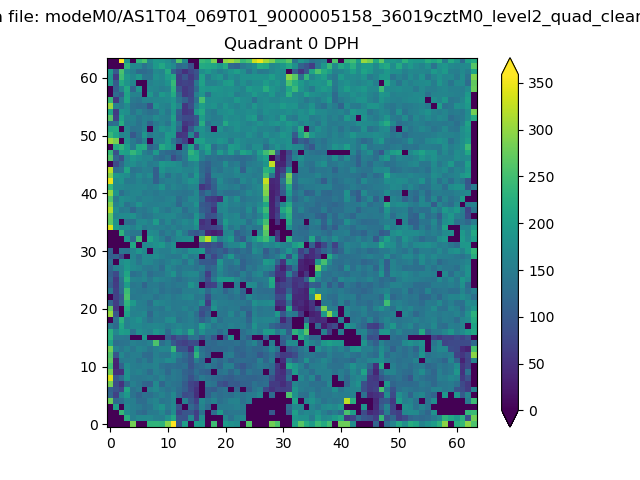 |
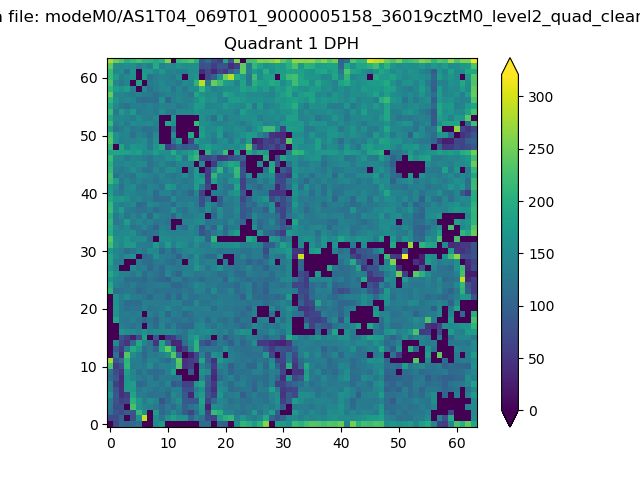 |
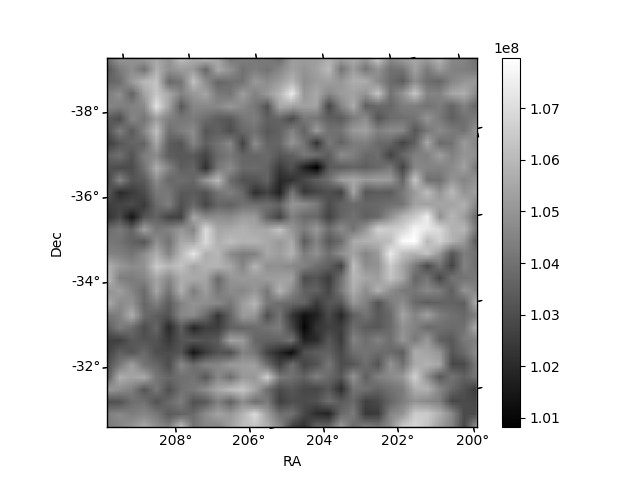
Quadrant B |
|---|---|---|---|
| Quadrant D | 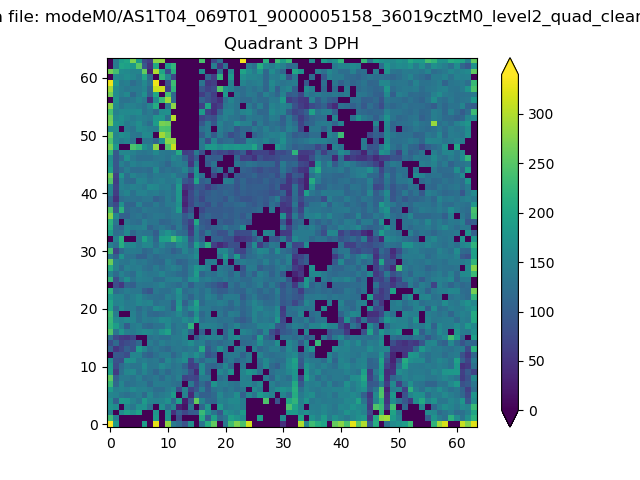 |
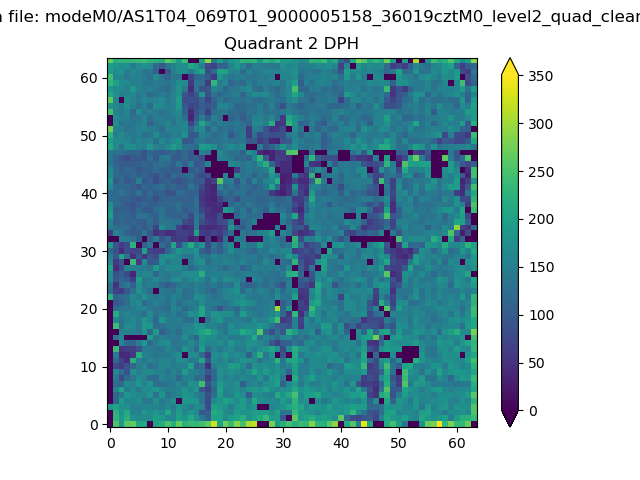 |
Quadrant C |
| Plot type | Count rate plots | Images |
|---|---|---|
| Comparison with Poisson distribution Blue bars denote a histogram of data divided into 1 sec bins. Red curve is a Poisson curve with rate = median count rate of data. |
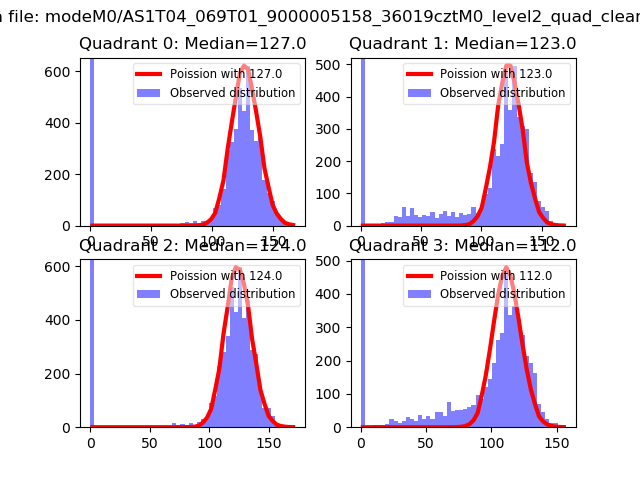 |
 |
| Quadrant-wise count rates Data is divided into 100 sec bins |
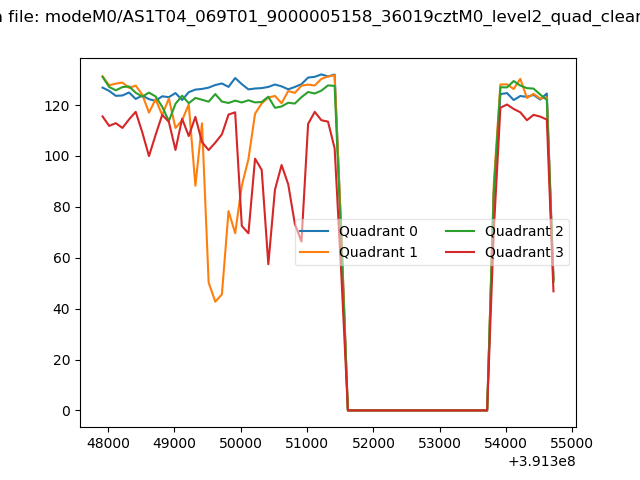 |
|
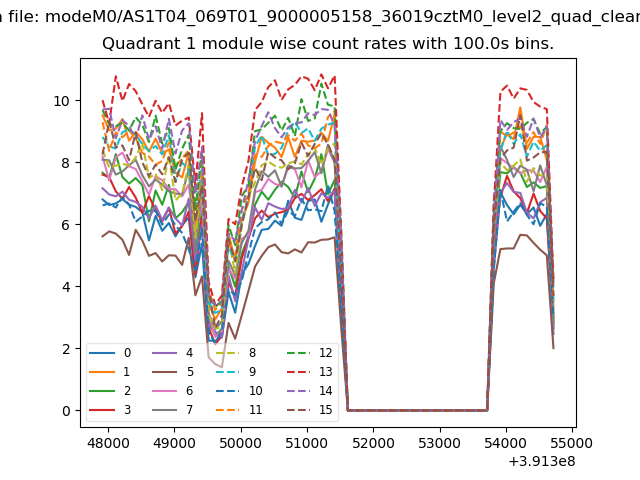
| Module-wise count rates for Quadrant A Data is divided into 100 sec bins |
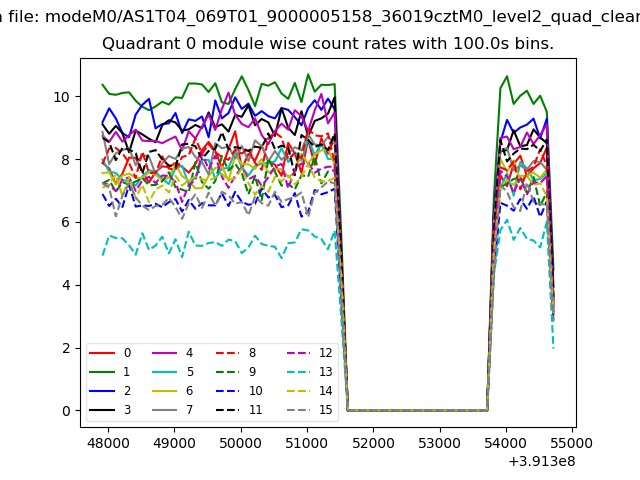 |
 |
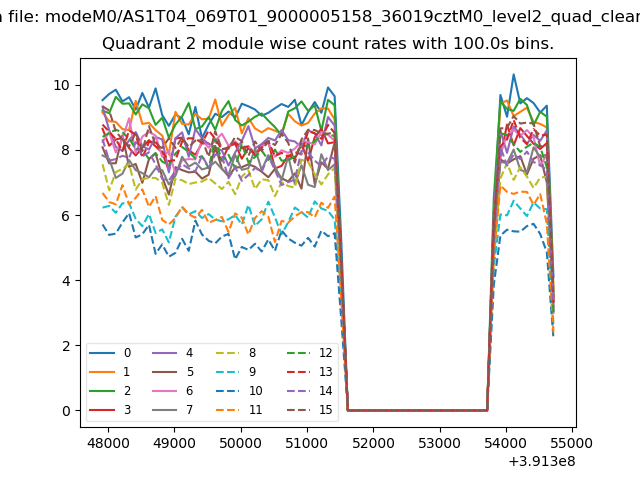
| Module-wise count rates for Quadrant B Data is divided into 100 sec bins |
 |
 |
| Module-wise count rates for Quadrant C Data is divided into 100 sec bins |
 |
 |
| Module-wise count rates for Quadrant D Data is divided into 100 sec bins |
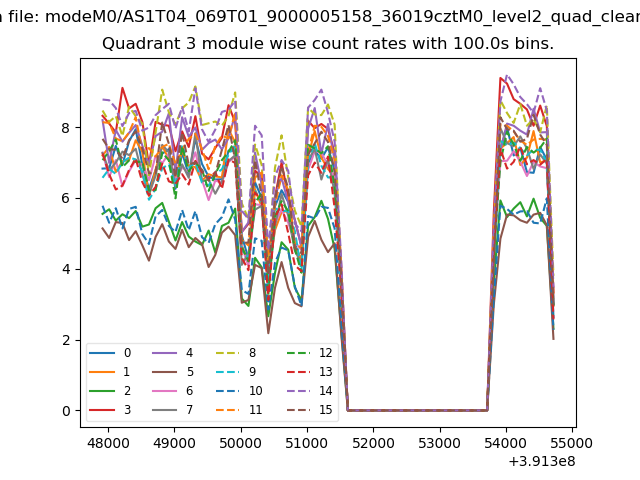 |
 |
| Parameter | Plot |
|---|---|
| CZT HV Monitor | 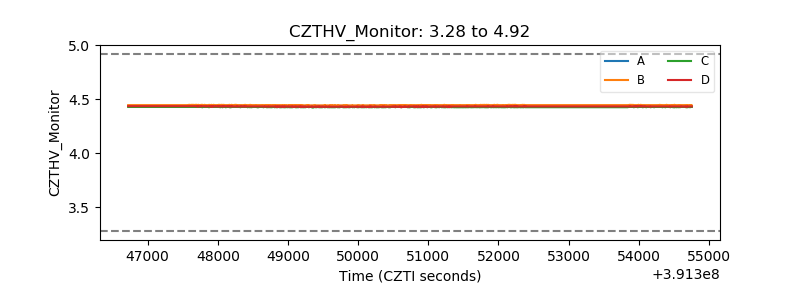 |
| D_VDD | 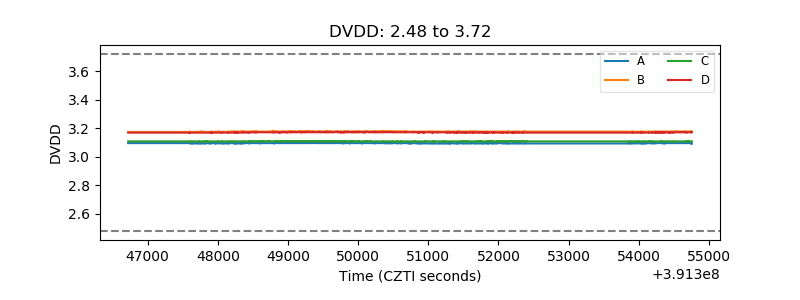 |
| Temperature 1 | 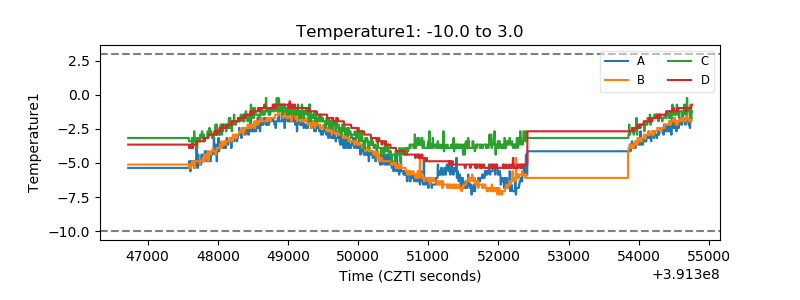 |
| Veto HV Monitor | 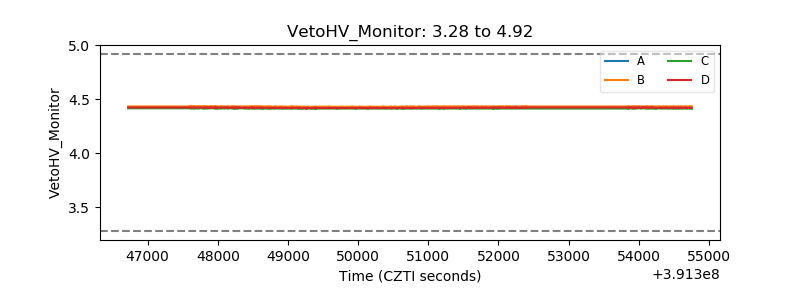 |
| Veto LLD | 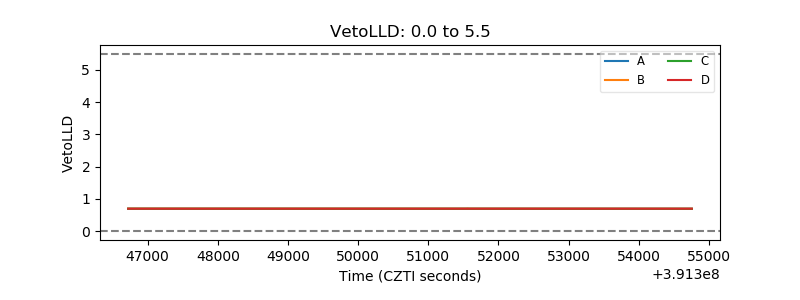 |
| Alpha Counter | 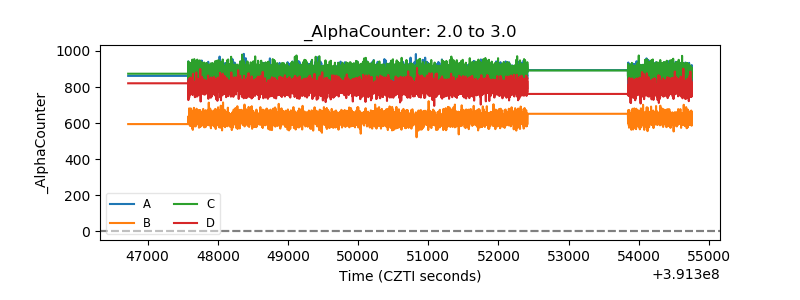 |
| _CPM_Rate | 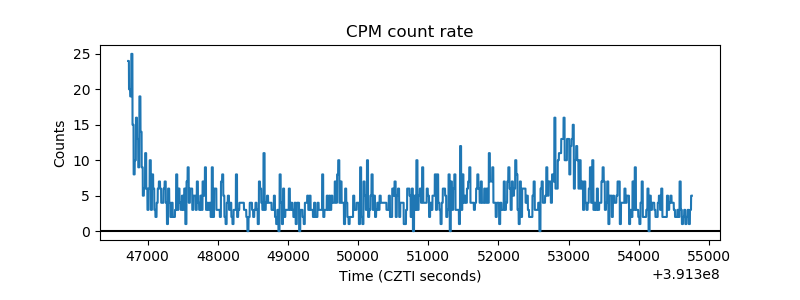 |
| CZT Counter | 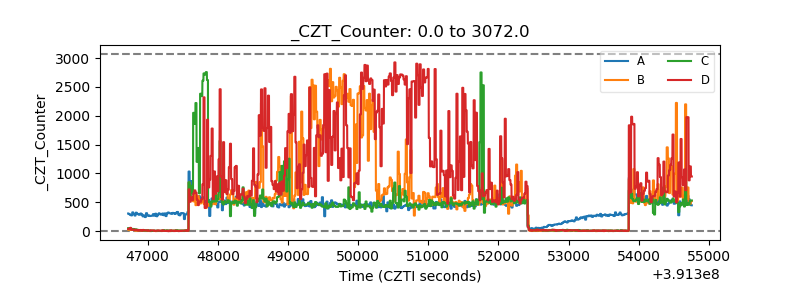 |
| +2.5 Volts monitor | 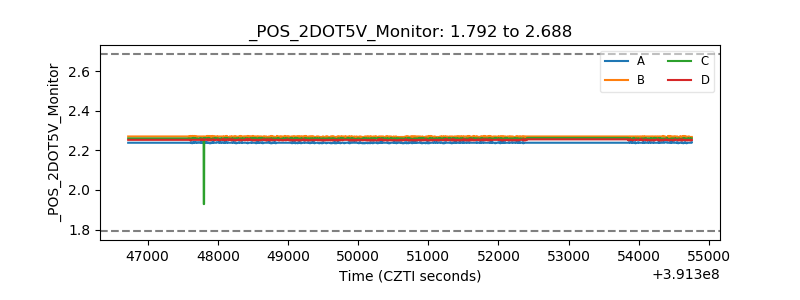 |
| +5 Volts monitor | 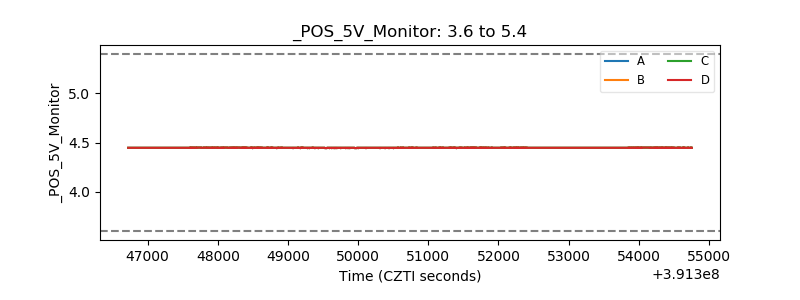 |
| _ROLL_ROT | 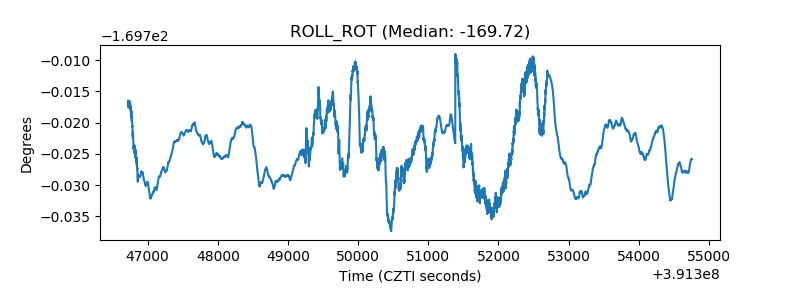 |
| _Roll_DEC | 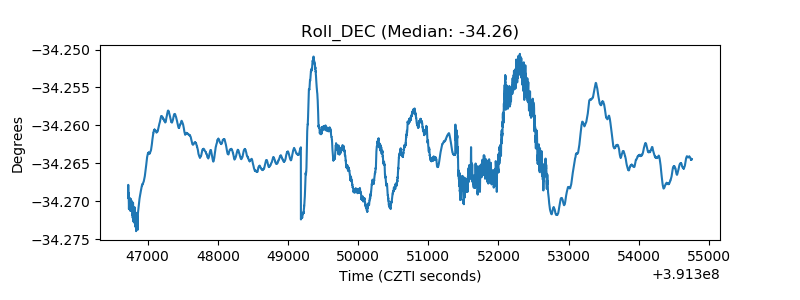 |
| _Roll_RA | 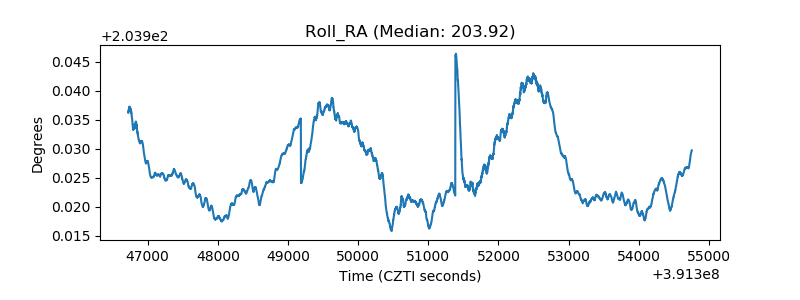 |
| Veto Counter | 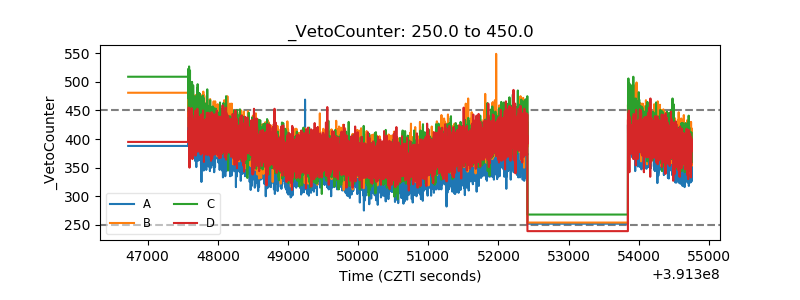 |