| Param | Original file | Final file |
|---|---|---|
| Filename | modeM0/AS1T04_069T01_9000005158_36016cztM0_level2.evt | modeM0/AS1T04_069T01_9000005158_36016cztM0_level2_quad_clean.evt |
| Size (bytes) | 471,697,920 | 55,056,960 |
| Size | 449.8 MB | 52.5 MB |
| Events in quadrant A | 2,601,742 | 354,375 |
| Events in quadrant B | 3,023,152 | 358,343 |
| Events in quadrant C | 4,864,307 | 286,203 |
| Events in quadrant D | 3,462,095 | 322,134 |
| Mode M0 | |||
|---|---|---|---|
| Quadrant | BADHDUFLAG | Total packets | Discarded packets |
| A | 0 | 10465 | 3 |
| B | 0 | 11942 | 2 |
| C | 0 | 17513 | 2 |
| D | 0 | 13163 | 2 |
| Mode M9 | |||
|---|---|---|---|
| Quadrant | BADHDUFLAG | Total packets | Discarded packets |
| A | 0 | 30 | 0 |
| B | 0 | 30 | 0 |
| C | 0 | 30 | 0 |
| D | 0 | 31 | 0 |
| Mode SS | |||
|---|---|---|---|
| Quadrant | BADHDUFLAG | Total packets | Discarded packets |
| A | 0 | 98 | 0 |
| B | 0 | 98 | 0 |
| C | 0 | 98 | 0 |
| D | 0 | 98 | 0 |
| Quadrant | Total seconds | Saturated seconds | Saturation percentage |
|---|---|---|---|
| A | 4931 | 15 | 0.304198% |
| B | 4931 | 63 | 1.277631% |
| C | 4931 | 937 | 19.002231% |
| D | 4931 | 268 | 5.435003% |
Noise dominated data is calculated using 1-second bins in cleaned event files. If a bin has >2000 counts, and if more than 50% of those come from <1% of pixels, then it is considered to be noise-dominated and hence unusable.
| Quadrant | # 1 sec bins | Bins with >0 counts | Bins with >2000 counts | High rate bins dominated by noise | Noise dominated (total time) | Noise dominated (detector-on time) | Marked lightcurve |
|---|---|---|---|---|---|---|---|
| A | 7053 | 4932 | 7 | 7 | 0.10% | 0.14% | 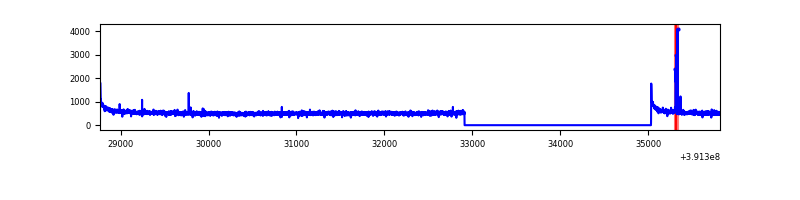 |
| B | 7053 | 4932 | 26 | 26 | 0.37% | 0.53% | 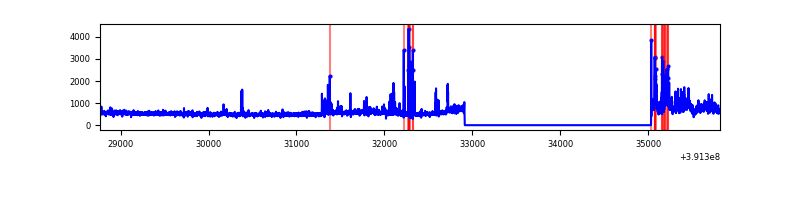 |
| C | 7053 | 4932 | 738 | 738 | 10.46% | 14.96% | 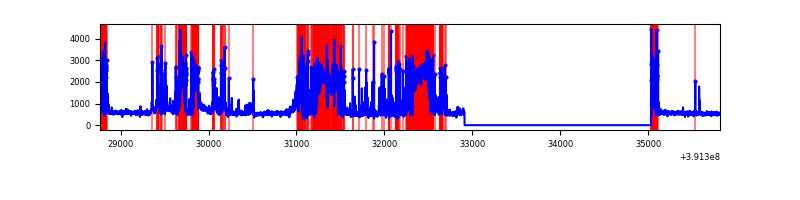 |
| D | 7053 | 4931 | 244 | 244 | 3.46% | 4.95% | 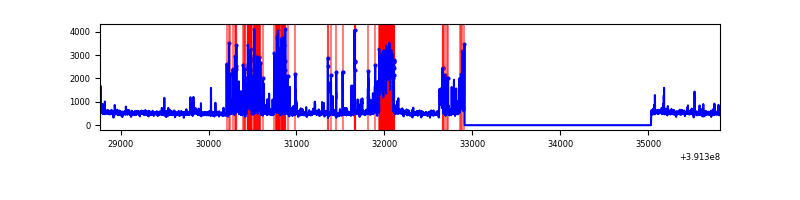 |
Top three noisy pixels from each quadrant. If the there are fewer than three noisy pixels in the level2.evt file, extra rows are filled as -1
| Pixel properties | Quadrant properties | ||||||
|---|---|---|---|---|---|---|---|
| Quadrant | DetID | PixID | Counts | Sigma | Mean | Median | Sigma |
| A | 10 | 83 | 160632 | 1270.87 | 622 | 611 | 125.9 |
| A | 10 | 248 | 23685 | 183.25 | 622 | 611 | 125.9 |
| A | 13 | 254 | 8397 | 61.84 | 622 | 611 | 125.9 |
| B | 0 | 213 | 289798 | 2473.86 | 617 | 602 | 116.9 |
| B | 5 | 172 | 103458 | 879.86 | 617 | 602 | 116.9 |
| B | 4 | 171 | 65692 | 556.8 | 617 | 602 | 116.9 |
| C | 9 | 187 | 2432909 | 19513.64 | 537 | 541 | 124.6 |
| C | 15 | 214 | 187079 | 1496.5 | 537 | 541 | 124.6 |
| C | 0 | 10 | 140176 | 1120.22 | 537 | 541 | 124.6 |
| D | 12 | 6 | 387411 | 2670.55 | 597 | 582 | 144.9 |
| D | 12 | 227 | 356794 | 2459.18 | 597 | 582 | 144.9 |
| D | 12 | 235 | 117040 | 803.99 | 597 | 582 | 144.9 |
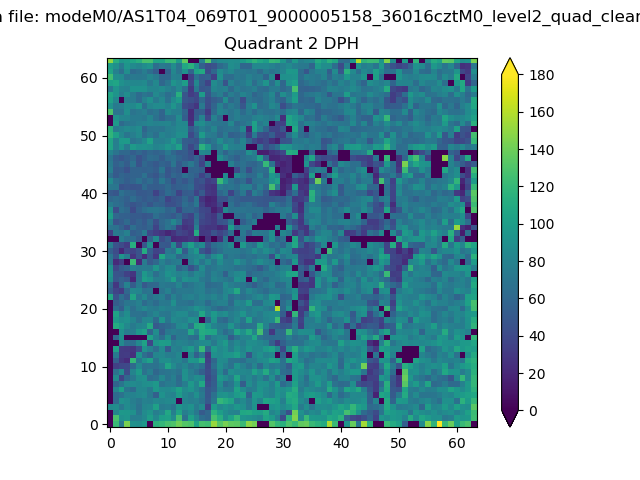
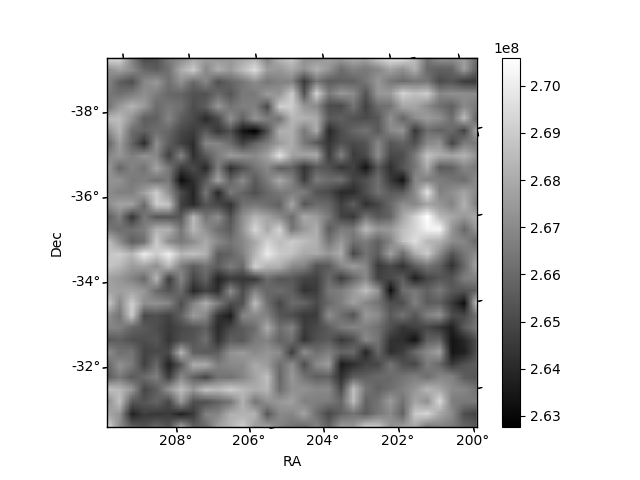
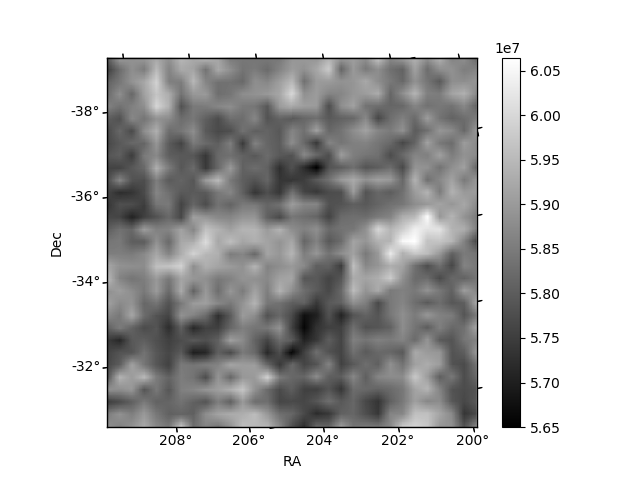
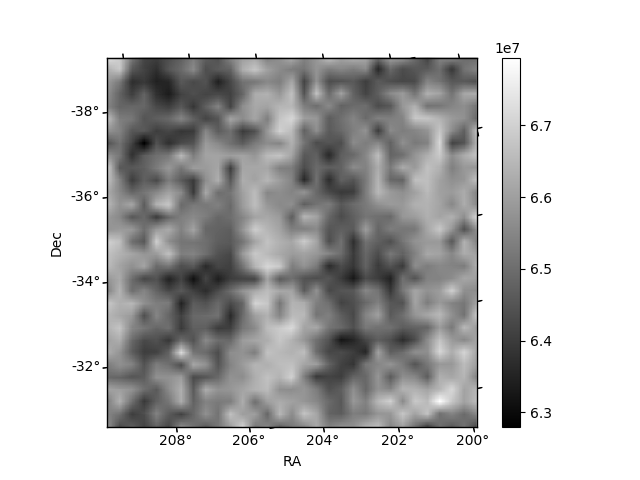
Histogram calculated using DETX and DETY for each event in the final _common_clean file
| Quadrant A | 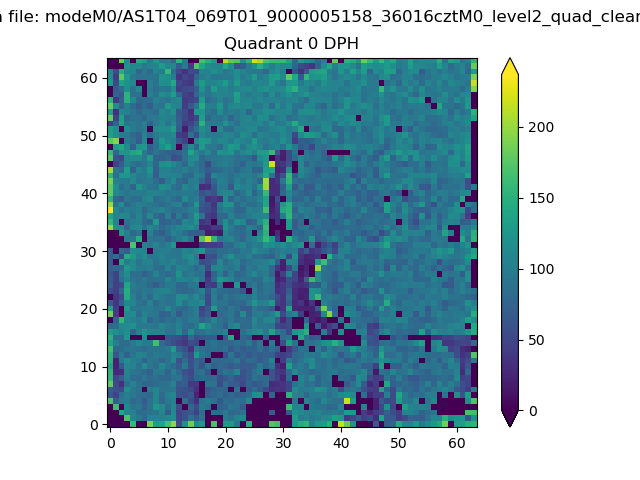 |
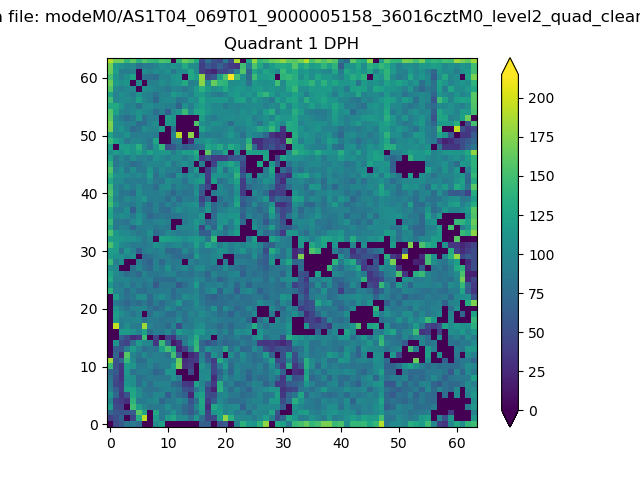 |
Quadrant B |
|---|---|---|---|
| Quadrant D | 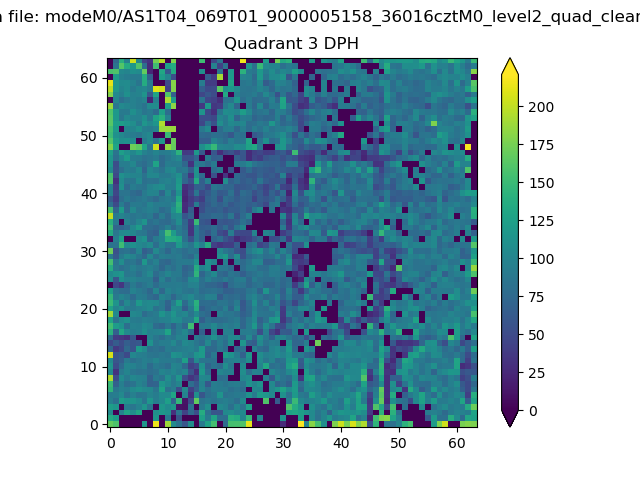 |
 |
Quadrant C |
| Plot type | Count rate plots | Images |
|---|---|---|
| Comparison with Poisson distribution Blue bars denote a histogram of data divided into 1 sec bins. Red curve is a Poisson curve with rate = median count rate of data. |
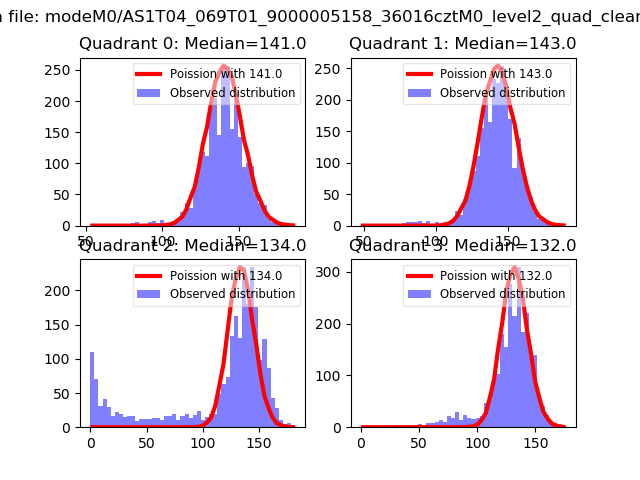 |
 |
| Quadrant-wise count rates Data is divided into 100 sec bins |
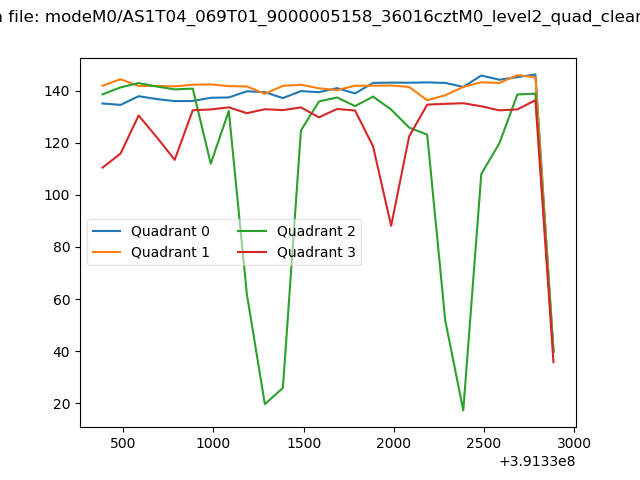 |
|
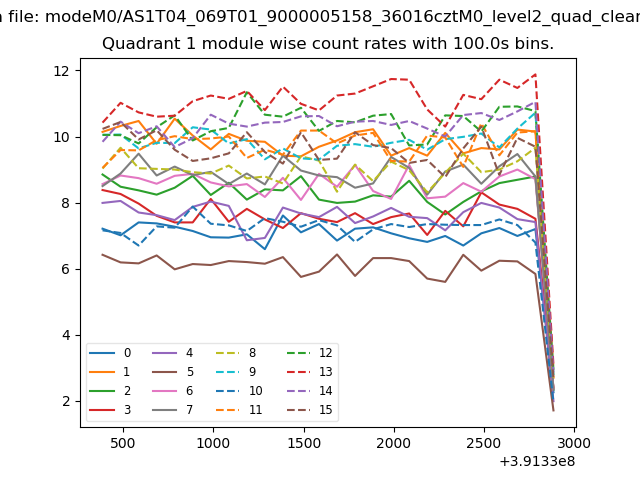
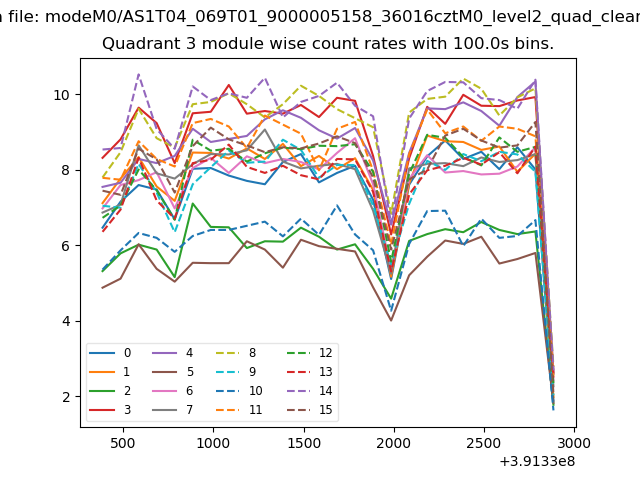
| Module-wise count rates for Quadrant A Data is divided into 100 sec bins |
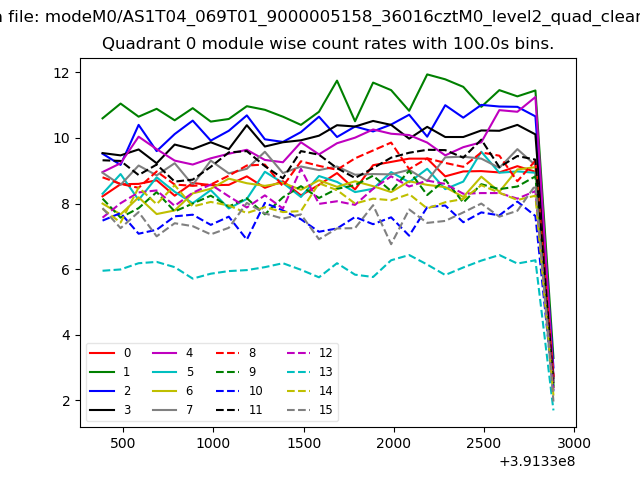 |
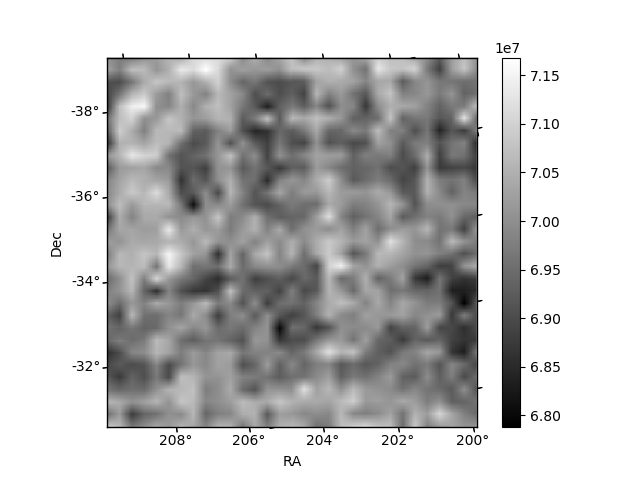 |
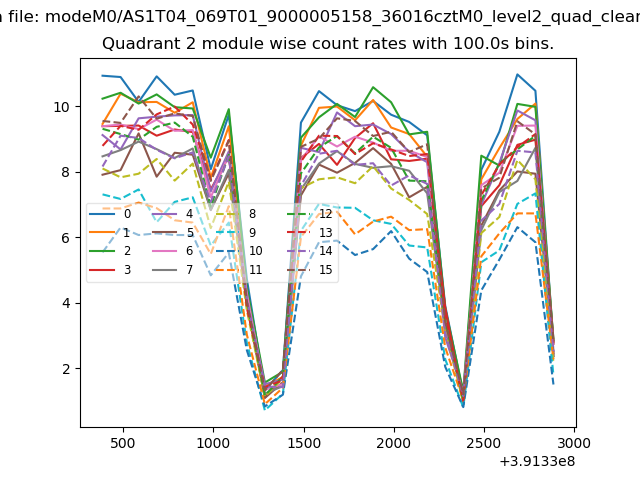
| Module-wise count rates for Quadrant B Data is divided into 100 sec bins |
 |
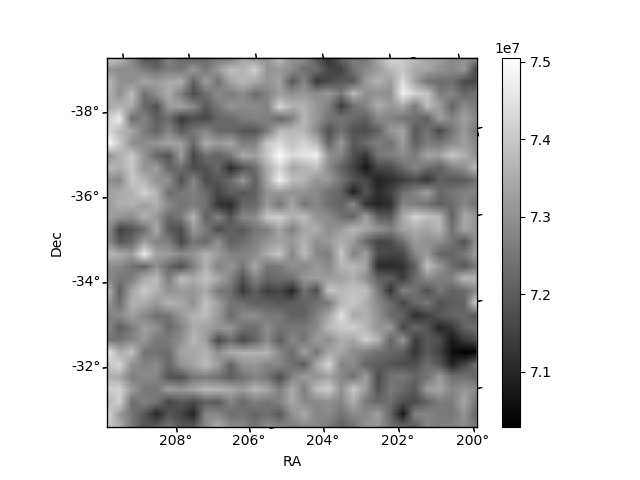 |
| Module-wise count rates for Quadrant C Data is divided into 100 sec bins |
 |
 |
| Module-wise count rates for Quadrant D Data is divided into 100 sec bins |
 |
 |
| Parameter | Plot |
|---|---|
| CZT HV Monitor | 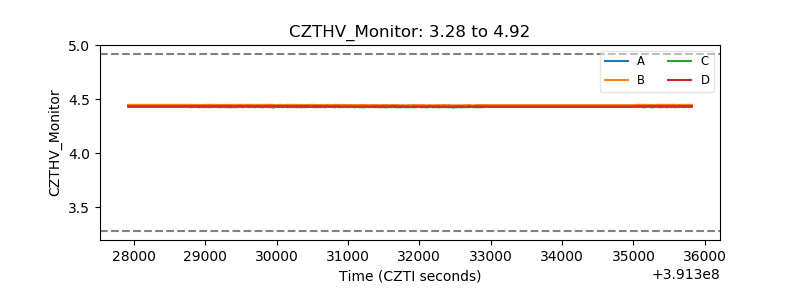 |
| D_VDD | 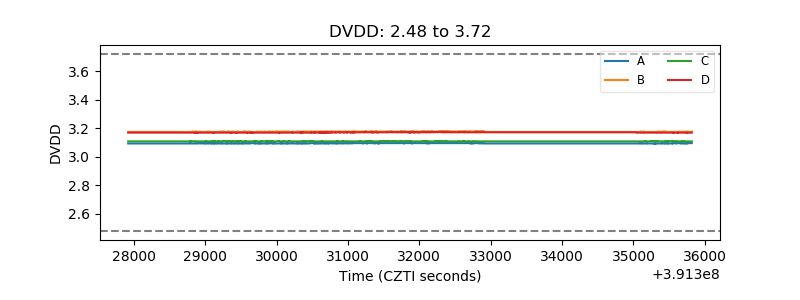 |
| Temperature 1 | 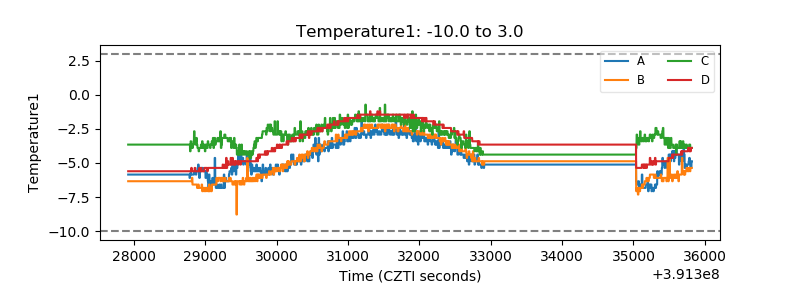 |
| Veto HV Monitor | 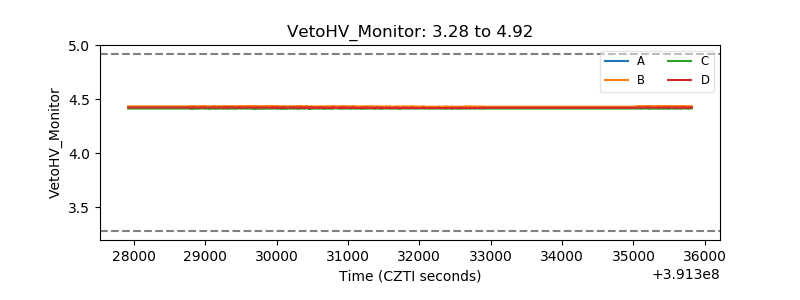 |
| Veto LLD | 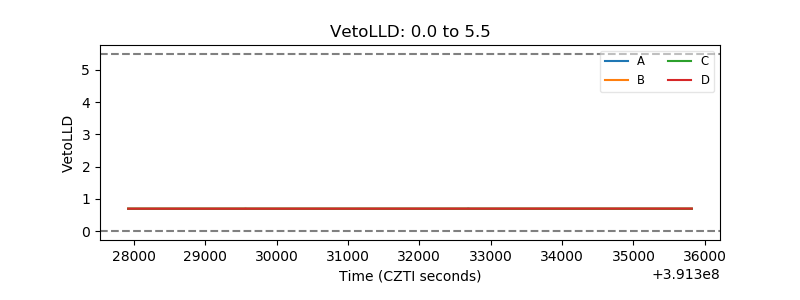 |
| Alpha Counter | 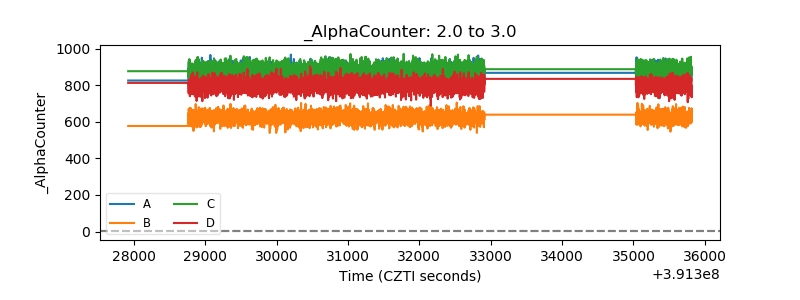 |
| _CPM_Rate | 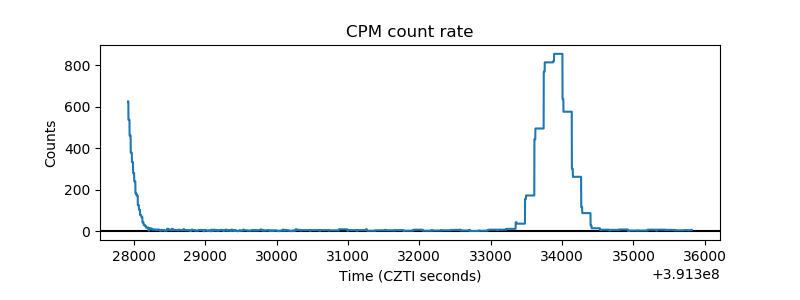 |
| CZT Counter | 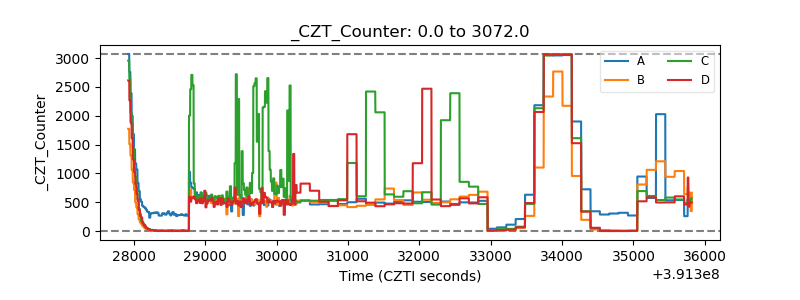 |
| +2.5 Volts monitor | 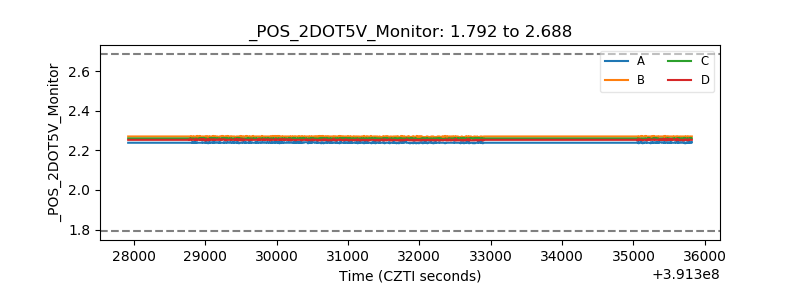 |
| +5 Volts monitor | 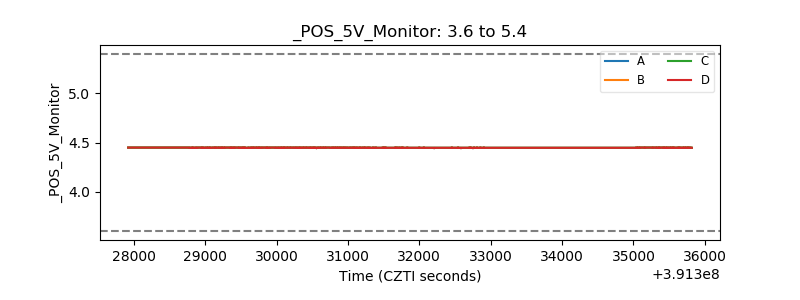 |
| _ROLL_ROT | 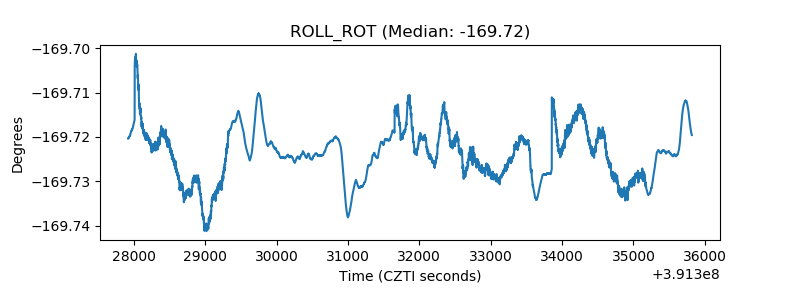 |
| _Roll_DEC | 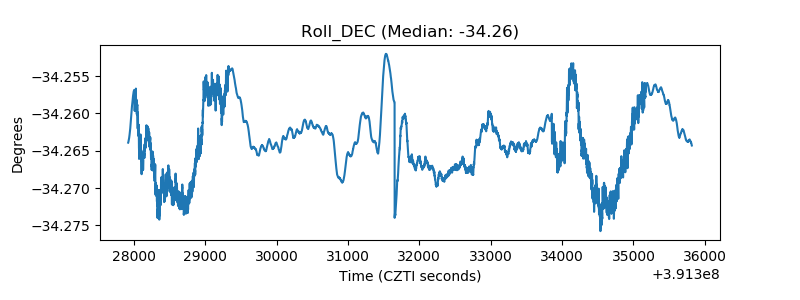 |
| _Roll_RA | 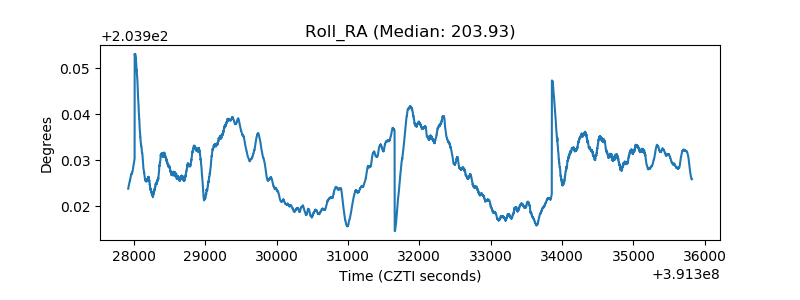 |
| Veto Counter | 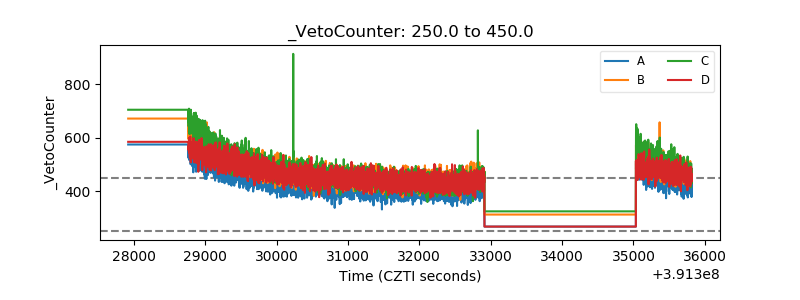 |