| Param | Original file | Final file |
|---|---|---|
| Filename | modeM0/AS1T04_069T01_9000005158_36014cztM0_level2.evt | modeM0/AS1T04_069T01_9000005158_36014cztM0_level2_quad_clean.evt |
| Size (bytes) | 497,926,080 | 49,619,520 |
| Size | 474.9 MB | 47.3 MB |
| Events in quadrant A | 2,778,222 | 289,762 |
| Events in quadrant B | 2,907,206 | 296,067 |
| Events in quadrant C | 4,135,043 | 284,262 |
| Events in quadrant D | 4,900,992 | 261,288 |
| Mode M0 | |||
|---|---|---|---|
| Quadrant | BADHDUFLAG | Total packets | Discarded packets |
| A | 0 | 11186 | 3 |
| B | 0 | 11695 | 2 |
| C | 0 | 15514 | 2 |
| D | 0 | 18399 | 2 |
| Mode M9 | |||
|---|---|---|---|
| Quadrant | BADHDUFLAG | Total packets | Discarded packets |
| A | 0 | 29 | 0 |
| B | 0 | 29 | 0 |
| C | 0 | 29 | 0 |
| D | 0 | 30 | 0 |
| Mode SS | |||
|---|---|---|---|
| Quadrant | BADHDUFLAG | Total packets | Discarded packets |
| A | 0 | 108 | 0 |
| B | 0 | 108 | 0 |
| C | 0 | 108 | 0 |
| D | 0 | 108 | 0 |
| Quadrant | Total seconds | Saturated seconds | Saturation percentage |
|---|---|---|---|
| A | 5291 | 7 | 0.132300% |
| B | 5291 | 25 | 0.472500% |
| C | 5291 | 307 | 5.802306% |
| D | 5291 | 263 | 4.970705% |
Noise dominated data is calculated using 1-second bins in cleaned event files. If a bin has >2000 counts, and if more than 50% of those come from <1% of pixels, then it is considered to be noise-dominated and hence unusable.
| Quadrant | # 1 sec bins | Bins with >0 counts | Bins with >2000 counts | High rate bins dominated by noise | Noise dominated (total time) | Noise dominated (detector-on time) | Marked lightcurve |
|---|---|---|---|---|---|---|---|
| A | 7325 | 5292 | 0 | 0 | 0.00% | 0.00% | 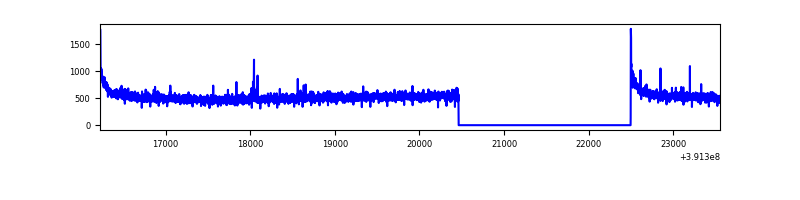 |
| B | 7325 | 5292 | 12 | 12 | 0.16% | 0.23% | 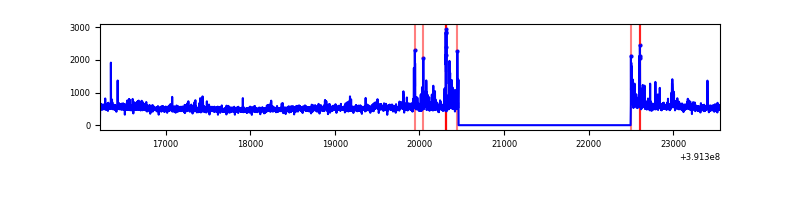 |
| C | 7325 | 5292 | 271 | 271 | 3.70% | 5.12% | 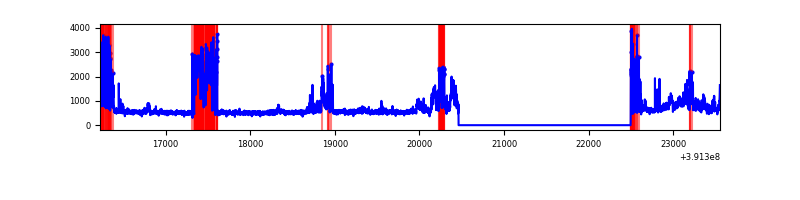 |
| D | 7325 | 5292 | 224 | 224 | 3.06% | 4.23% | 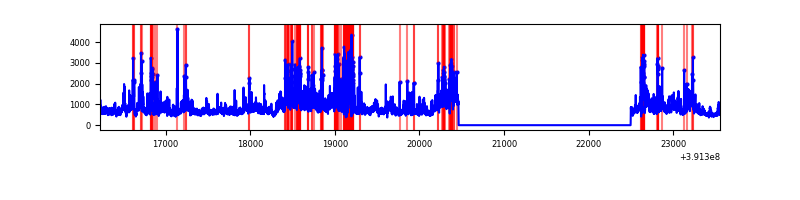 |
Top three noisy pixels from each quadrant. If the there are fewer than three noisy pixels in the level2.evt file, extra rows are filled as -1
| Pixel properties | Quadrant properties | ||||||
|---|---|---|---|---|---|---|---|
| Quadrant | DetID | PixID | Counts | Sigma | Mean | Median | Sigma |
| A | 10 | 83 | 164695 | 1226.84 | 668 | 657 | 133.7 |
| A | 2 | 247 | 16994 | 122.18 | 668 | 657 | 133.7 |
| A | 13 | 6 | 8988 | 62.31 | 668 | 657 | 133.7 |
| B | 5 | 172 | 96100 | 755.75 | 670 | 654 | 126.3 |
| B | 4 | 171 | 62305 | 488.16 | 670 | 654 | 126.3 |
| B | 0 | 182 | 28116 | 217.44 | 670 | 654 | 126.3 |
| C | 9 | 187 | 1222935 | 8318.55 | 645 | 652 | 146.9 |
| C | 15 | 214 | 219417 | 1488.86 | 645 | 652 | 146.9 |
| C | 0 | 10 | 173595 | 1177.01 | 645 | 652 | 146.9 |
| D | 12 | 227 | 1218216 | 7775.58 | 640 | 625 | 156.6 |
| D | 12 | 235 | 435835 | 2779.27 | 640 | 625 | 156.6 |
| D | 12 | 6 | 353020 | 2250.41 | 640 | 625 | 156.6 |
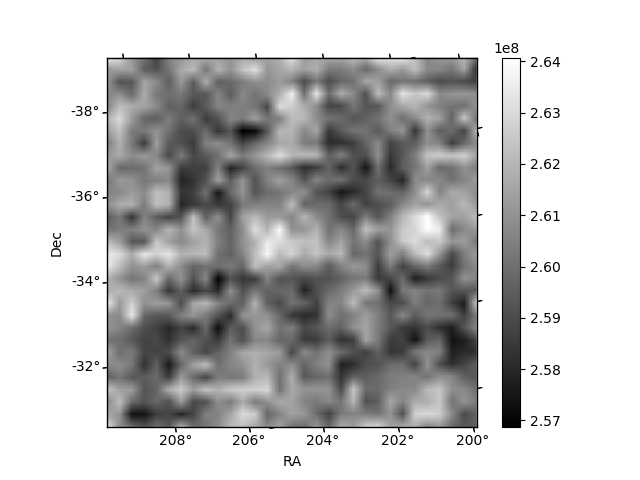
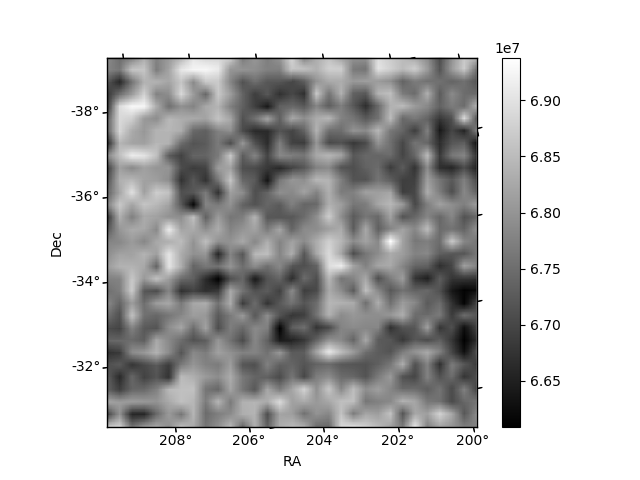
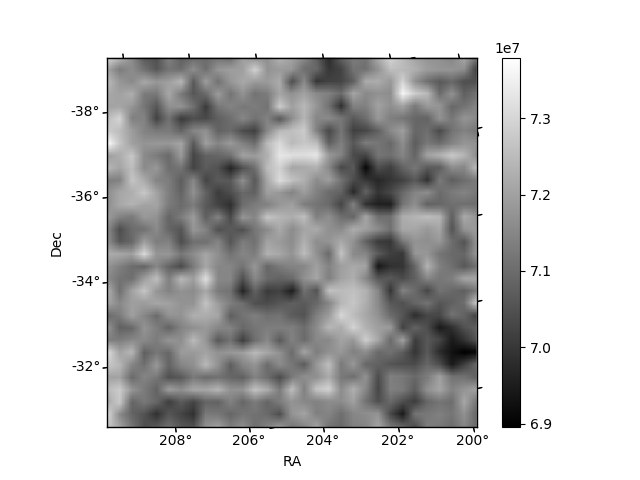
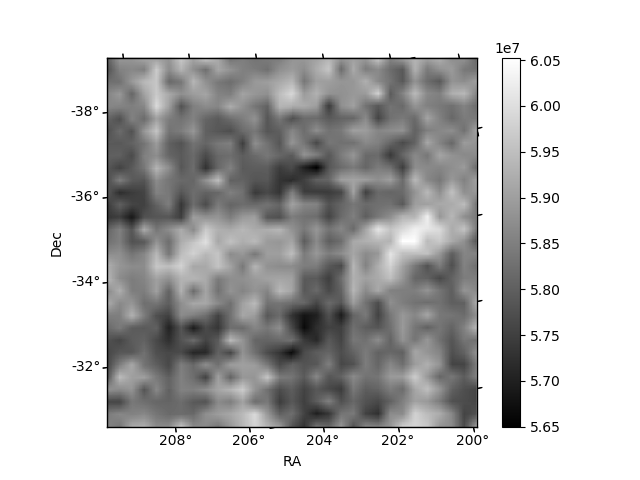
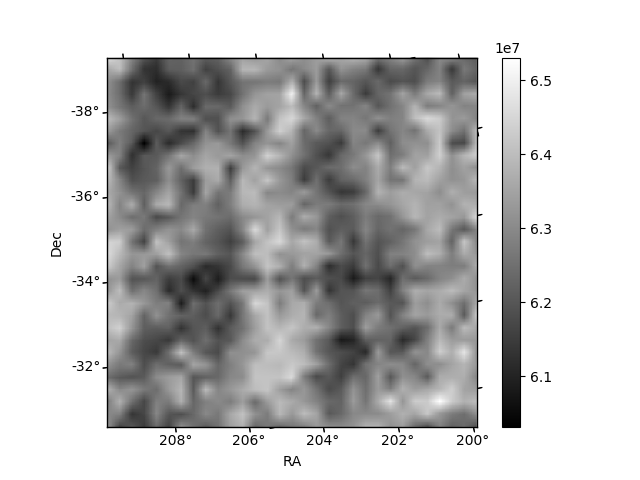
Histogram calculated using DETX and DETY for each event in the final _common_clean file
| Quadrant A | 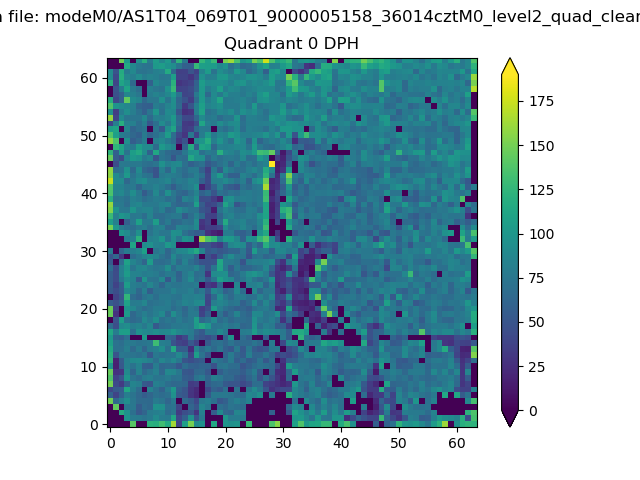 |
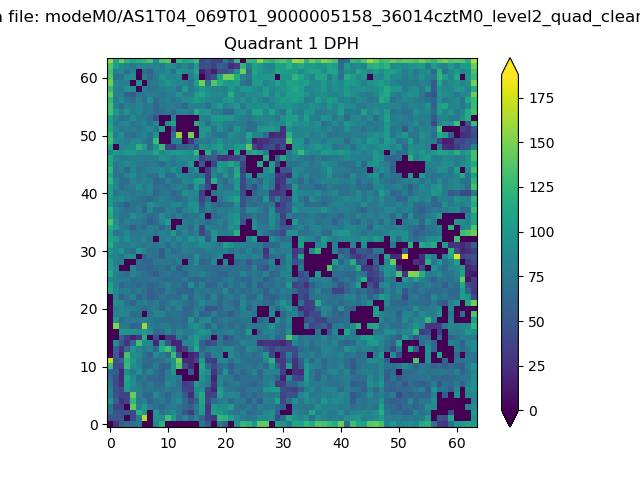 |
Quadrant B |
|---|---|---|---|
| Quadrant D | 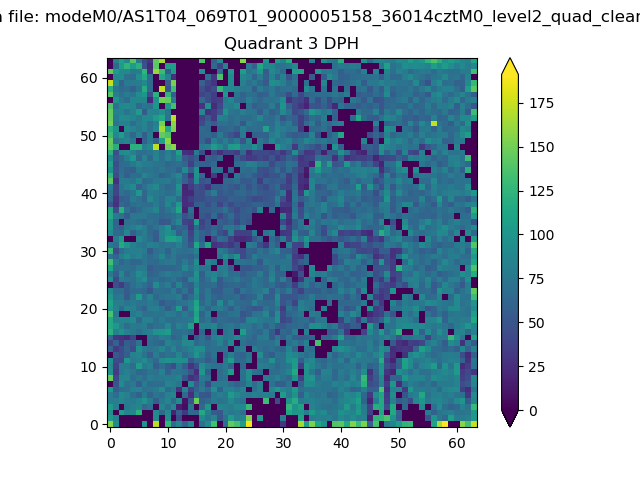 |
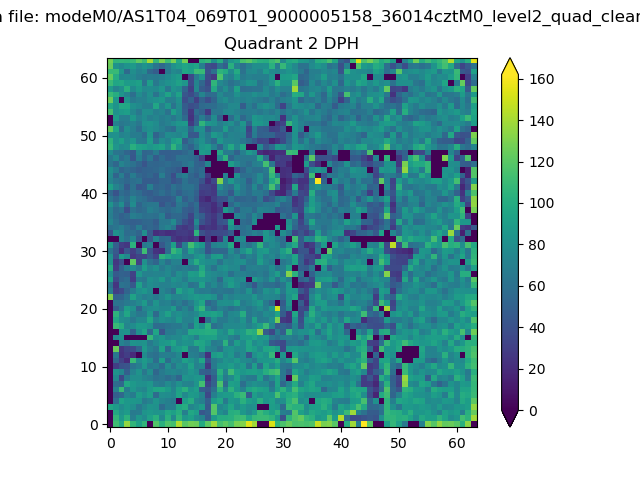 |
Quadrant C |
| Plot type | Count rate plots | Images |
|---|---|---|
| Comparison with Poisson distribution Blue bars denote a histogram of data divided into 1 sec bins. Red curve is a Poisson curve with rate = median count rate of data. |
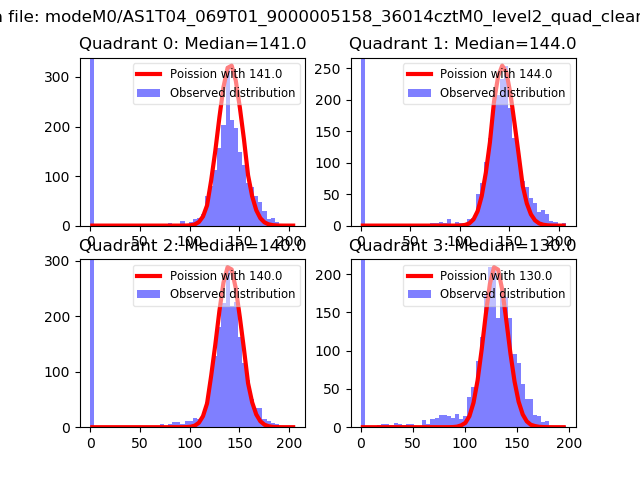 |
 |
| Quadrant-wise count rates Data is divided into 100 sec bins |
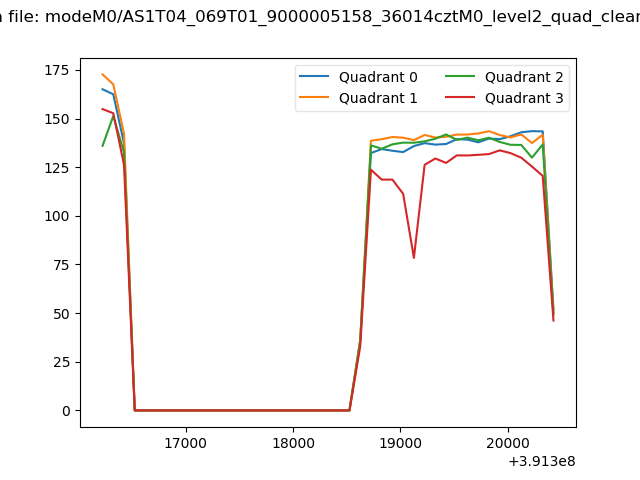 |
|
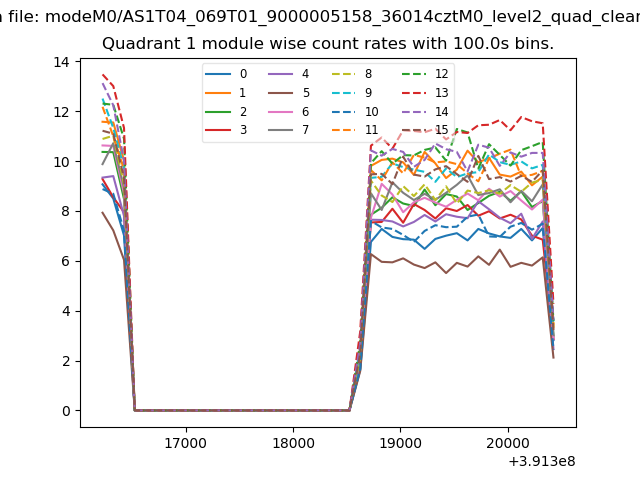
| Module-wise count rates for Quadrant A Data is divided into 100 sec bins |
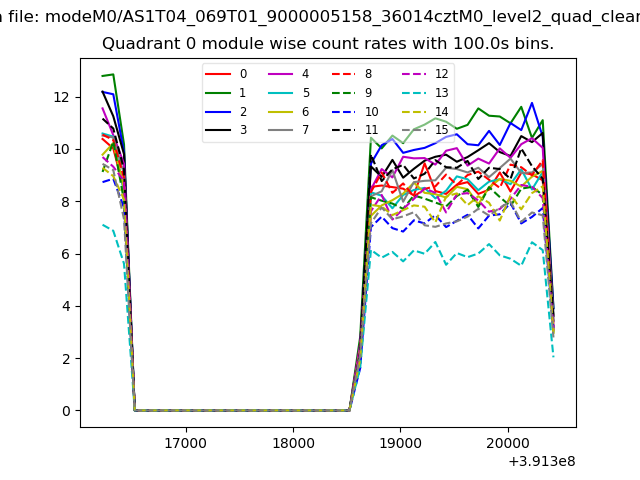 |
 |
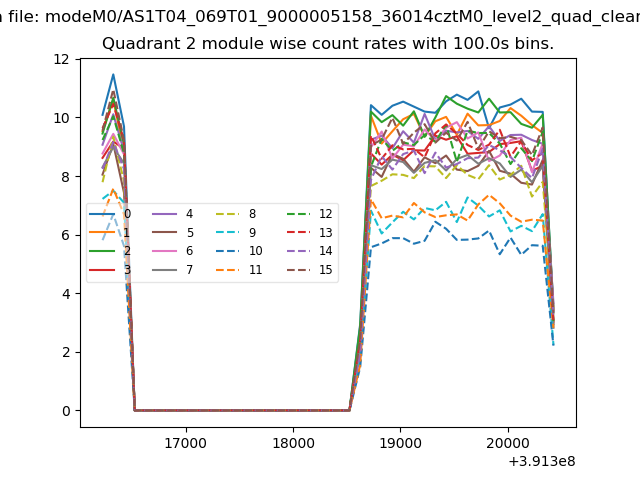
| Module-wise count rates for Quadrant B Data is divided into 100 sec bins |
 |
 |
| Module-wise count rates for Quadrant C Data is divided into 100 sec bins |
 |
 |
| Module-wise count rates for Quadrant D Data is divided into 100 sec bins |
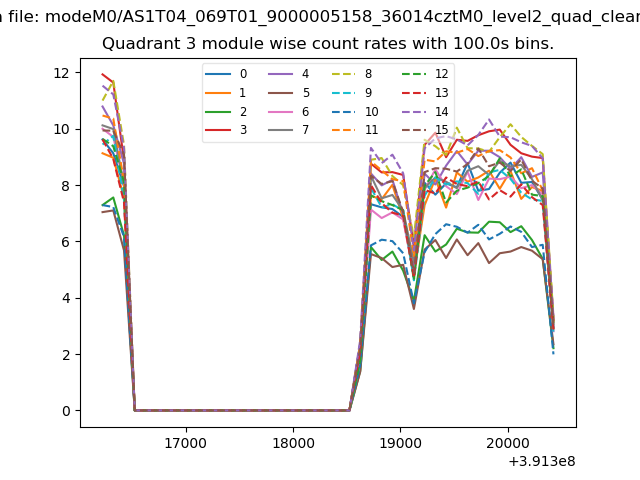 |
 |
| Parameter | Plot |
|---|---|
| CZT HV Monitor | 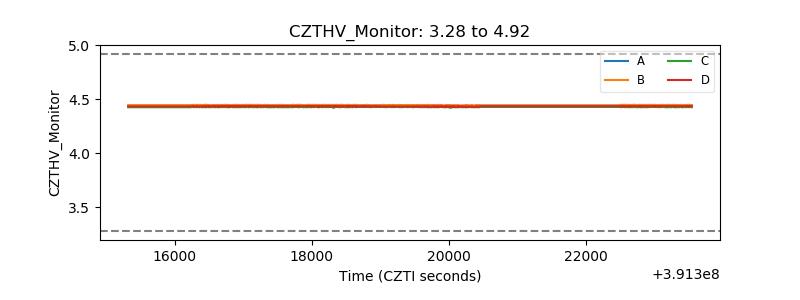 |
| D_VDD | 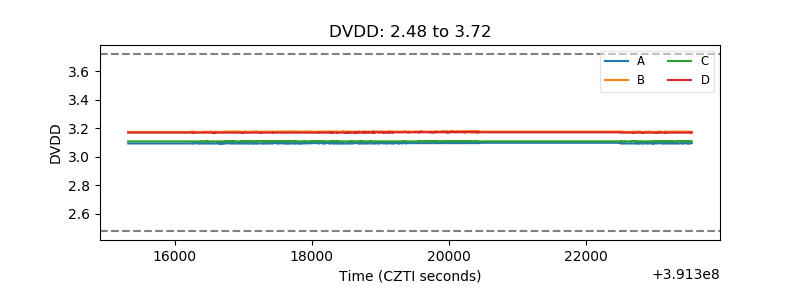 |
| Temperature 1 | 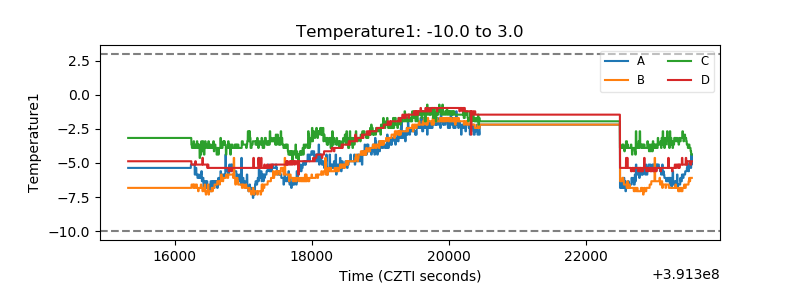 |
| Veto HV Monitor | 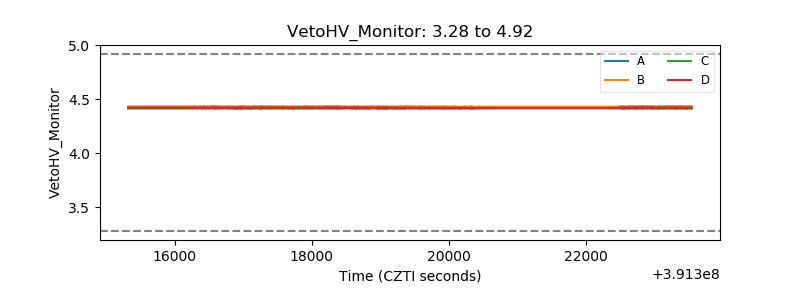 |
| Veto LLD | 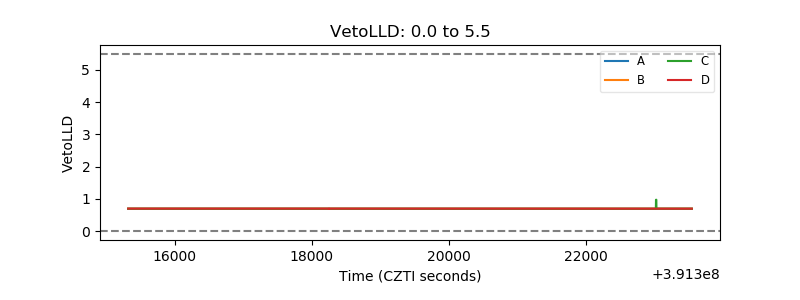 |
| Alpha Counter | 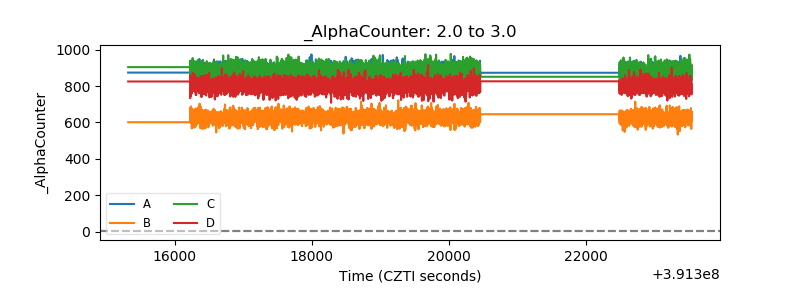 |
| _CPM_Rate | 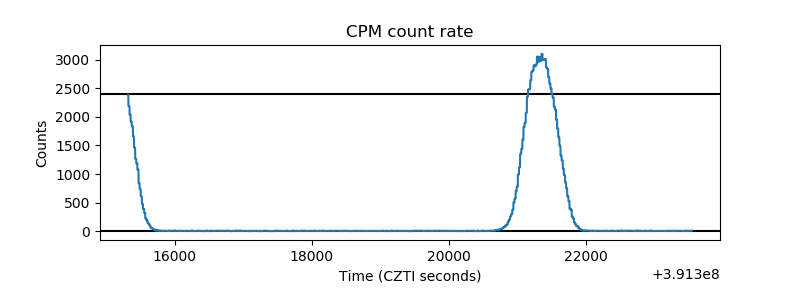 |
| CZT Counter | 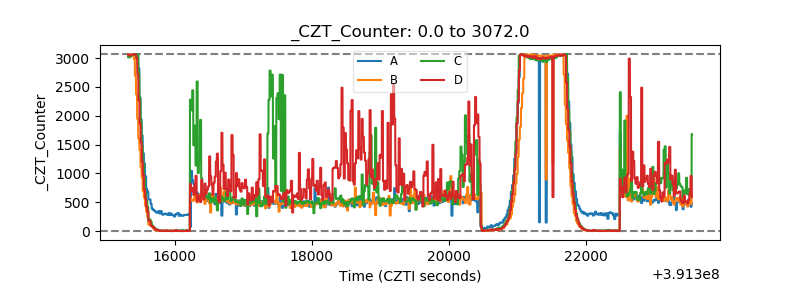 |
| +2.5 Volts monitor | 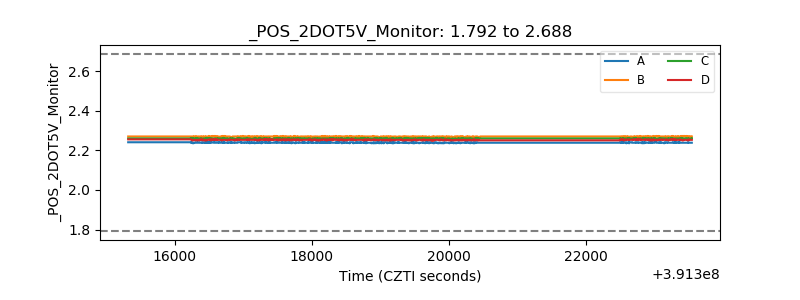 |
| +5 Volts monitor | 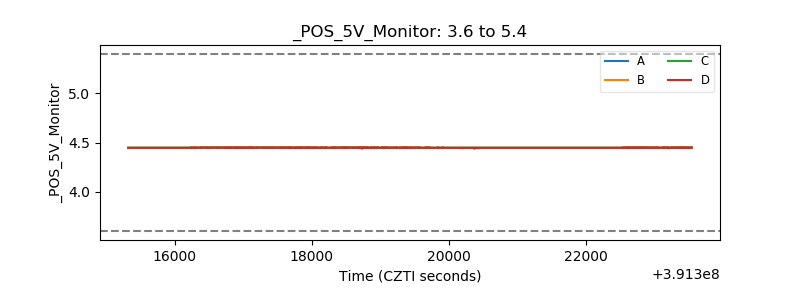 |
| _ROLL_ROT | 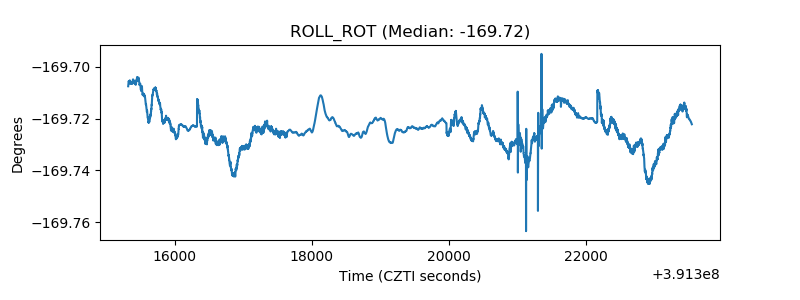 |
| _Roll_DEC | 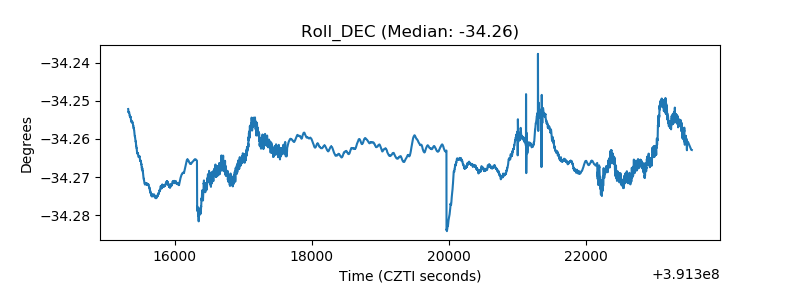 |
| _Roll_RA | 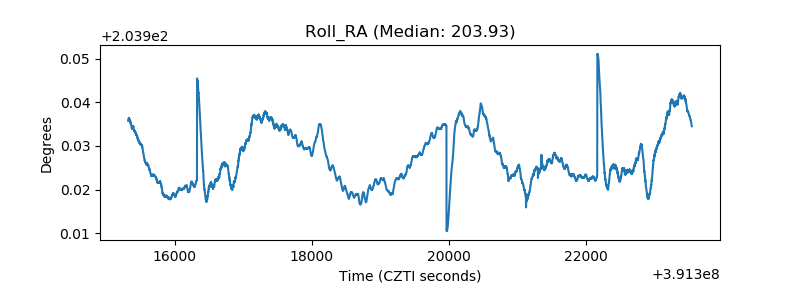 |
| Veto Counter | 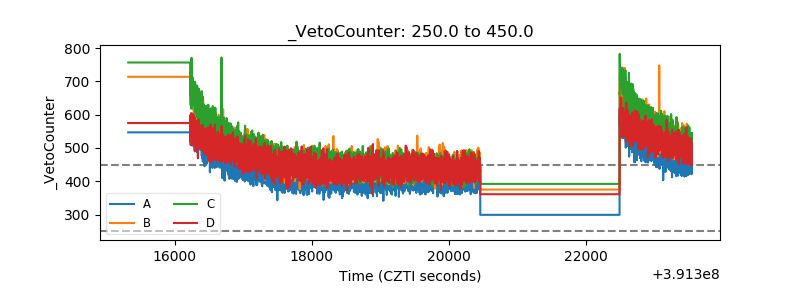 |