| Param | Original file | Final file |
|---|---|---|
| Filename | modeM0/AS1T04_069T01_9000005158_36012cztM0_level2.evt | modeM0/AS1T04_069T01_9000005158_36012cztM0_level2_quad_clean.evt |
| Size (bytes) | 460,105,920 | 63,483,840 |
| Size | 438.8 MB | 60.5 MB |
| Events in quadrant A | 2,603,412 | 402,643 |
| Events in quadrant B | 2,885,377 | 403,781 |
| Events in quadrant C | 2,946,906 | 388,470 |
| Events in quadrant D | 5,141,066 | 357,751 |
| Mode M0 | |||
|---|---|---|---|
| Quadrant | BADHDUFLAG | Total packets | Discarded packets |
| A | 0 | 11007 | 3 |
| B | 0 | 11976 | 2 |
| C | 0 | 11835 | 2 |
| D | 0 | 18993 | 2 |
| Mode M9 | |||
|---|---|---|---|
| Quadrant | BADHDUFLAG | Total packets | Discarded packets |
| A | 0 | 28 | 0 |
| B | 0 | 28 | 0 |
| C | 0 | 28 | 0 |
| D | 0 | 29 | 0 |
| Mode SS | |||
|---|---|---|---|
| Quadrant | BADHDUFLAG | Total packets | Discarded packets |
| A | 0 | 108 | 0 |
| B | 0 | 108 | 0 |
| C | 0 | 108 | 0 |
| D | 0 | 108 | 0 |
| Quadrant | Total seconds | Saturated seconds | Saturation percentage |
|---|---|---|---|
| A | 5272 | 19 | 0.360395% |
| B | 5272 | 84 | 1.593323% |
| C | 5272 | 114 | 2.162367% |
| D | 5272 | 300 | 5.690440% |
Noise dominated data is calculated using 1-second bins in cleaned event files. If a bin has >2000 counts, and if more than 50% of those come from <1% of pixels, then it is considered to be noise-dominated and hence unusable.
| Quadrant | # 1 sec bins | Bins with >0 counts | Bins with >2000 counts | High rate bins dominated by noise | Noise dominated (total time) | Noise dominated (detector-on time) | Marked lightcurve |
|---|---|---|---|---|---|---|---|
| A | 7064 | 5273 | 5 | 5 | 0.07% | 0.09% | 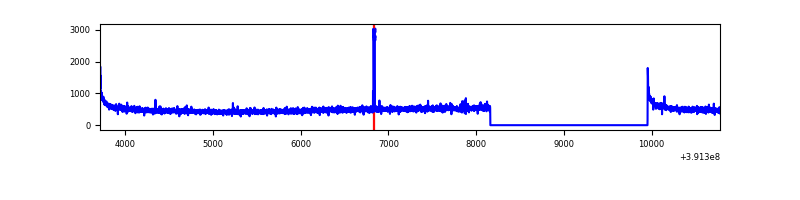 |
| B | 7064 | 5273 | 49 | 49 | 0.69% | 0.93% | 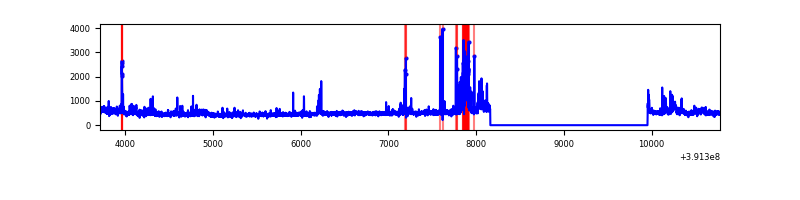 |
| C | 7064 | 5273 | 99 | 99 | 1.40% | 1.88% | 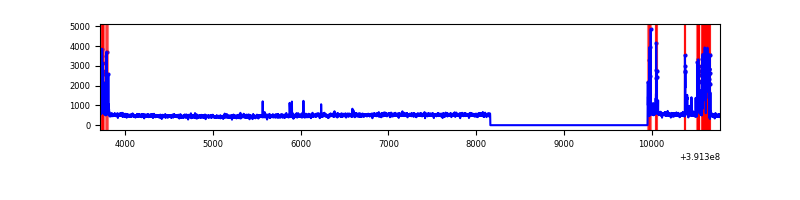 |
| D | 7064 | 5273 | 299 | 299 | 4.23% | 5.67% | 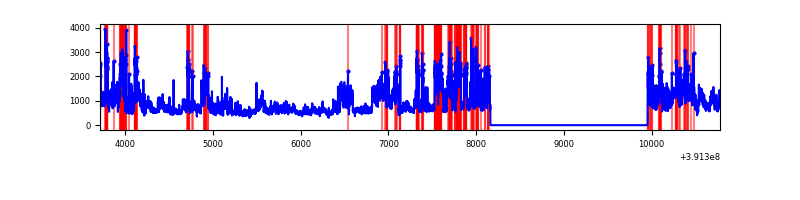 |
Top three noisy pixels from each quadrant. If the there are fewer than three noisy pixels in the level2.evt file, extra rows are filled as -1
| Pixel properties | Quadrant properties | ||||||
|---|---|---|---|---|---|---|---|
| Quadrant | DetID | PixID | Counts | Sigma | Mean | Median | Sigma |
| A | 10 | 83 | 163357 | 1291.15 | 620 | 607 | 126.1 |
| A | 7 | 191 | 27180 | 210.81 | 620 | 607 | 126.1 |
| A | 13 | 6 | 10176 | 75.91 | 620 | 607 | 126.1 |
| B | 5 | 172 | 151829 | 1284.59 | 617 | 600 | 117.7 |
| B | 0 | 190 | 73543 | 619.6 | 617 | 600 | 117.7 |
| B | 4 | 171 | 66161 | 556.9 | 617 | 600 | 117.7 |
| C | 9 | 187 | 258156 | 1833.2 | 601 | 606 | 140.5 |
| C | 15 | 214 | 221362 | 1571.31 | 601 | 606 | 140.5 |
| C | 0 | 10 | 126309 | 894.74 | 601 | 606 | 140.5 |
| D | 12 | 227 | 2292452 | 15759.36 | 588 | 571 | 145.4 |
| D | 12 | 235 | 284756 | 1954.1 | 588 | 571 | 145.4 |
| D | 12 | 6 | 106747 | 730.08 | 588 | 571 | 145.4 |
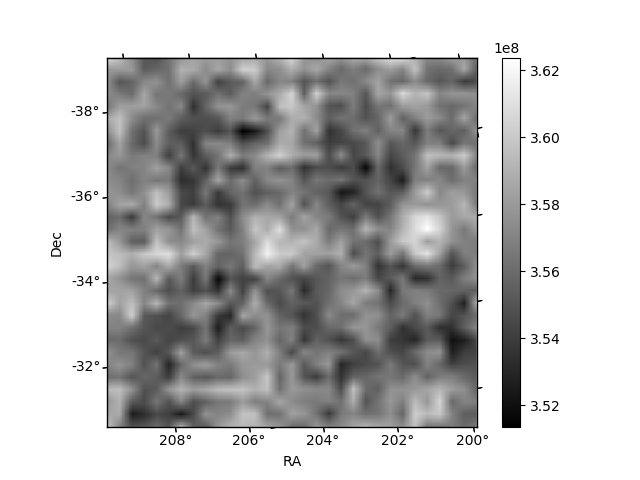
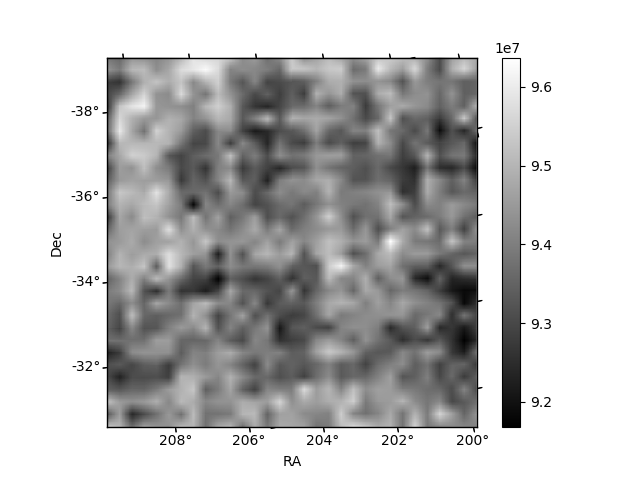
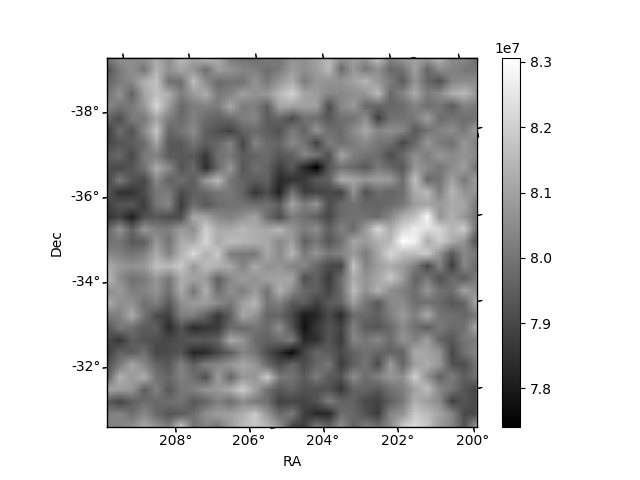
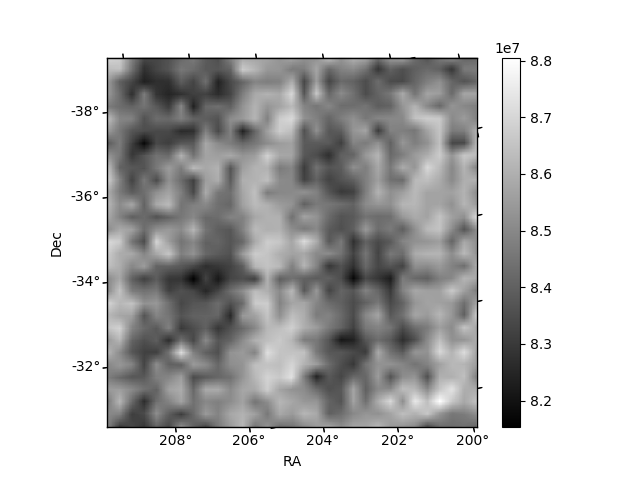
Histogram calculated using DETX and DETY for each event in the final _common_clean file
| Quadrant A | 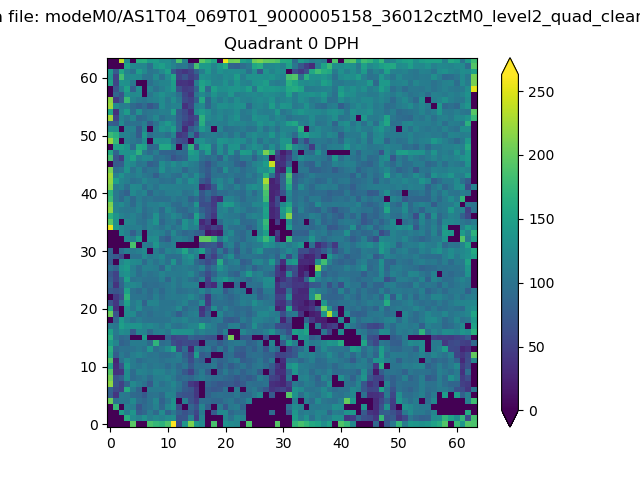 |
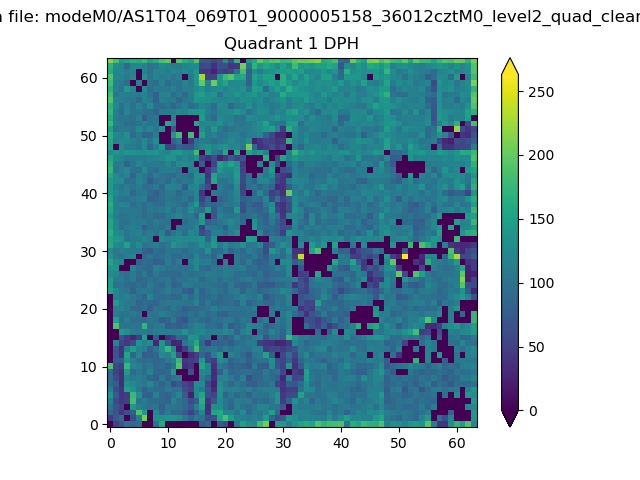 |
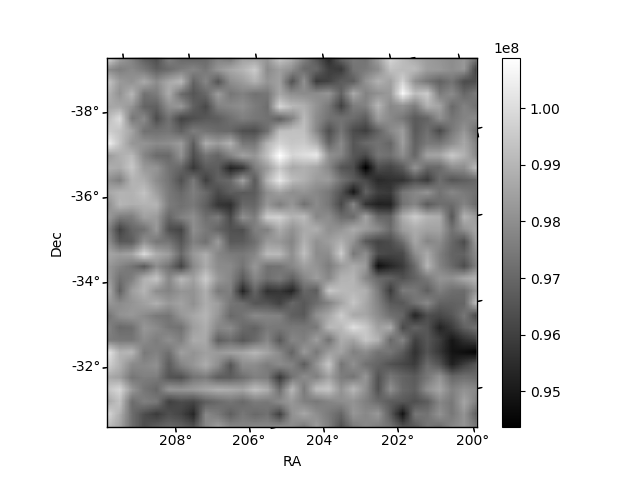
Quadrant B |
|---|---|---|---|
| Quadrant D | 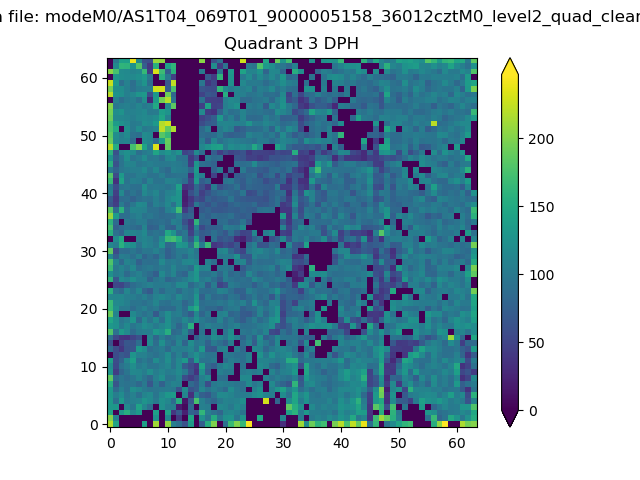 |
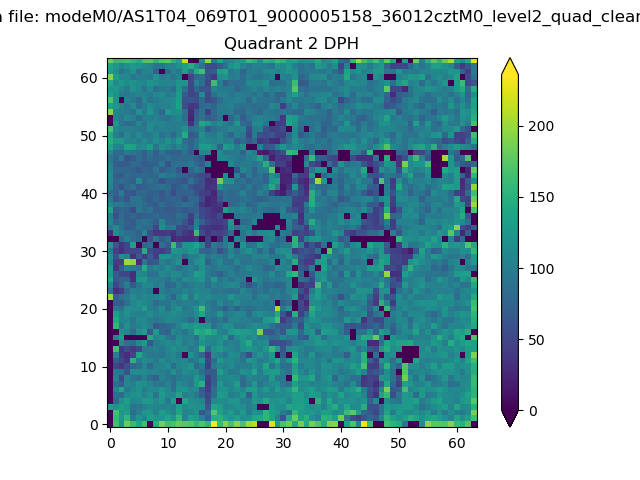 |
Quadrant C |
| Plot type | Count rate plots | Images |
|---|---|---|
| Comparison with Poisson distribution Blue bars denote a histogram of data divided into 1 sec bins. Red curve is a Poisson curve with rate = median count rate of data. |
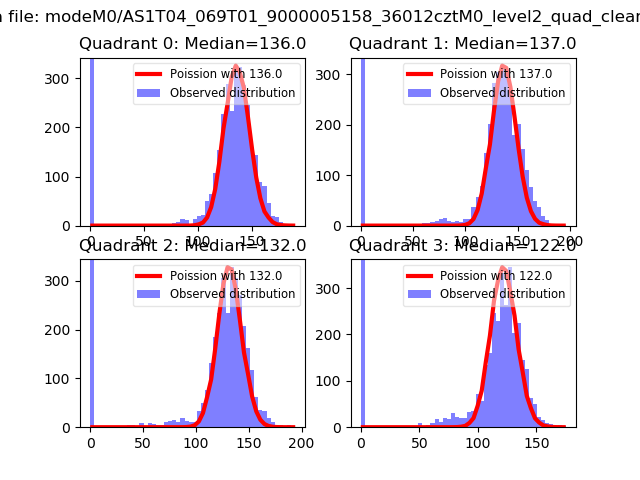 |
 |
| Quadrant-wise count rates Data is divided into 100 sec bins |
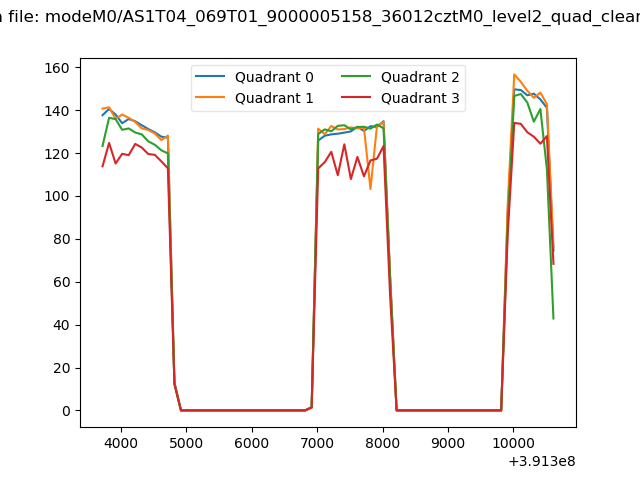 |
|
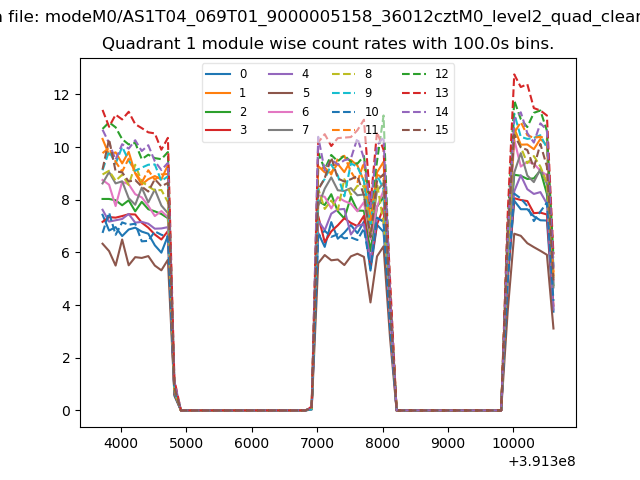
| Module-wise count rates for Quadrant A Data is divided into 100 sec bins |
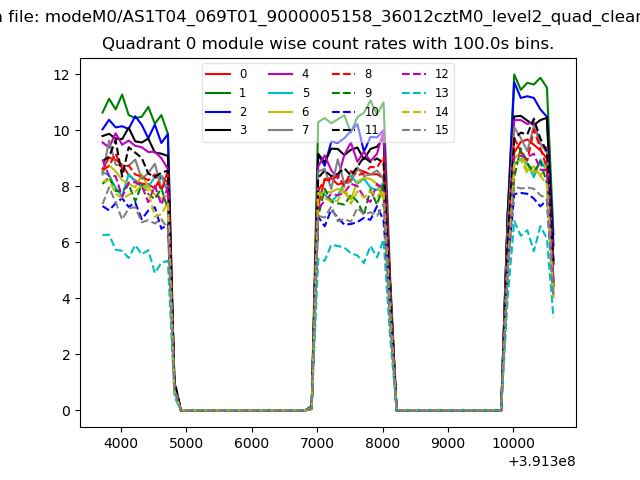 |
 |
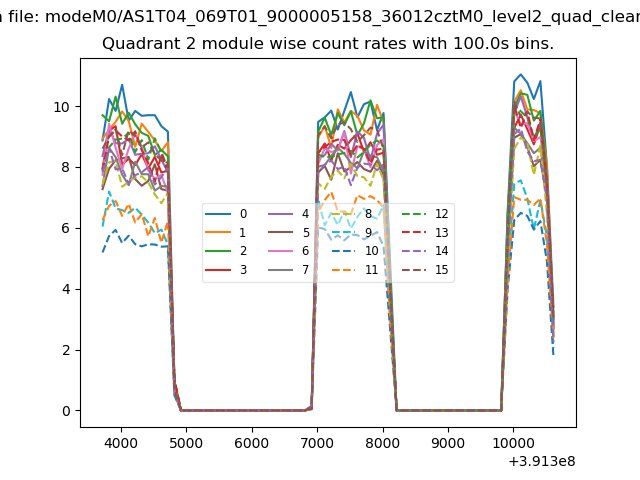
| Module-wise count rates for Quadrant B Data is divided into 100 sec bins |
 |
 |
| Module-wise count rates for Quadrant C Data is divided into 100 sec bins |
 |
 |
| Module-wise count rates for Quadrant D Data is divided into 100 sec bins |
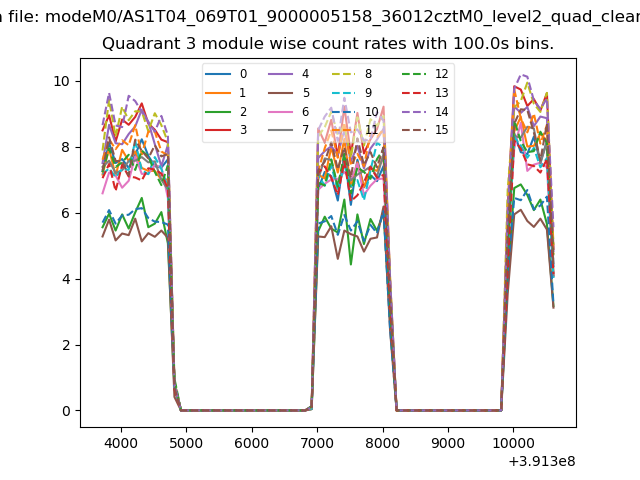 |
 |
| Parameter | Plot |
|---|---|
| CZT HV Monitor | 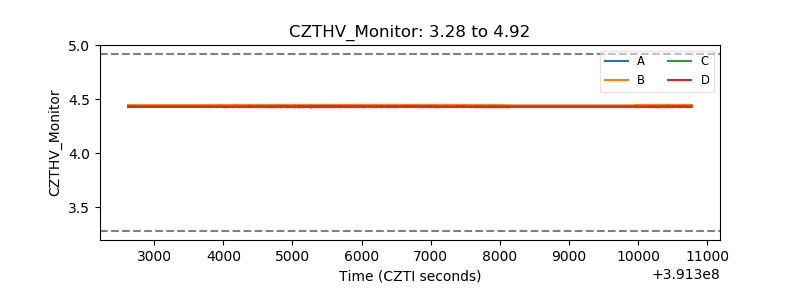 |
| D_VDD | 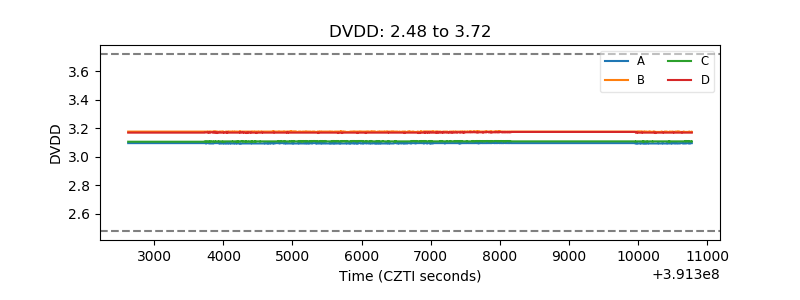 |
| Temperature 1 | 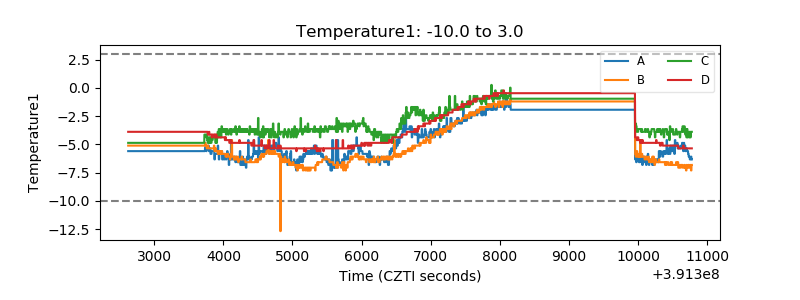 |
| Veto HV Monitor | 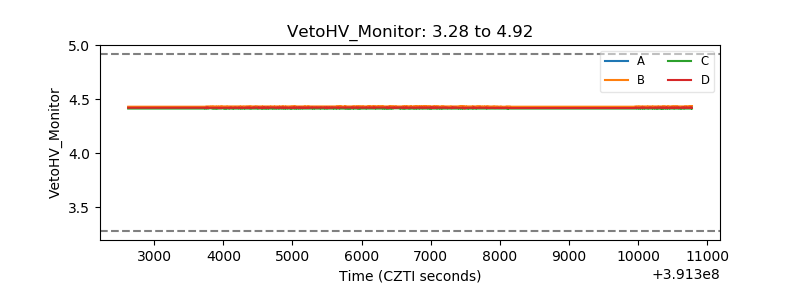 |
| Veto LLD | 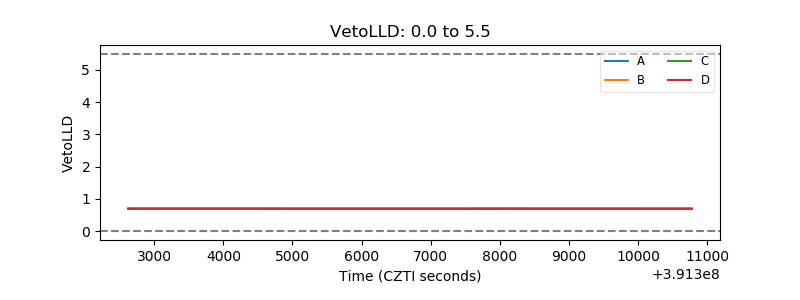 |
| Alpha Counter | 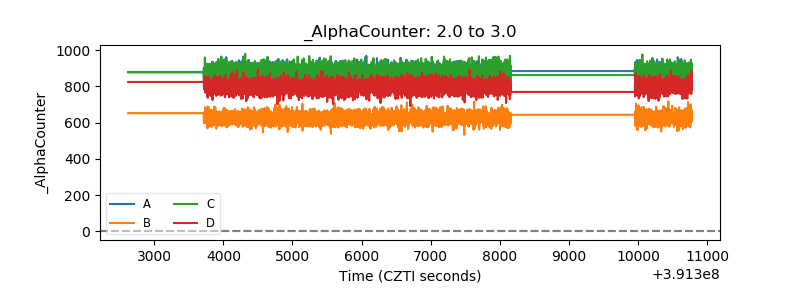 |
| _CPM_Rate | 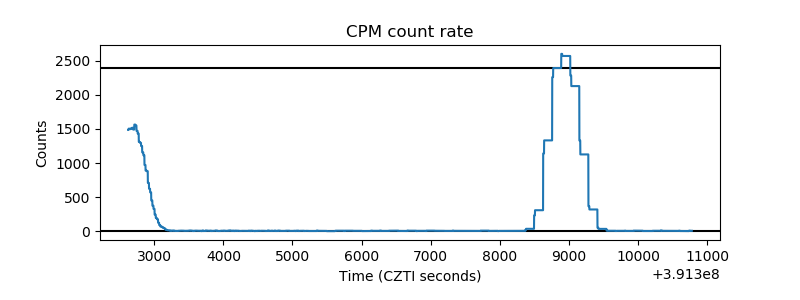 |
| CZT Counter | 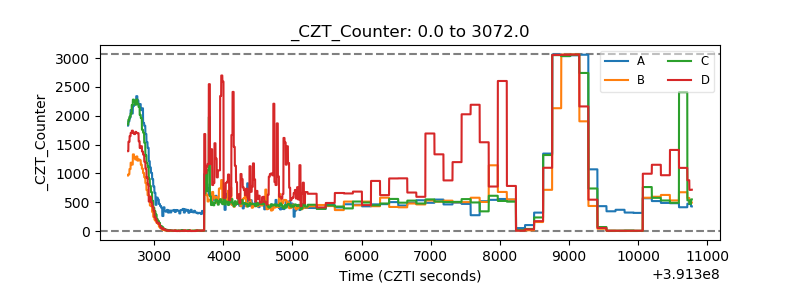 |
| +2.5 Volts monitor | 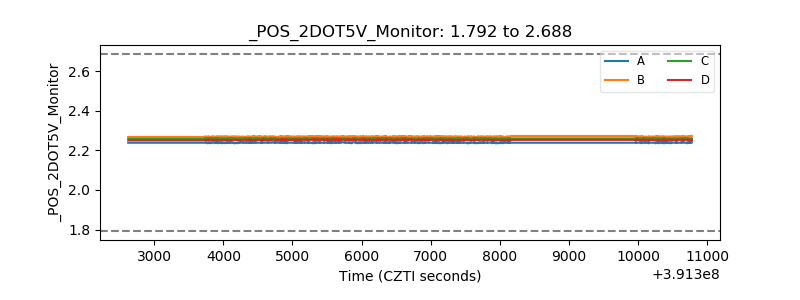 |
| +5 Volts monitor | 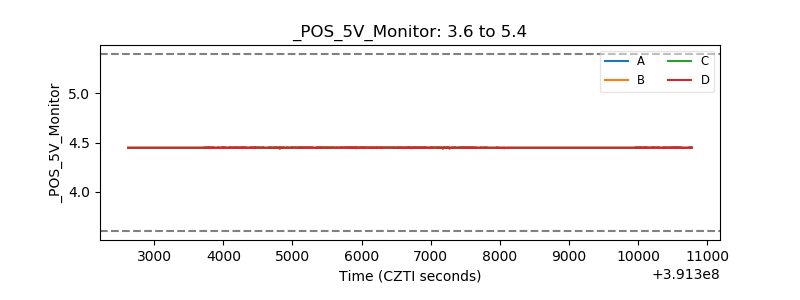 |
| _ROLL_ROT | 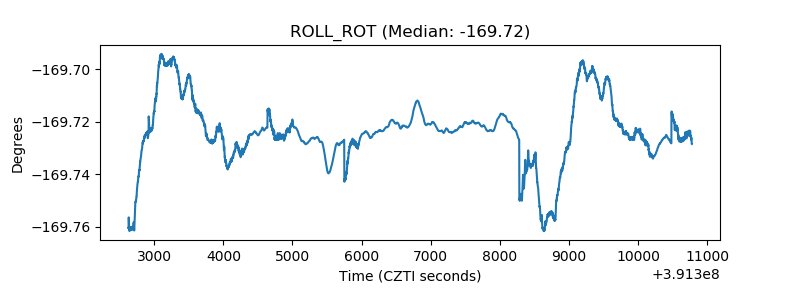 |
| _Roll_DEC | 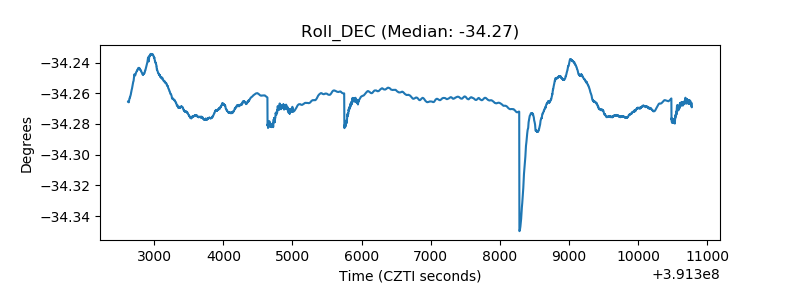 |
| _Roll_RA | 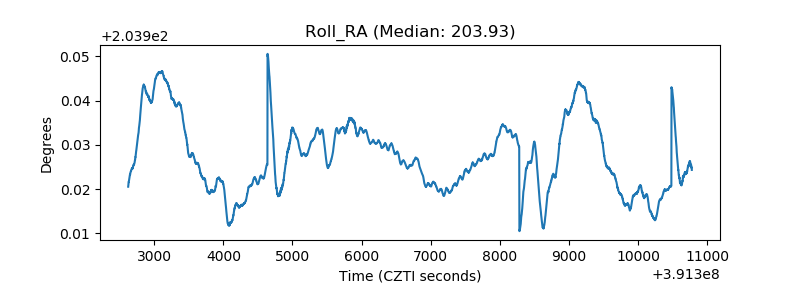 |
| Veto Counter | 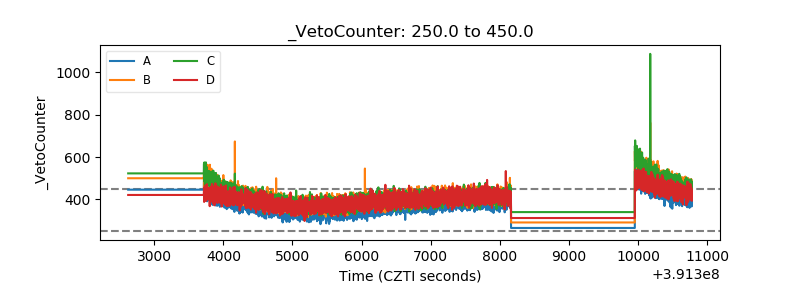 |