| Param | Original file | Final file |
|---|---|---|
| Filename | modeM0/AS1T04_069T01_9000005158_36008cztM0_level2.evt | modeM0/AS1T04_069T01_9000005158_36008cztM0_level2_quad_clean.evt |
| Size (bytes) | 508,815,360 | 85,518,720 |
| Size | 485.2 MB | 81.6 MB |
| Events in quadrant A | 3,131,235 | 555,428 |
| Events in quadrant B | 4,595,832 | 521,577 |
| Events in quadrant C | 3,249,856 | 533,589 |
| Events in quadrant D | 3,985,209 | 519,166 |
| Mode M0 | |||
|---|---|---|---|
| Quadrant | BADHDUFLAG | Total packets | Discarded packets |
| A | 0 | 13619 | 3 |
| B | 0 | 17948 | 2 |
| C | 0 | 13873 | 2 |
| D | 0 | 16291 | 2 |
| Mode M9 | |||
|---|---|---|---|
| Quadrant | BADHDUFLAG | Total packets | Discarded packets |
| A | 0 | 15 | 0 |
| B | 0 | 15 | 0 |
| C | 0 | 15 | 0 |
| D | 0 | 16 | 0 |
| Mode SS | |||
|---|---|---|---|
| Quadrant | BADHDUFLAG | Total packets | Discarded packets |
| A | 0 | 134 | 0 |
| B | 0 | 134 | 0 |
| C | 0 | 134 | 0 |
| D | 0 | 134 | 0 |
| Quadrant | Total seconds | Saturated seconds | Saturation percentage |
|---|---|---|---|
| A | 6592 | 14 | 0.212379% |
| B | 6592 | 432 | 6.553398% |
| C | 6592 | 34 | 0.515777% |
| D | 6592 | 121 | 1.835558% |
Noise dominated data is calculated using 1-second bins in cleaned event files. If a bin has >2000 counts, and if more than 50% of those come from <1% of pixels, then it is considered to be noise-dominated and hence unusable.
| Quadrant | # 1 sec bins | Bins with >0 counts | Bins with >2000 counts | High rate bins dominated by noise | Noise dominated (total time) | Noise dominated (detector-on time) | Marked lightcurve |
|---|---|---|---|---|---|---|---|
| A | 7934 | 6593 | 0 | 0 | 0.00% | 0.00% | 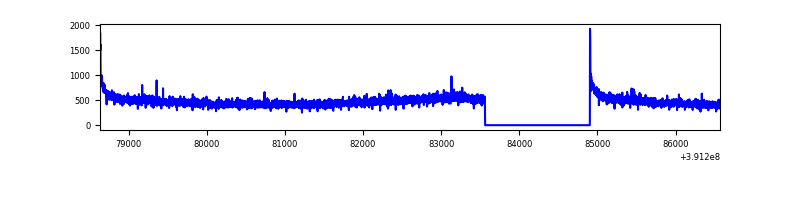 |
| B | 7934 | 6593 | 320 | 320 | 4.03% | 4.85% | 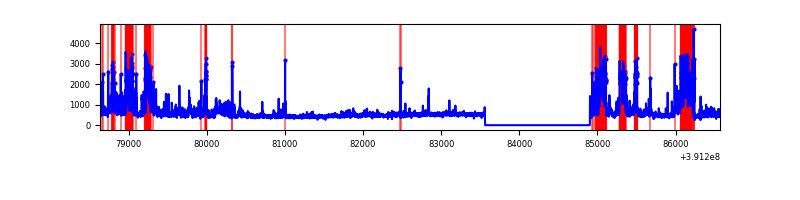 |
| C | 7934 | 6593 | 25 | 25 | 0.32% | 0.38% | 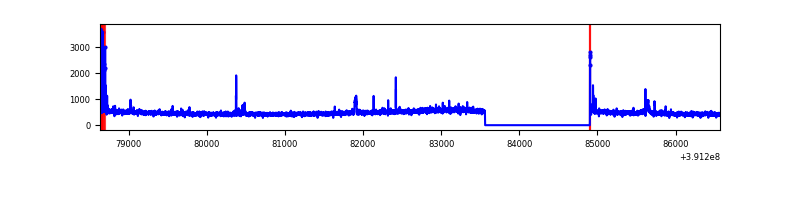 |
| D | 7934 | 6593 | 97 | 97 | 1.22% | 1.47% | 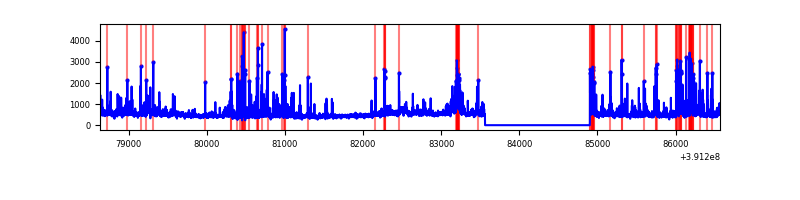 |
Top three noisy pixels from each quadrant. If the there are fewer than three noisy pixels in the level2.evt file, extra rows are filled as -1
| Pixel properties | Quadrant properties | ||||||
|---|---|---|---|---|---|---|---|
| Quadrant | DetID | PixID | Counts | Sigma | Mean | Median | Sigma |
| A | 10 | 83 | 195210 | 1273.47 | 755 | 740 | 152.7 |
| A | 13 | 254 | 11061 | 67.59 | 755 | 740 | 152.7 |
| A | 8 | 144 | 9876 | 59.83 | 755 | 740 | 152.7 |
| B | 5 | 172 | 1209628 | 8548.4 | 729 | 708 | 141.4 |
| B | 0 | 213 | 151301 | 1064.86 | 729 | 708 | 141.4 |
| B | 0 | 190 | 134807 | 948.23 | 729 | 708 | 141.4 |
| C | 15 | 214 | 272234 | 1603.94 | 723 | 728 | 169.3 |
| C | 0 | 10 | 85595 | 501.36 | 723 | 728 | 169.3 |
| C | 10 | 49 | 35489 | 205.35 | 723 | 728 | 169.3 |
| D | 12 | 235 | 425953 | 2370.85 | 726 | 707 | 179.4 |
| D | 12 | 6 | 139607 | 774.4 | 726 | 707 | 179.4 |
| D | 13 | 249 | 125326 | 694.78 | 726 | 707 | 179.4 |
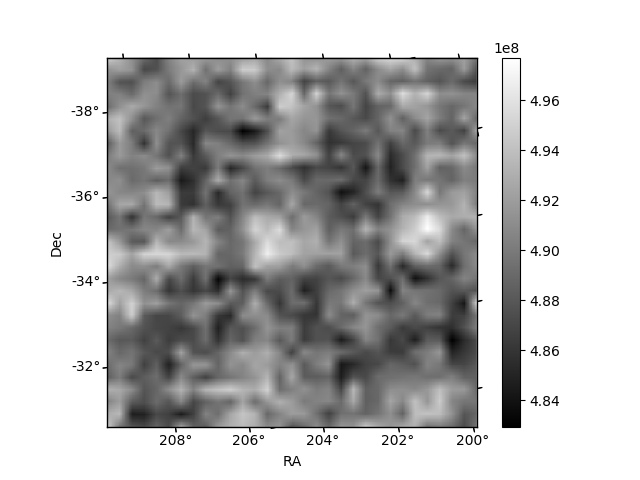
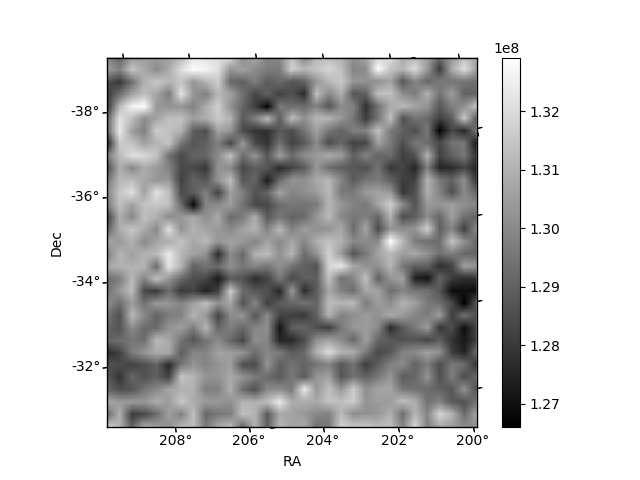
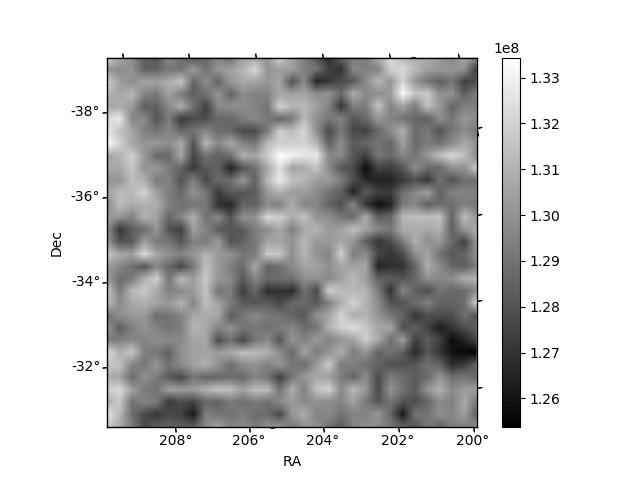
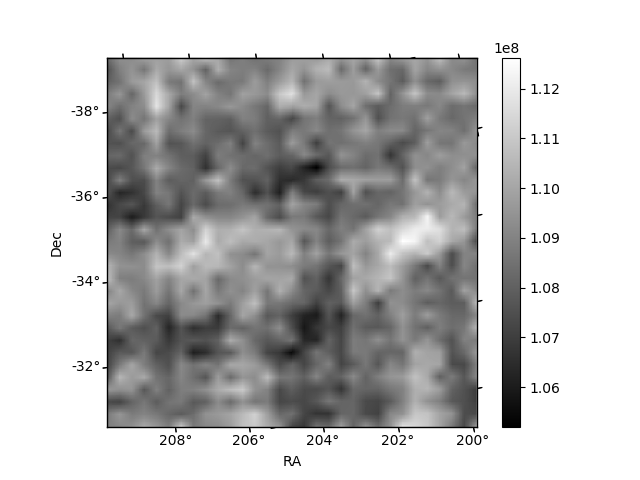
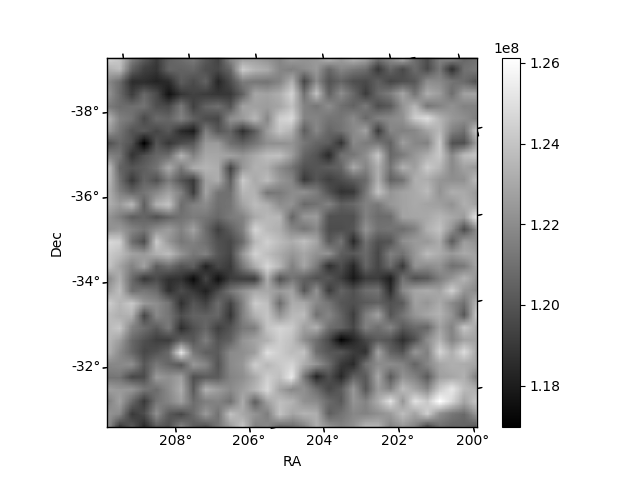
Histogram calculated using DETX and DETY for each event in the final _common_clean file
| Quadrant A | 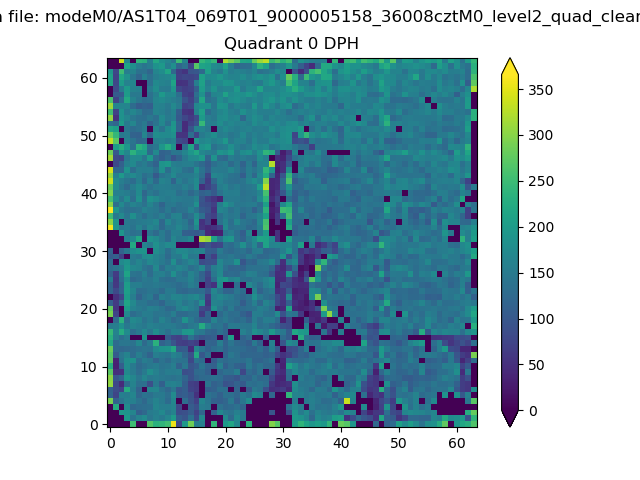 |
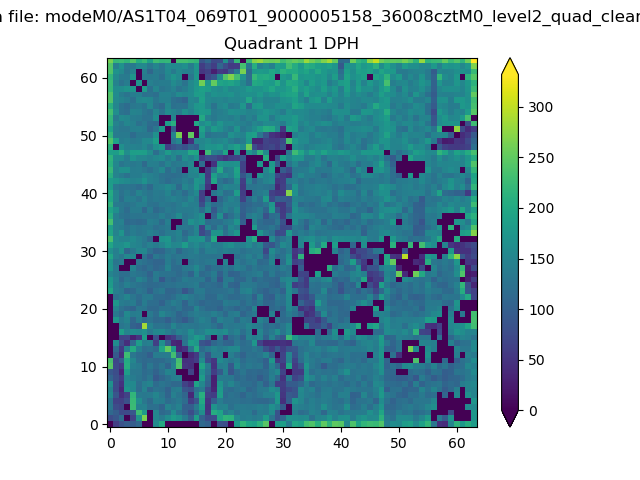 |
Quadrant B |
|---|---|---|---|
| Quadrant D | 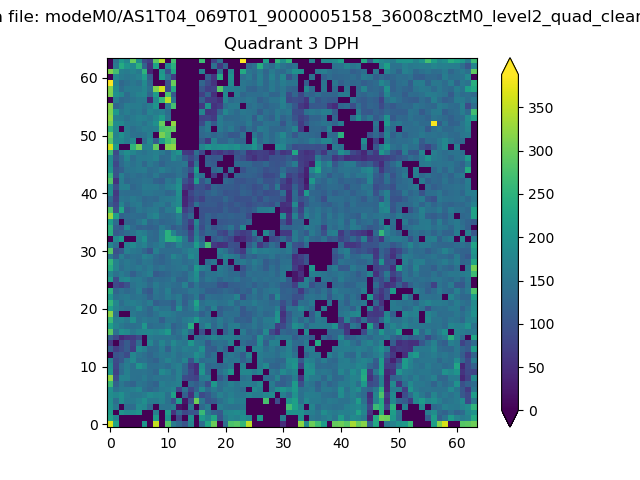 |
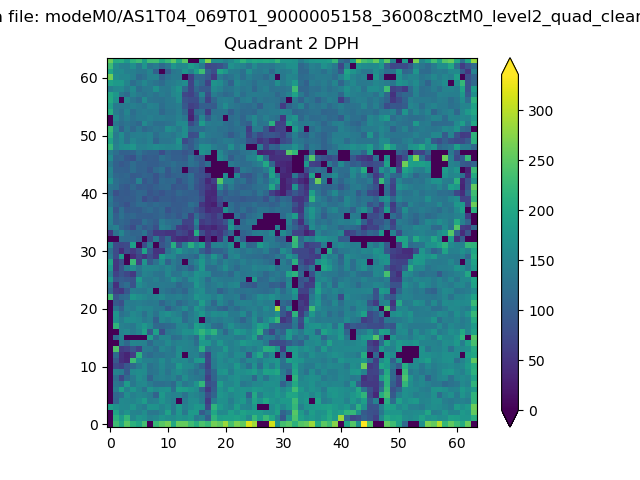 |
Quadrant C |
| Plot type | Count rate plots | Images |
|---|---|---|
| Comparison with Poisson distribution Blue bars denote a histogram of data divided into 1 sec bins. Red curve is a Poisson curve with rate = median count rate of data. |
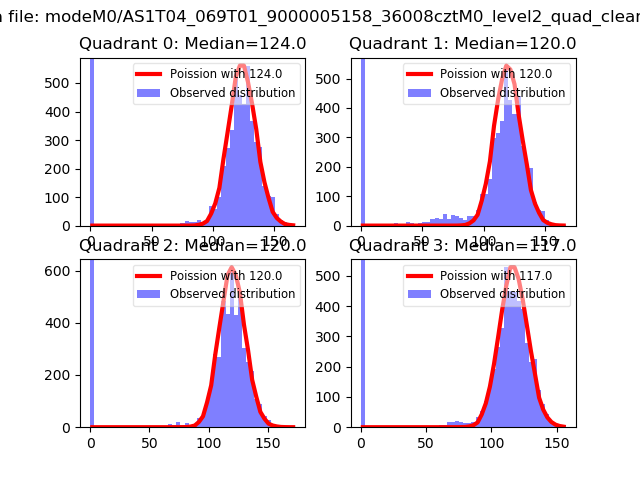 |
 |
| Quadrant-wise count rates Data is divided into 100 sec bins |
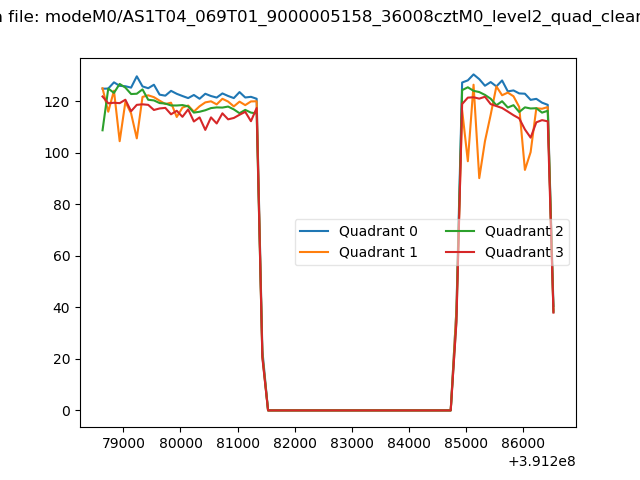 |
|
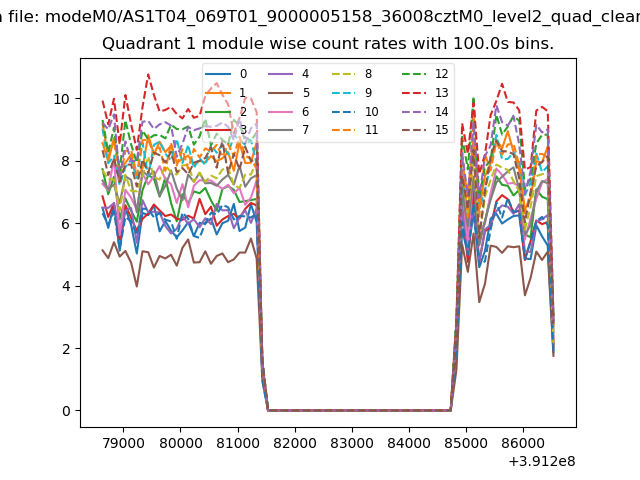
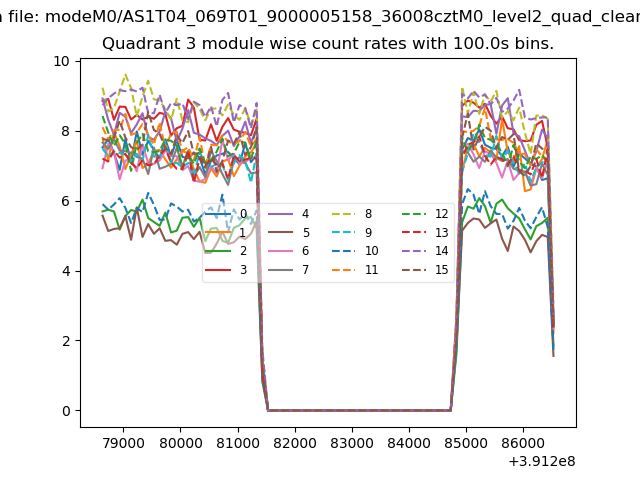
| Module-wise count rates for Quadrant A Data is divided into 100 sec bins |
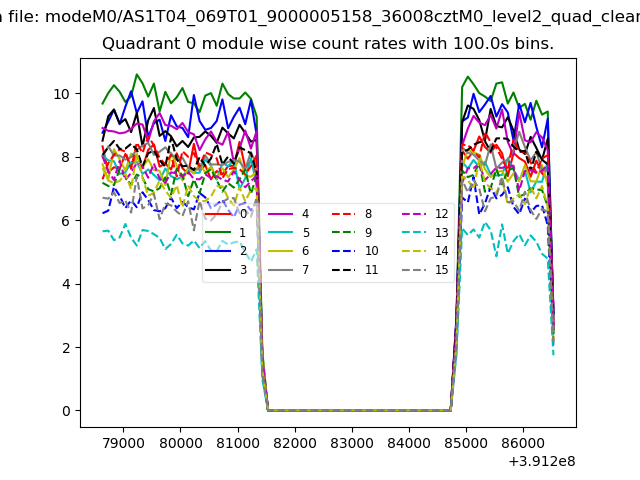 |
 |
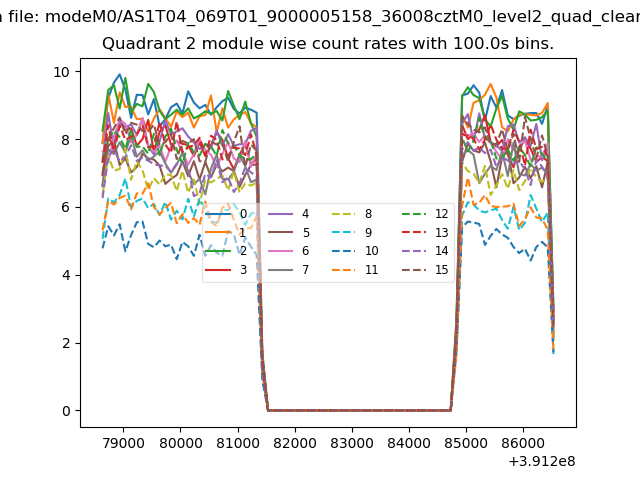
| Module-wise count rates for Quadrant B Data is divided into 100 sec bins |
 |
 |
| Module-wise count rates for Quadrant C Data is divided into 100 sec bins |
 |
 |
| Module-wise count rates for Quadrant D Data is divided into 100 sec bins |
 |
 |
| Parameter | Plot |
|---|---|
| CZT HV Monitor | 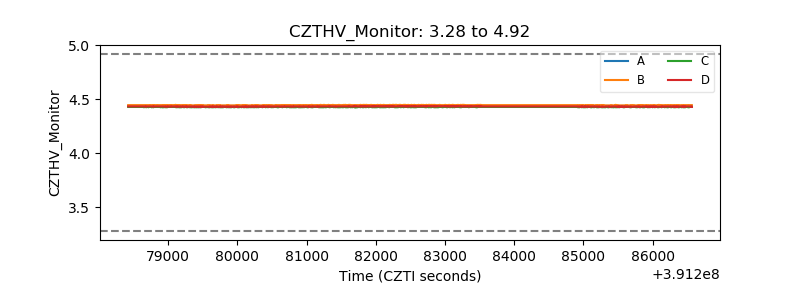 |
| D_VDD | 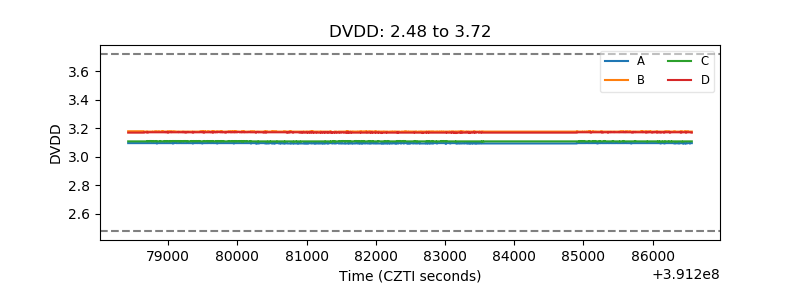 |
| Temperature 1 | 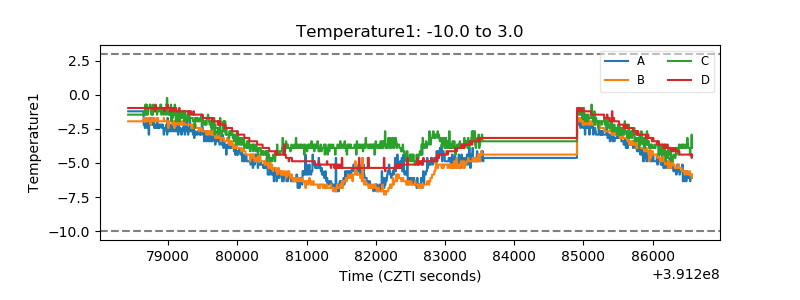 |
| Veto HV Monitor | 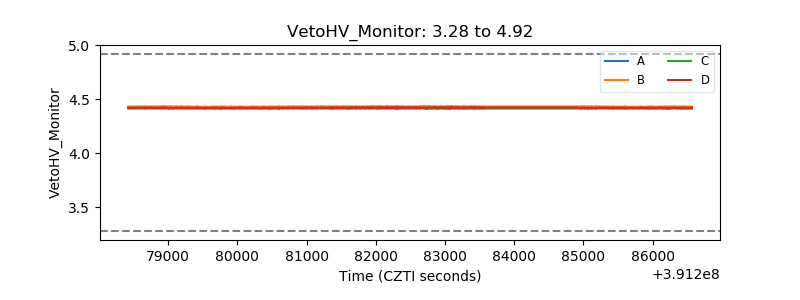 |
| Veto LLD | 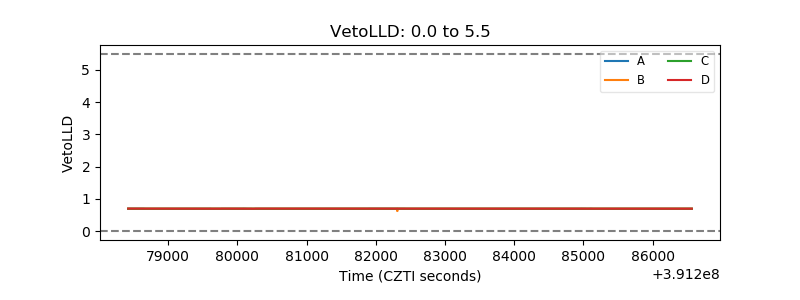 |
| Alpha Counter |  |
| _CPM_Rate |  |
| CZT Counter | 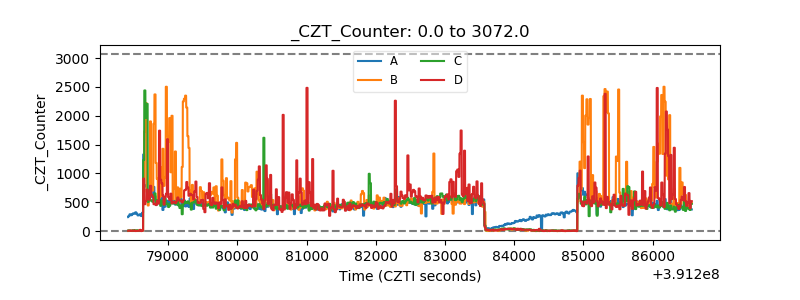 |
| +2.5 Volts monitor | 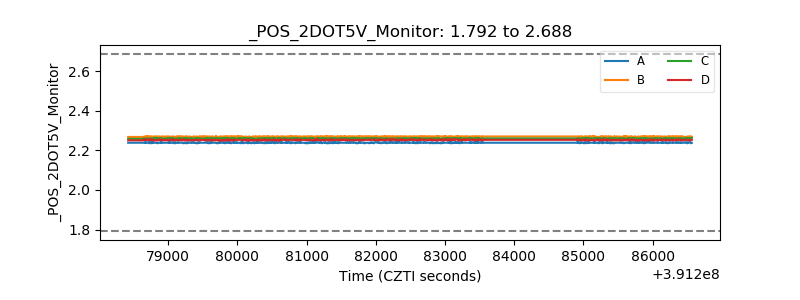 |
| +5 Volts monitor | 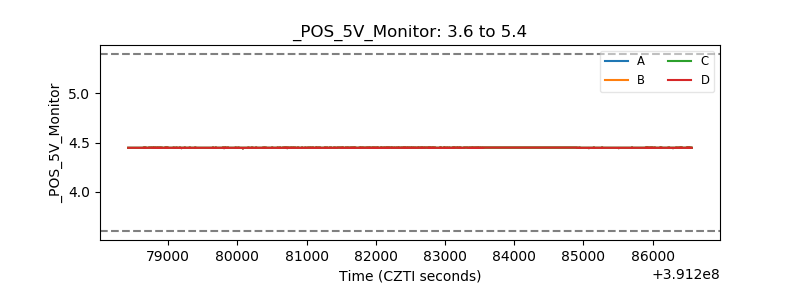 |
| _ROLL_ROT | 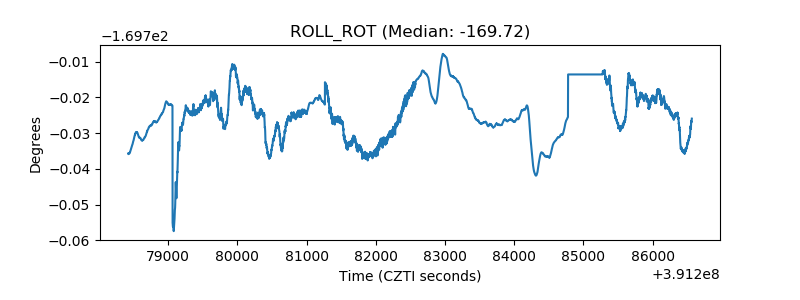 |
| _Roll_DEC | 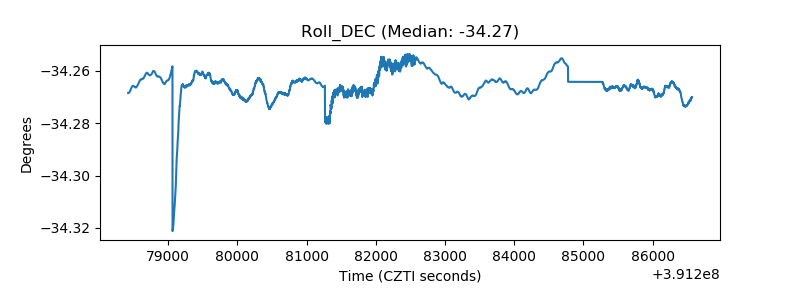 |
| _Roll_RA | 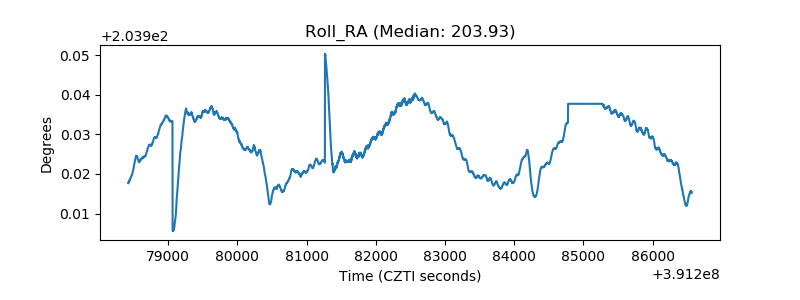 |
| Veto Counter |  |