| Param | Original file | Final file |
|---|---|---|
| Filename | modeM0/AS1T05_009T07_9000005152cztM0_level2_bc.evt | modeM0/AS1T05_009T07_9000005152cztM0_level2_quad_clean.evt |
| Size (bytes) | 230,607,360 | 68,757,120 |
| Size | 219.9 MB | 65.6 MB |
| Events in quadrant A | 1,029,088 | 555,484 |
| Events in quadrant B | 2,147,029 | 202,824 |
| Events in quadrant C | 1,454,092 | 532,601 |
| Events in quadrant D | 2,060,895 | 497,227 |
| Mode M9 | |||
|---|---|---|---|
| Quadrant | BADHDUFLAG | Total packets | Discarded packets |
| A | 0 | 19 | 0 |
| B | 0 | 19 | 0 |
| C | 0 | 19 | 0 |
| D | 0 | 19 | 0 |
| Mode SS | |||
|---|---|---|---|
| Quadrant | BADHDUFLAG | Total packets | Discarded packets |
| A | 0 | 84 | 0 |
| B | 0 | 84 | 0 |
| C | 0 | 84 | 0 |
| D | 0 | 84 | 0 |
| Mode M0 | |||
|---|---|---|---|
| Quadrant | BADHDUFLAG | Total packets | Discarded packets |
| A | 0 | 8539 | 0 |
| B | 0 | 34842 | 0 |
| C | 0 | 10275 | 0 |
| D | 0 | 13072 | 0 |
| Quadrant | Total seconds | Saturated seconds | Saturation percentage |
|---|---|---|---|
| A | 4141 | 7 | 0.169041% |
| B | 4141 | 4138 | 99.927554% |
| C | 4141 | 115 | 2.777107% |
| D | 4141 | 325 | 7.848346% |
Noise dominated data is calculated using 1-second bins in cleaned event files. If a bin has >2000 counts, and if more than 50% of those come from <1% of pixels, then it is considered to be noise-dominated and hence unusable.
| Quadrant | # 1 sec bins | Bins with >0 counts | Bins with >2000 counts | High rate bins dominated by noise | Noise dominated (total time) | Noise dominated (detector-on time) | Marked lightcurve |
|---|---|---|---|---|---|---|---|
| A | 4141 | 4141 | 0 | 0 | 0.00% | 0.00% | 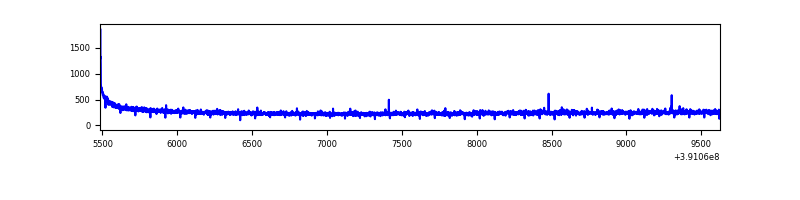 |
| B | 4139 | 4139 | 18 | 18 | 0.43% | 0.43% | 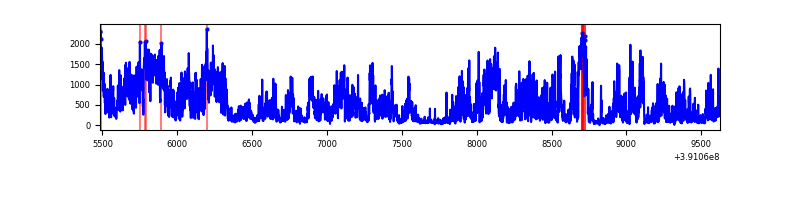 |
| C | 4140 | 4139 | 21 | 21 | 0.51% | 0.51% | 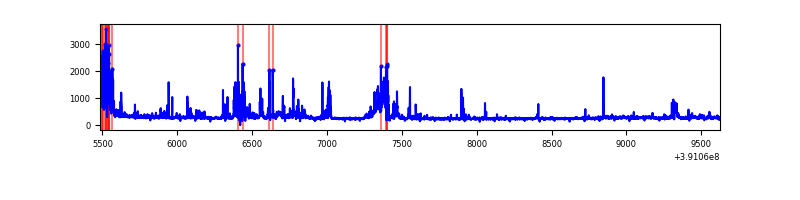 |
| D | 4140 | 4140 | 26 | 26 | 0.63% | 0.63% | 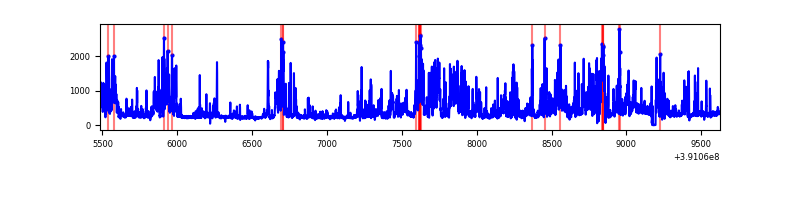 |
Top three noisy pixels from each quadrant. If the there are fewer than three noisy pixels in the level2.evt file, extra rows are filled as -1
| Pixel properties | Quadrant properties | ||||||
|---|---|---|---|---|---|---|---|
| Quadrant | DetID | PixID | Counts | Sigma | Mean | Median | Sigma |
| A | 10 | 83 | 106336 | 2029.89 | 233 | 229 | 52.3 |
| A | 8 | 144 | 8640 | 160.91 | 233 | 229 | 52.3 |
| A | 13 | 254 | 6027 | 110.92 | 233 | 229 | 52.3 |
| B | 5 | 31 | 925207 | 41659.04 | 82 | 82 | 22.2 |
| B | 5 | 15 | 826580 | 37217.79 | 82 | 82 | 22.2 |
| B | 0 | 190 | 44081 | 1981.31 | 82 | 82 | 22.2 |
| C | 9 | 187 | 242836 | 4685.08 | 220 | 218 | 51.8 |
| C | 15 | 214 | 162116 | 3126.33 | 220 | 218 | 51.8 |
| C | 0 | 10 | 94512 | 1820.86 | 220 | 218 | 51.8 |
| D | 7 | 223 | 564445 | 10541.27 | 217 | 210 | 53.5 |
| D | 12 | 17 | 158852 | 2963.82 | 217 | 210 | 53.5 |
| D | 10 | 118 | 152931 | 2853.2 | 217 | 210 | 53.5 |
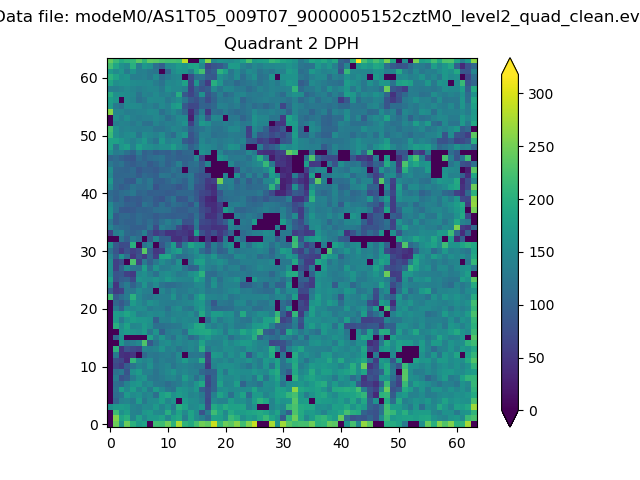
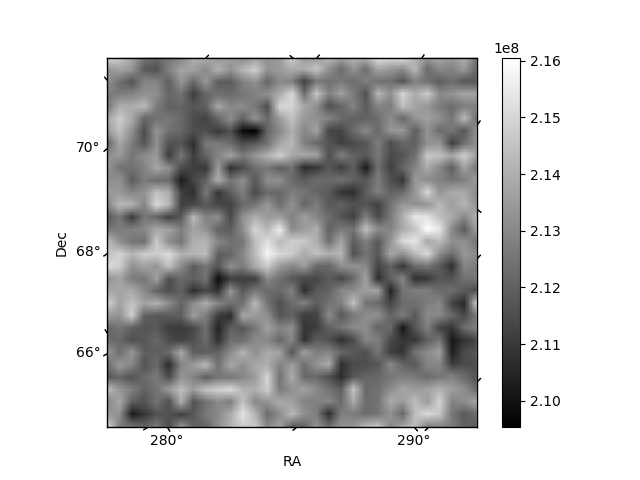
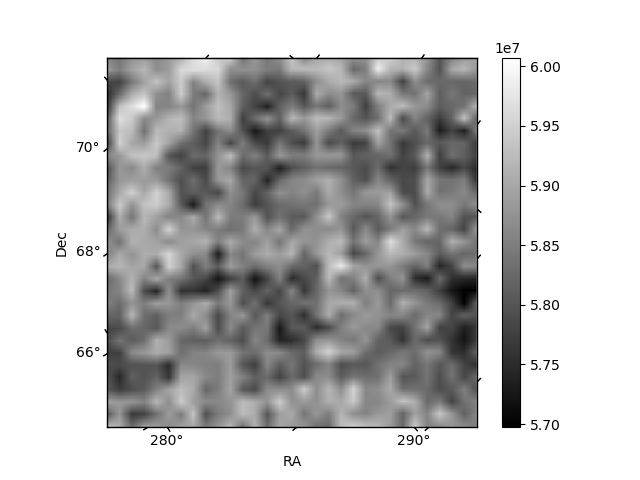
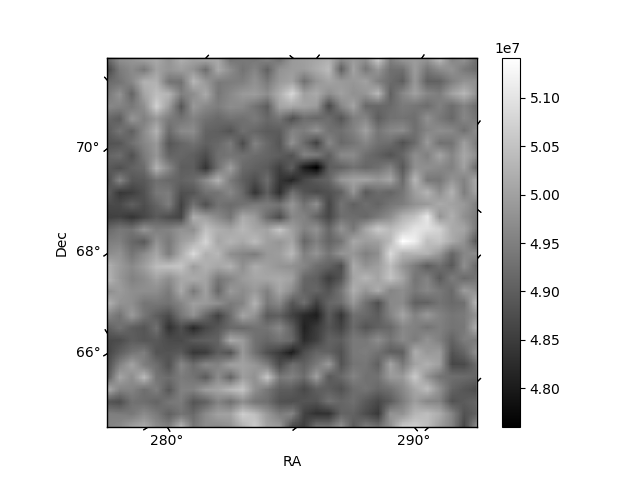
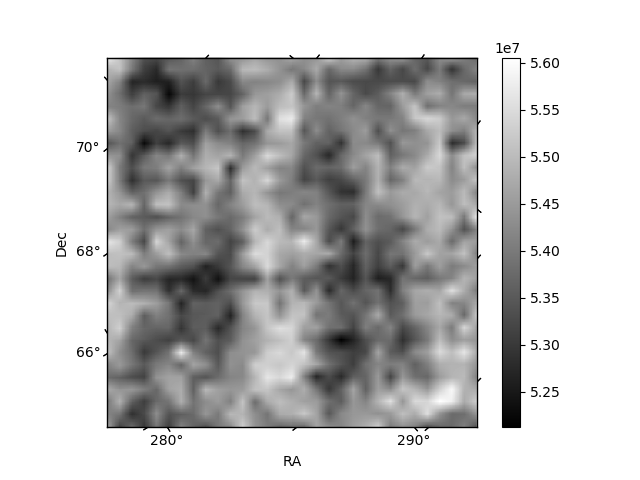
Histogram calculated using DETX and DETY for each event in the final _common_clean file
| Quadrant A | 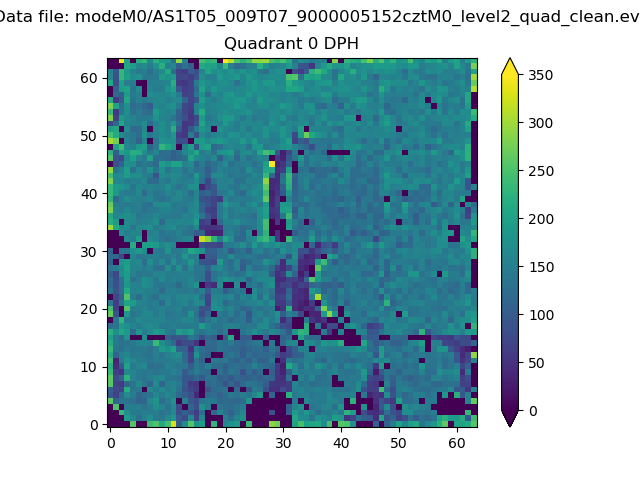 |
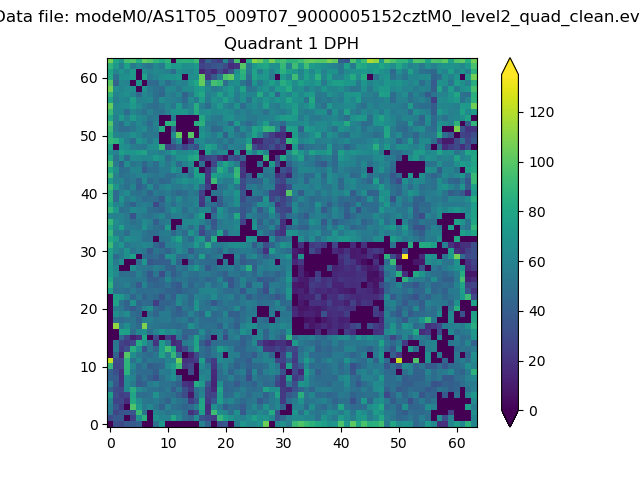 |
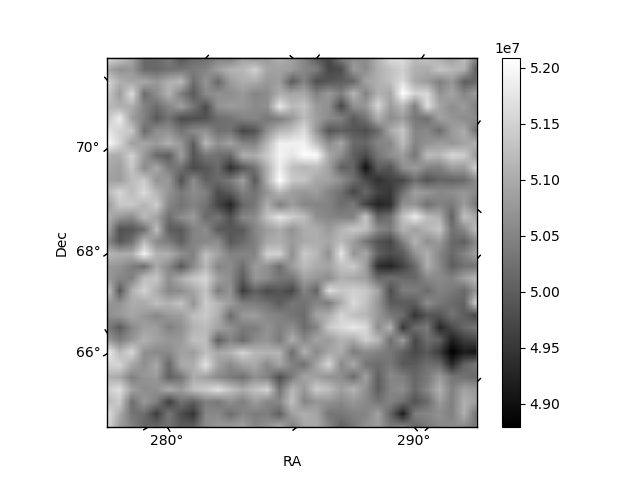
Quadrant B |
|---|---|---|---|
| Quadrant D | 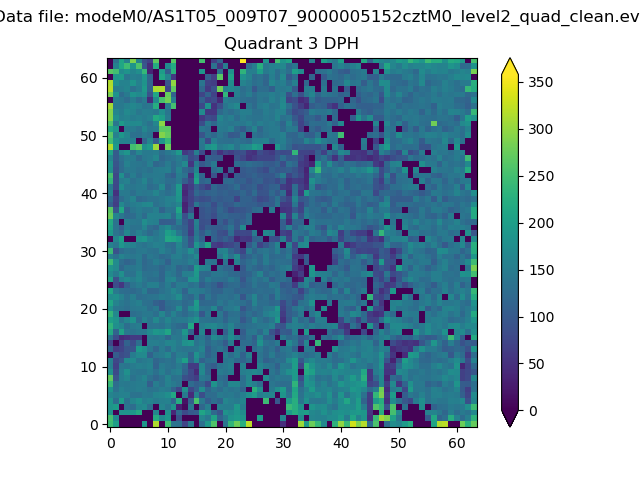 |
 |
Quadrant C |
| Plot type | Count rate plots | Images |
|---|---|---|
| Comparison with Poisson distribution Blue bars denote a histogram of data divided into 1 sec bins. Red curve is a Poisson curve with rate = median count rate of data. |
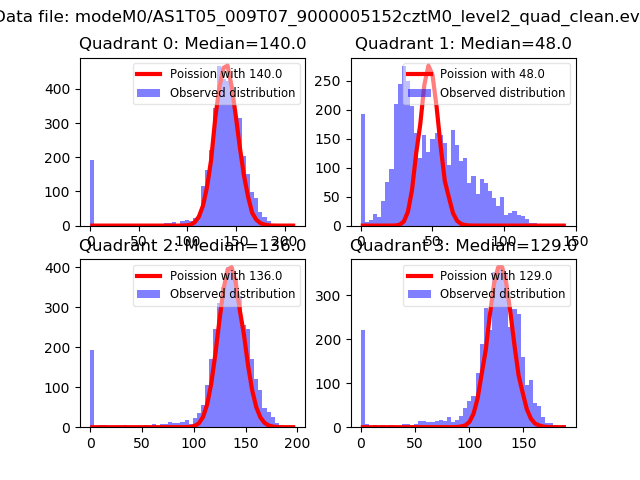 |
 |
| Quadrant-wise count rates Data is divided into 100 sec bins |
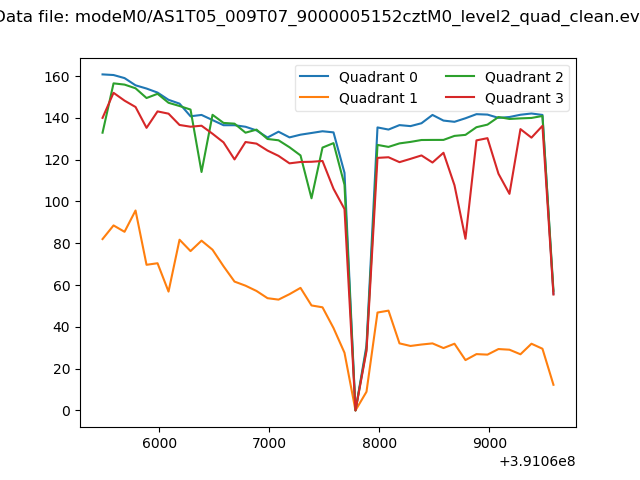 |
|
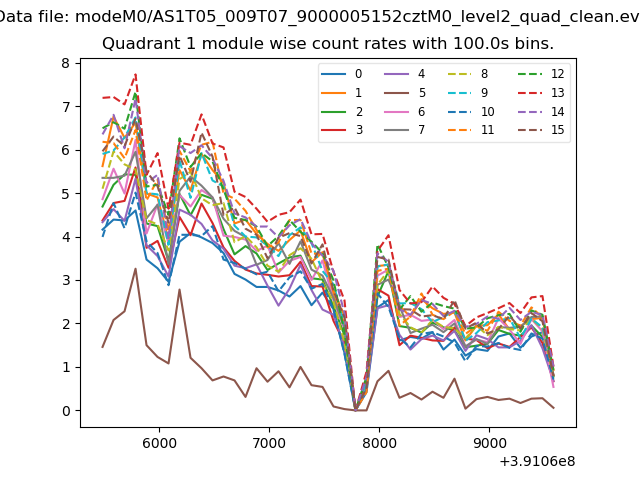
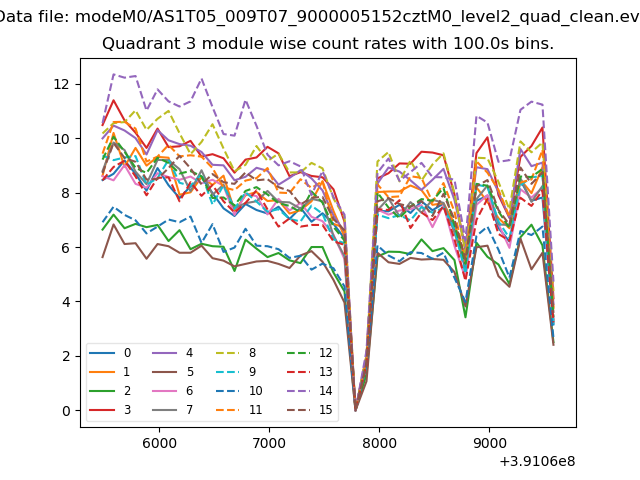
| Module-wise count rates for Quadrant A Data is divided into 100 sec bins |
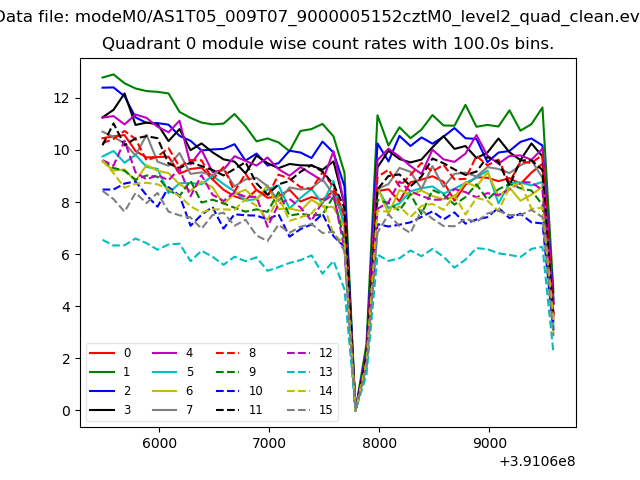 |
 |
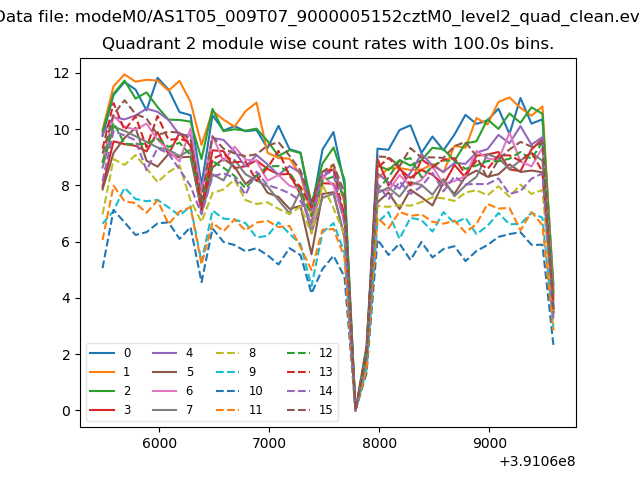
| Module-wise count rates for Quadrant B Data is divided into 100 sec bins |
 |
 |
| Module-wise count rates for Quadrant C Data is divided into 100 sec bins |
 |
 |
| Module-wise count rates for Quadrant D Data is divided into 100 sec bins |
 |
 |
| Parameter | Plot |
|---|---|
| CZT HV Monitor | 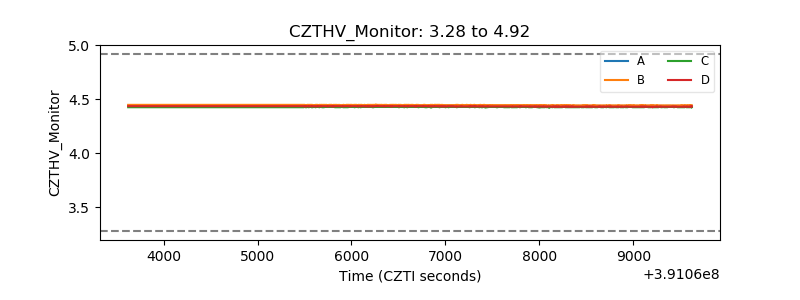 |
| D_VDD | 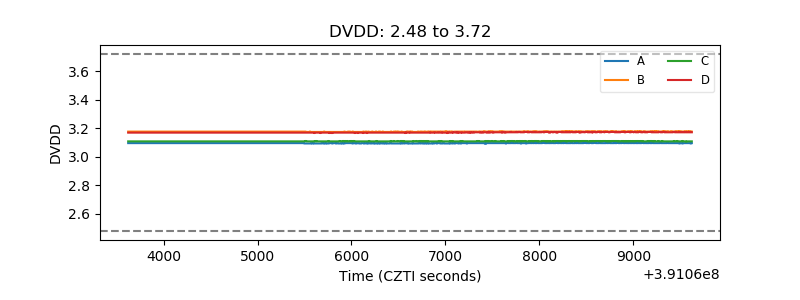 |
| Temperature 1 | 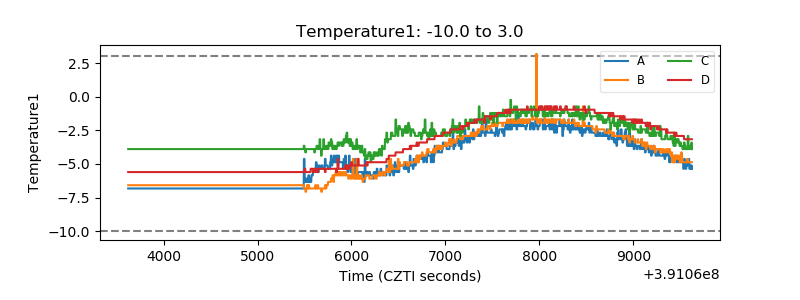 |
| Veto HV Monitor |  |
| Veto LLD | 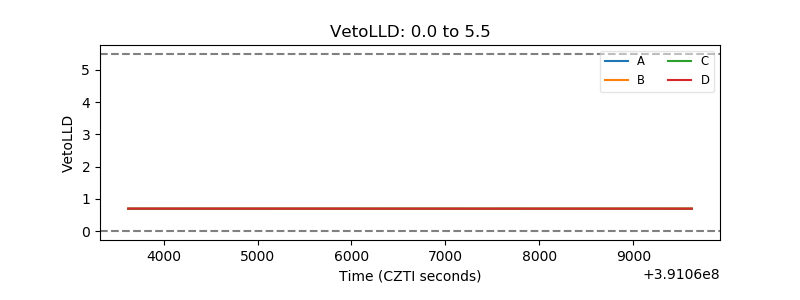 |
| Alpha Counter | 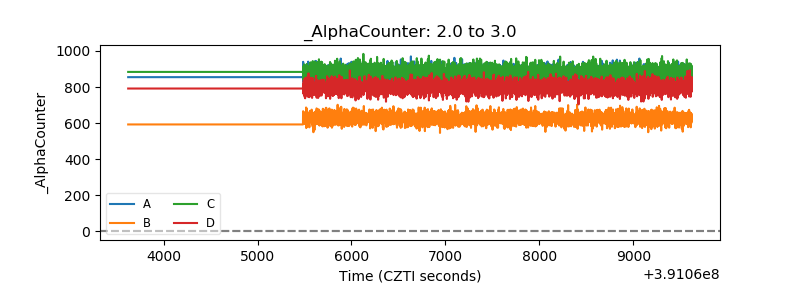 |
| _CPM_Rate | 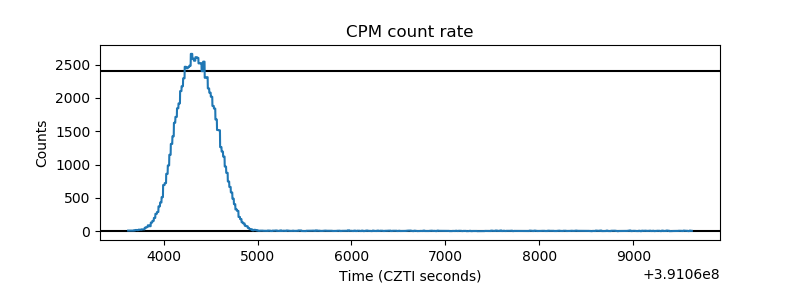 |
| CZT Counter | 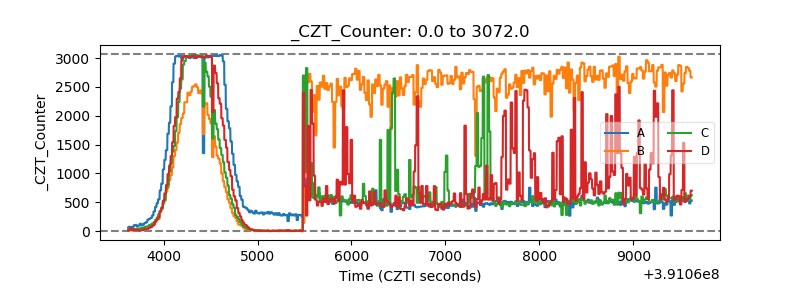 |
| +2.5 Volts monitor | 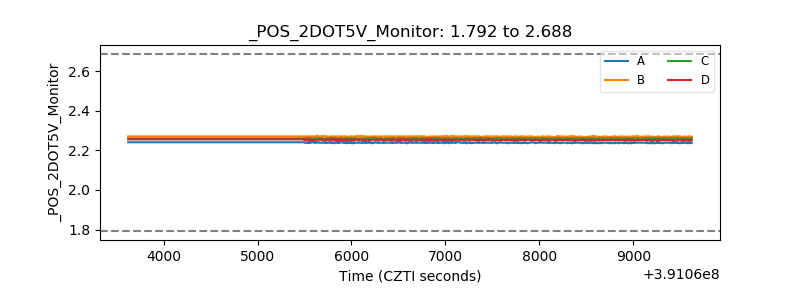 |
| +5 Volts monitor | 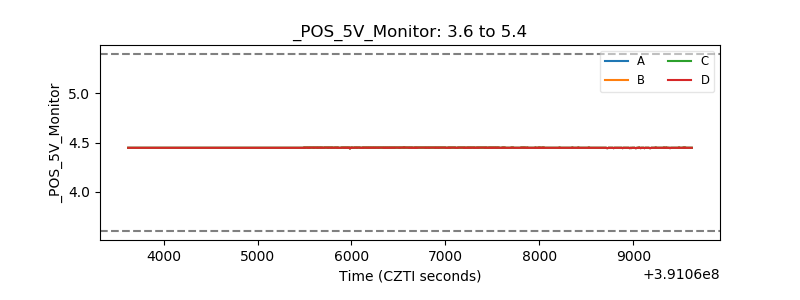 |
| _ROLL_ROT | 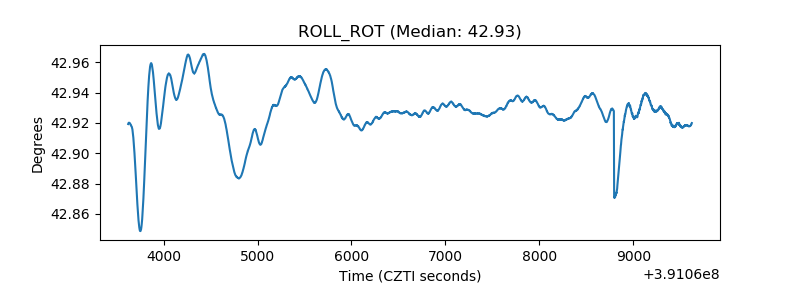 |
| _Roll_DEC | 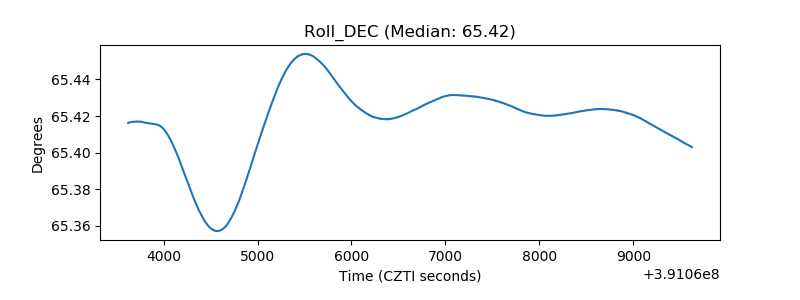 |
| _Roll_RA | 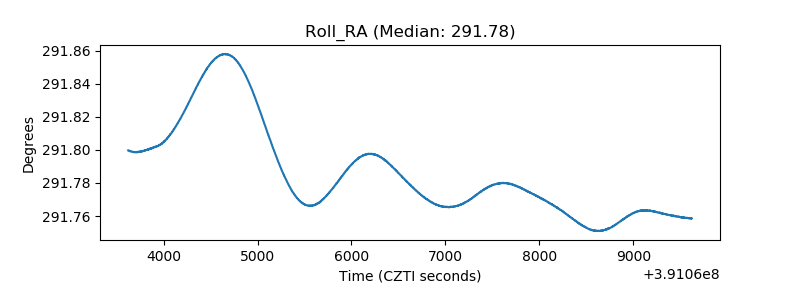 |
| Veto Counter | 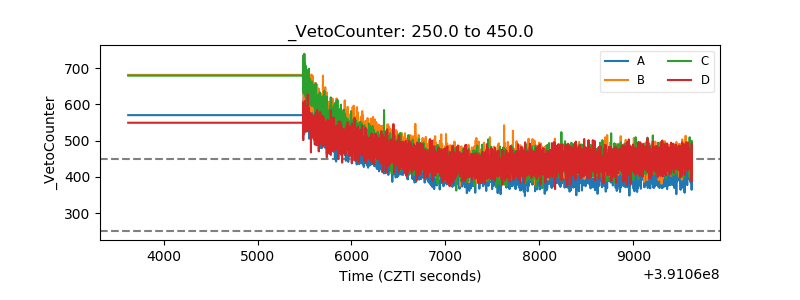 |