| Param | Original file | Final file |
|---|---|---|
| Filename | modeM0/AS1T05_009T06_9000005154_35972cztM0_level2.evt | modeM0/AS1T05_009T06_9000005154_35972cztM0_level2_quad_clean.evt |
| Size (bytes) | 584,017,920 | 64,710,720 |
| Size | 557.0 MB | 61.7 MB |
| Events in quadrant A | 1,913,459 | 533,653 |
| Events in quadrant B | 9,919,111 | 172,937 |
| Events in quadrant C | 2,752,572 | 502,822 |
| Events in quadrant D | 2,846,064 | 481,620 |
| Mode M0 | |||
|---|---|---|---|
| Quadrant | BADHDUFLAG | Total packets | Discarded packets |
| A | 0 | 7826 | 1 |
| B | 0 | 32008 | 1 |
| C | 0 | 10593 | 1 |
| D | 0 | 10859 | 1 |
| Mode SS | |||
|---|---|---|---|
| Quadrant | BADHDUFLAG | Total packets | Discarded packets |
| A | 0 | 76 | 0 |
| B | 0 | 76 | 0 |
| C | 0 | 76 | 0 |
| D | 0 | 76 | 0 |
| Mode M9 | |||
|---|---|---|---|
| Quadrant | BADHDUFLAG | Total packets | Discarded packets |
| A | 0 | 18 | 0 |
| B | 0 | 18 | 0 |
| C | 0 | 18 | 0 |
| D | 0 | 18 | 0 |
| Quadrant | Total seconds | Saturated seconds | Saturation percentage |
|---|---|---|---|
| A | 3770 | 5 | 0.132626% |
| B | 3770 | 3762 | 99.787798% |
| C | 3770 | 174 | 4.615385% |
| D | 3770 | 184 | 4.880637% |
Noise dominated data is calculated using 1-second bins in cleaned event files. If a bin has >2000 counts, and if more than 50% of those come from <1% of pixels, then it is considered to be noise-dominated and hence unusable.
| Quadrant | # 1 sec bins | Bins with >0 counts | Bins with >2000 counts | High rate bins dominated by noise | Noise dominated (total time) | Noise dominated (detector-on time) | Marked lightcurve |
|---|---|---|---|---|---|---|---|
| A | 3770 | 3770 | 0 | 0 | 0.00% | 0.00% | 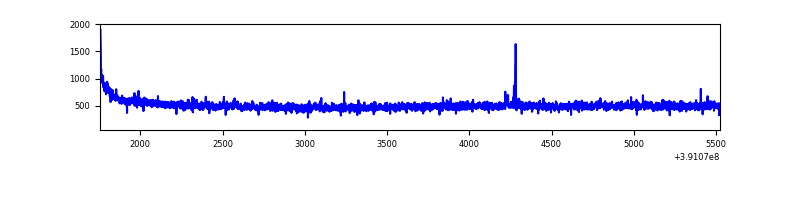 |
| B | 3769 | 3769 | 3660 | 3660 | 97.11% | 97.11% | 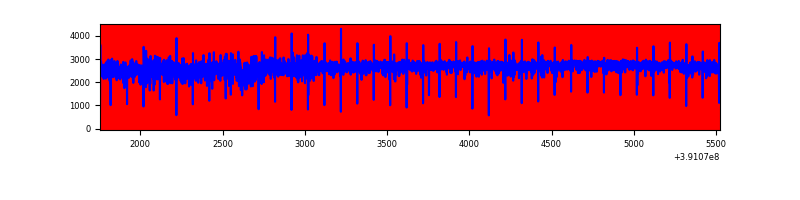 |
| C | 3770 | 3770 | 128 | 128 | 3.40% | 3.40% | 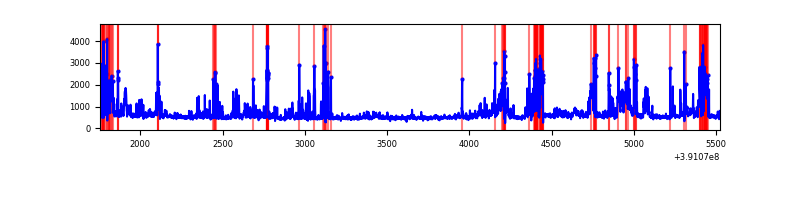 |
| D | 3770 | 3770 | 159 | 159 | 4.22% | 4.22% | 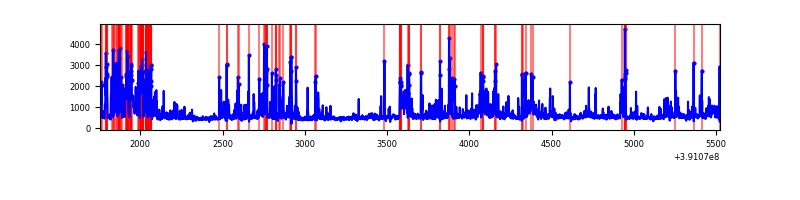 |
Top three noisy pixels from each quadrant. If the there are fewer than three noisy pixels in the level2.evt file, extra rows are filled as -1
| Pixel properties | Quadrant properties | ||||||
|---|---|---|---|---|---|---|---|
| Quadrant | DetID | PixID | Counts | Sigma | Mean | Median | Sigma |
| A | 10 | 83 | 106550 | 1147.64 | 460 | 451 | 92.4 |
| A | 8 | 144 | 10928 | 113.33 | 460 | 451 | 92.4 |
| A | 15 | 174 | 9472 | 97.58 | 460 | 451 | 92.4 |
| B | 5 | 31 | 4581738 | 135158.74 | 171 | 167 | 33.9 |
| B | 5 | 15 | 3632947 | 107168.91 | 171 | 167 | 33.9 |
| B | 5 | 14 | 787693 | 23232.43 | 171 | 167 | 33.9 |
| C | 9 | 187 | 612097 | 6279.52 | 426 | 429 | 97.4 |
| C | 0 | 207 | 232089 | 2378.27 | 426 | 429 | 97.4 |
| C | 15 | 214 | 157195 | 1609.39 | 426 | 429 | 97.4 |
| D | 2 | 250 | 322671 | 3042.45 | 433 | 422 | 105.9 |
| D | 12 | 17 | 200979 | 1893.52 | 433 | 422 | 105.9 |
| D | 1 | 52 | 131005 | 1232.87 | 433 | 422 | 105.9 |
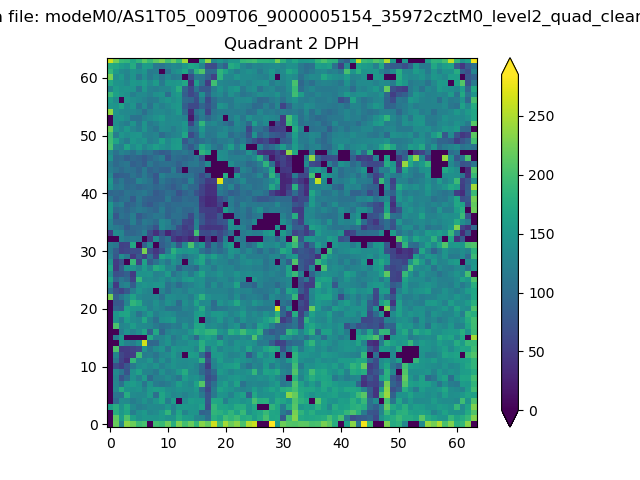
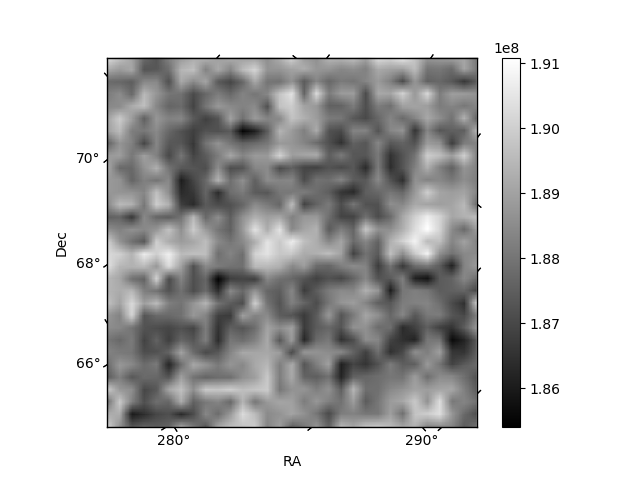
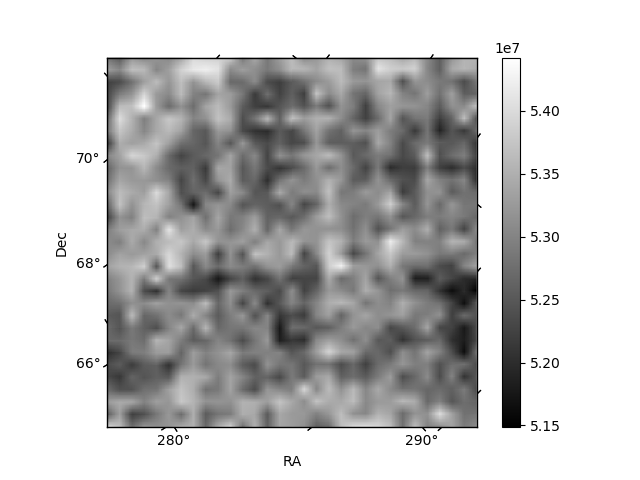
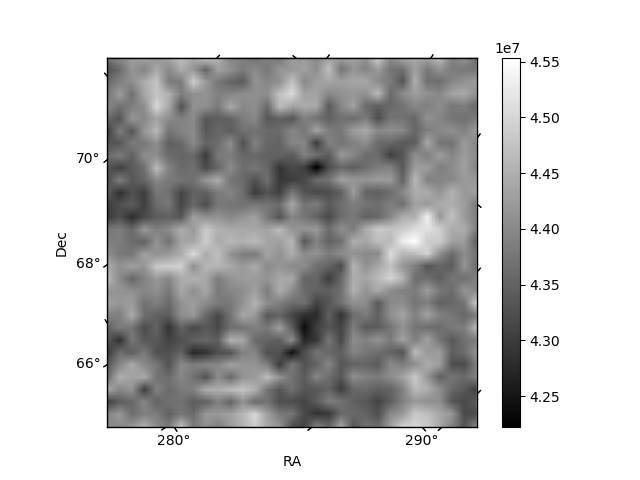
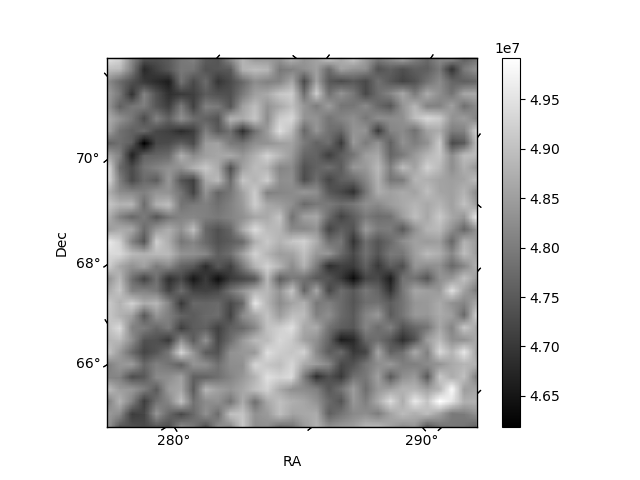
Histogram calculated using DETX and DETY for each event in the final _common_clean file
| Quadrant A | 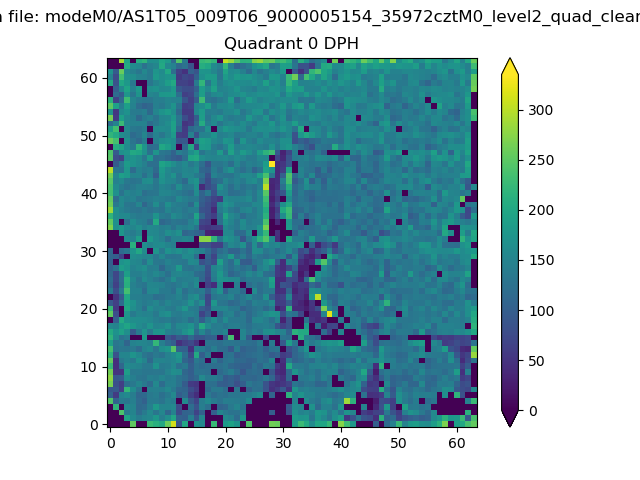 |
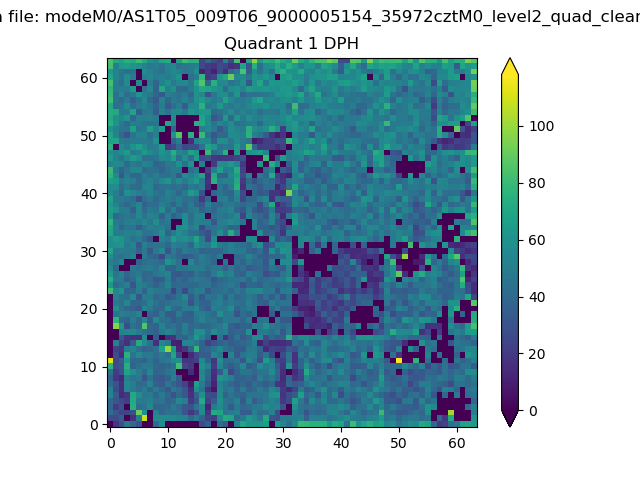 |
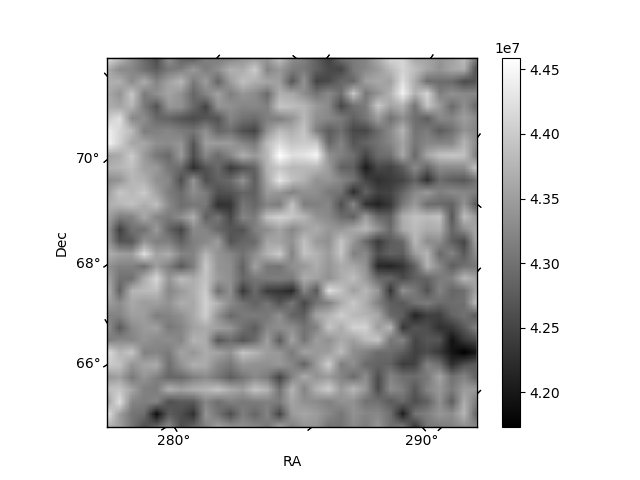
Quadrant B |
|---|---|---|---|
| Quadrant D | 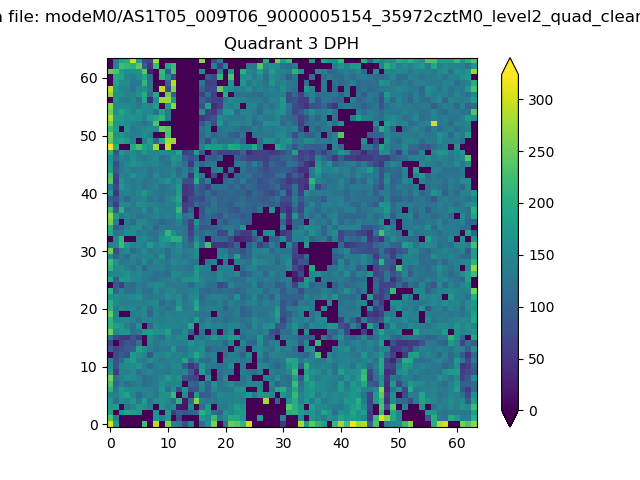 |
 |
Quadrant C |
| Plot type | Count rate plots | Images |
|---|---|---|
| Comparison with Poisson distribution Blue bars denote a histogram of data divided into 1 sec bins. Red curve is a Poisson curve with rate = median count rate of data. |
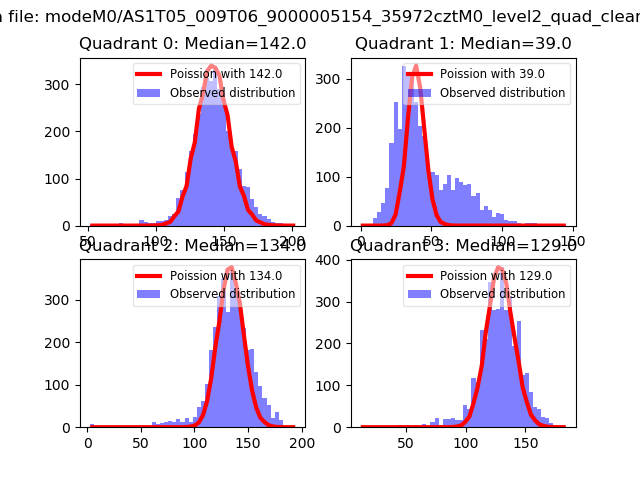 |
 |
| Quadrant-wise count rates Data is divided into 100 sec bins |
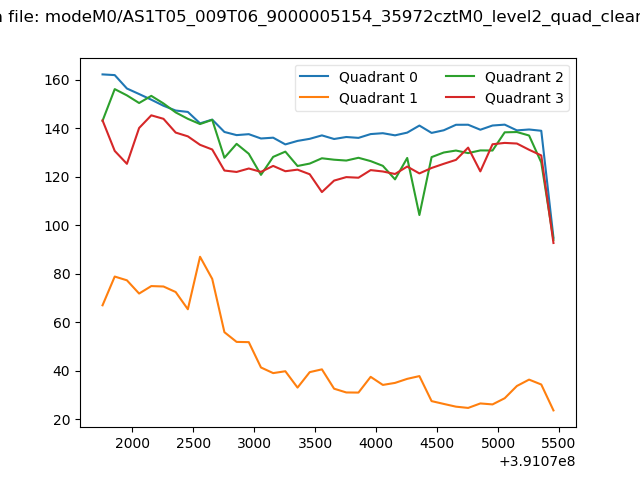 |
|
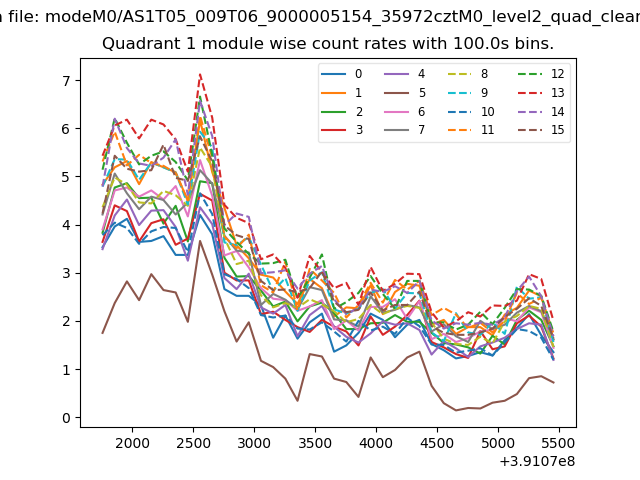
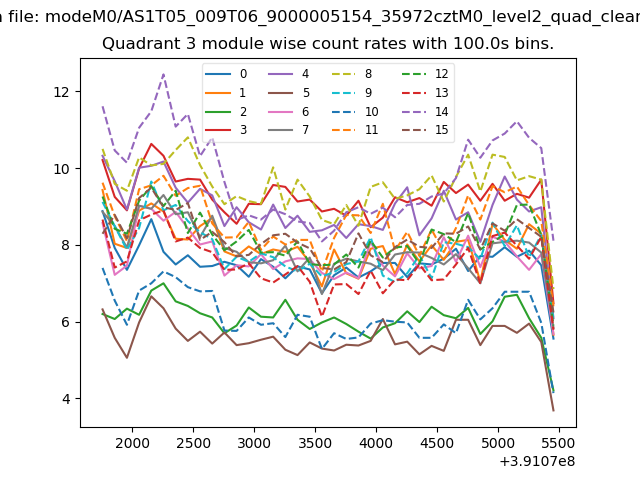
| Module-wise count rates for Quadrant A Data is divided into 100 sec bins |
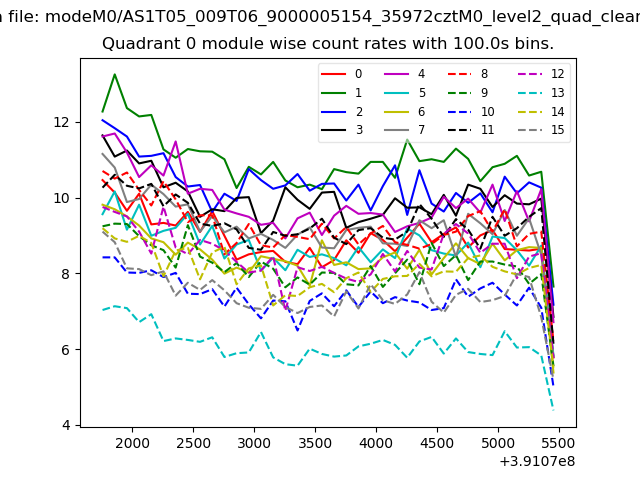 |
 |
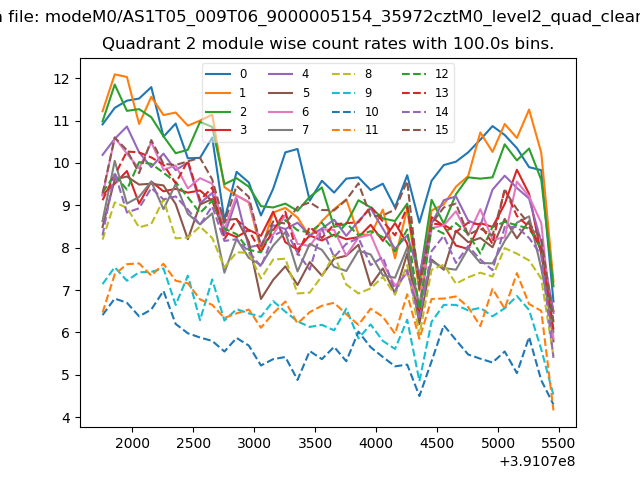
| Module-wise count rates for Quadrant B Data is divided into 100 sec bins |
 |
 |
| Module-wise count rates for Quadrant C Data is divided into 100 sec bins |
 |
 |
| Module-wise count rates for Quadrant D Data is divided into 100 sec bins |
 |
 |
| Parameter | Plot |
|---|---|
| CZT HV Monitor | 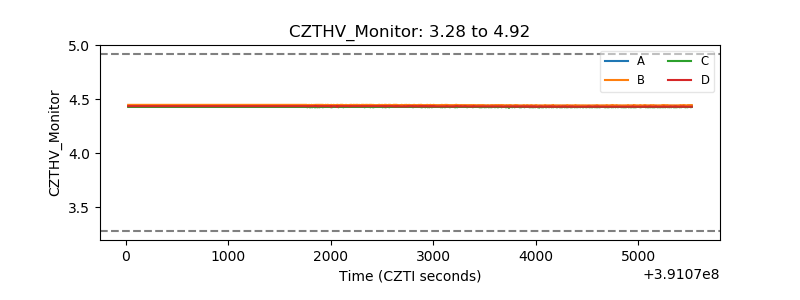 |
| D_VDD | 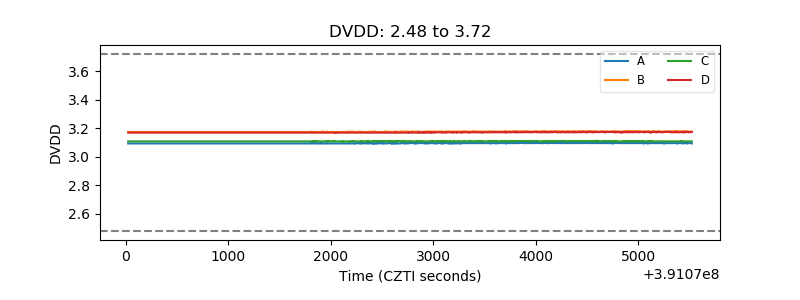 |
| Temperature 1 | 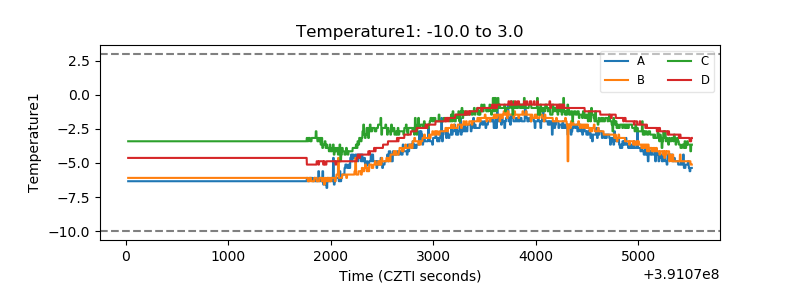 |
| Veto HV Monitor | 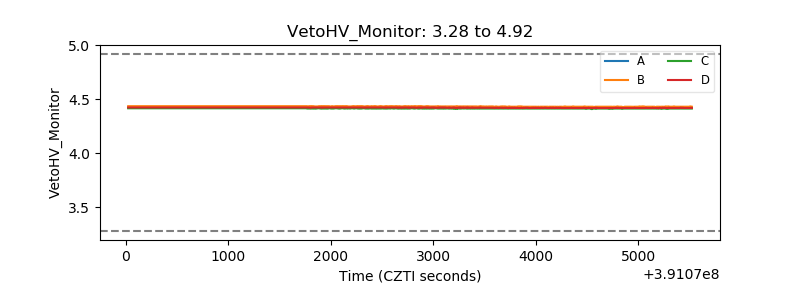 |
| Veto LLD | 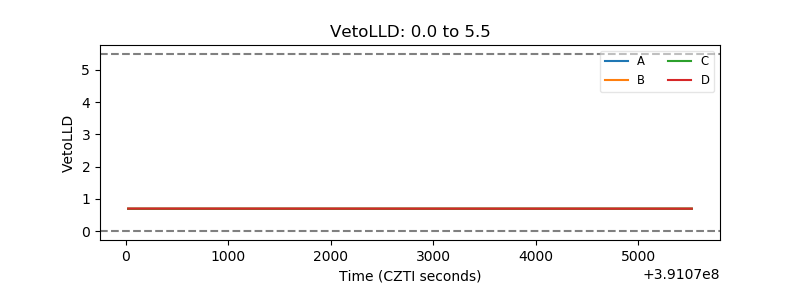 |
| Alpha Counter | 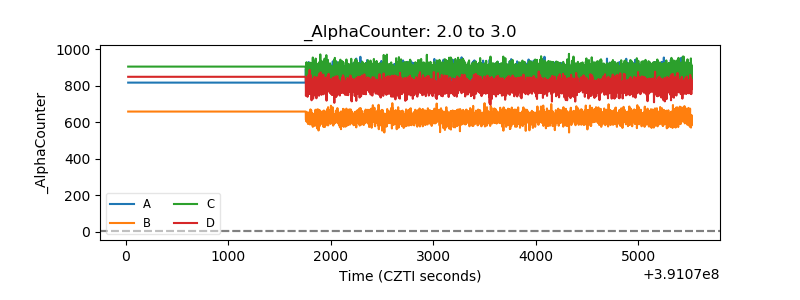 |
| _CPM_Rate | 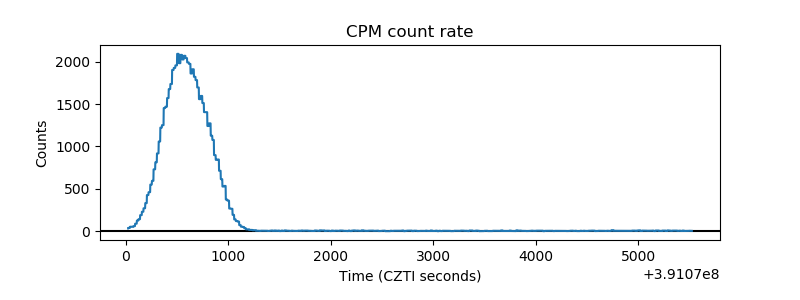 |
| CZT Counter | 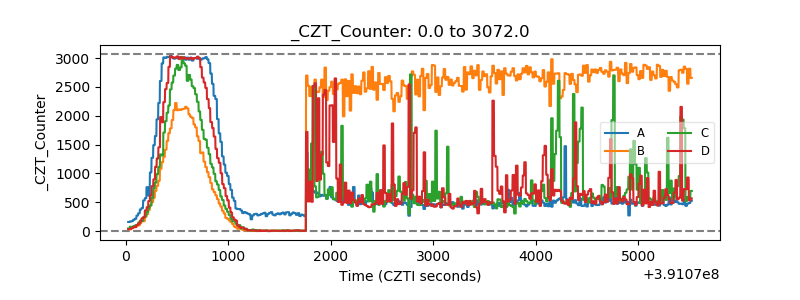 |
| +2.5 Volts monitor | 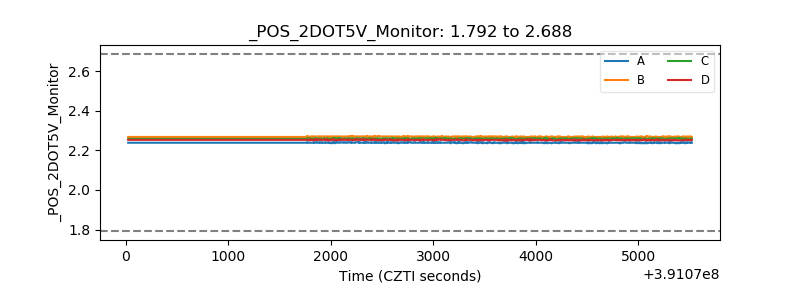 |
| +5 Volts monitor | 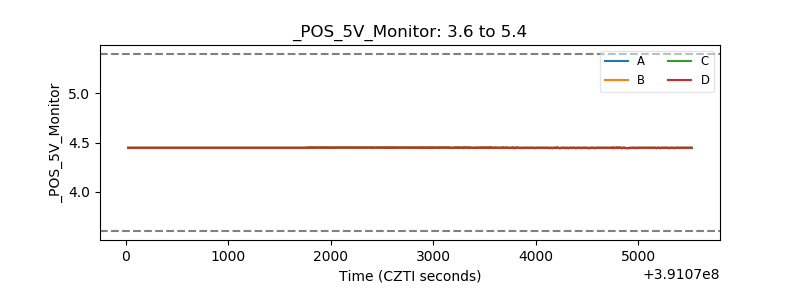 |
| _ROLL_ROT | 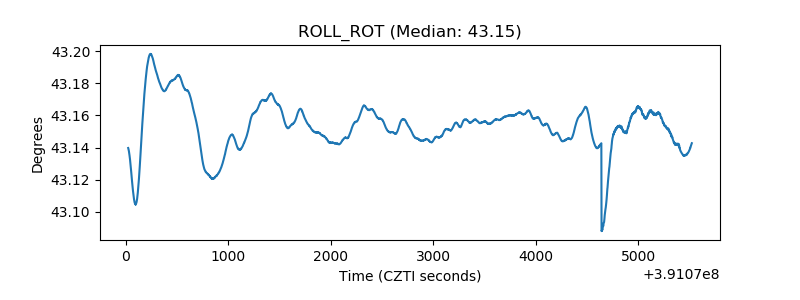 |
| _Roll_DEC | 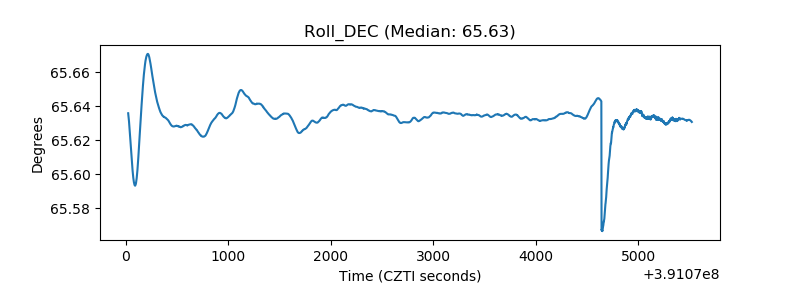 |
| _Roll_RA | 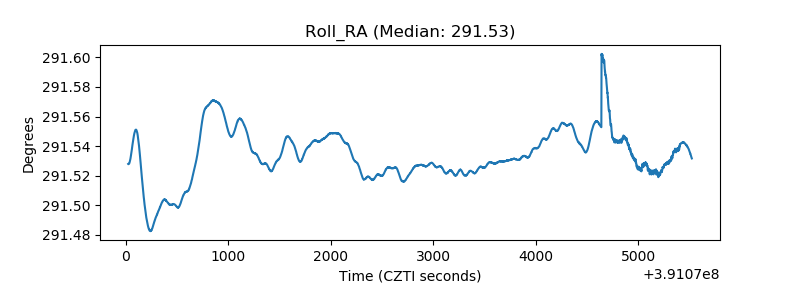 |
| Veto Counter | 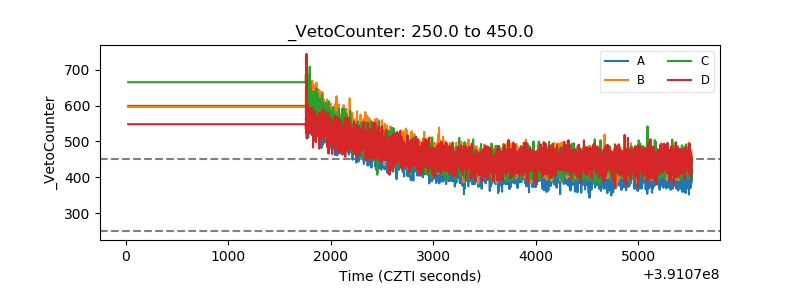 |