| Param | Original file | Final file |
|---|---|---|
| Filename | modeM0/AS1A11_050T19_9000005156_36002cztM0_level2.evt | modeM0/AS1A11_050T19_9000005156_36002cztM0_level2_quad_clean.evt |
| Size (bytes) | 278,150,400 | 70,128,000 |
| Size | 265.3 MB | 66.9 MB |
| Events in quadrant A | 1,695,921 | 476,042 |
| Events in quadrant B | 1,915,606 | 477,391 |
| Events in quadrant C | 2,204,613 | 470,613 |
| Events in quadrant D | 2,368,684 | 451,734 |
| Mode M0 | |||
|---|---|---|---|
| Quadrant | BADHDUFLAG | Total packets | Discarded packets |
| A | 0 | 7324 | 129 |
| B | 0 | 8008 | 108 |
| C | 0 | 8800 | 128 |
| D | 0 | 9380 | 180 |
| Mode SS | |||
|---|---|---|---|
| Quadrant | BADHDUFLAG | Total packets | Discarded packets |
| A | 0 | 72 | 0 |
| B | 0 | 72 | 0 |
| C | 0 | 72 | 0 |
| D | 0 | 72 | 2 |
| Mode M9 | |||
|---|---|---|---|
| Quadrant | BADHDUFLAG | Total packets | Discarded packets |
| A | 0 | 7 | 0 |
| B | 0 | 7 | 0 |
| C | 0 | 7 | 0 |
| D | 0 | 8 | 0 |
| Quadrant | Total seconds | Saturated seconds | Saturation percentage |
|---|---|---|---|
| A | 3490 | 1 | 0.028653% |
| B | 3502 | 26 | 0.742433% |
| C | 3490 | 119 | 3.409742% |
| D | 3490 | 102 | 2.922636% |
Noise dominated data is calculated using 1-second bins in cleaned event files. If a bin has >2000 counts, and if more than 50% of those come from <1% of pixels, then it is considered to be noise-dominated and hence unusable.
| Quadrant | # 1 sec bins | Bins with >0 counts | Bins with >2000 counts | High rate bins dominated by noise | Noise dominated (total time) | Noise dominated (detector-on time) | Marked lightcurve |
|---|---|---|---|---|---|---|---|
| A | 3554 | 3529 | 0 | 0 | 0.00% | 0.00% | 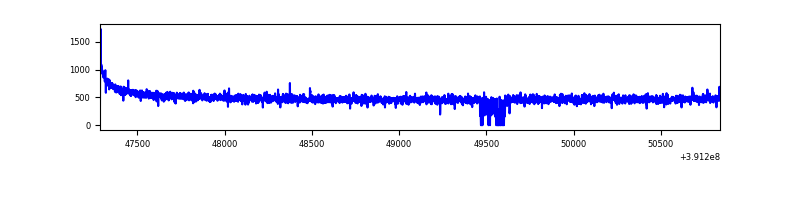 |
| B | 3554 | 3527 | 16 | 16 | 0.45% | 0.45% | 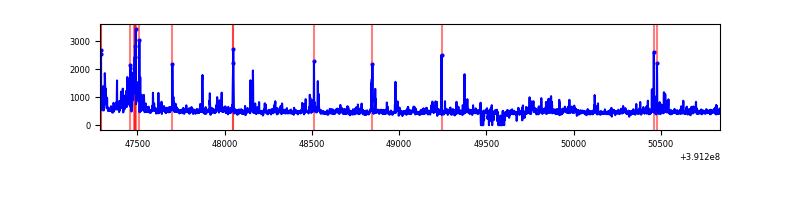 |
| C | 3554 | 3514 | 91 | 91 | 2.56% | 2.59% | 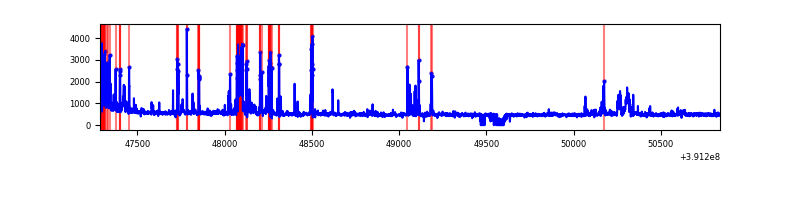 |
| D | 3554 | 3520 | 89 | 89 | 2.50% | 2.53% | 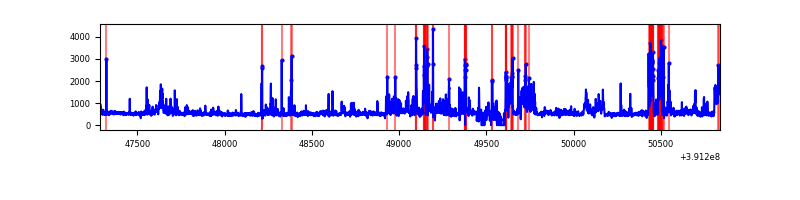 |
Top three noisy pixels from each quadrant. If the there are fewer than three noisy pixels in the level2.evt file, extra rows are filled as -1
| Pixel properties | Quadrant properties | ||||||
|---|---|---|---|---|---|---|---|
| Quadrant | DetID | PixID | Counts | Sigma | Mean | Median | Sigma |
| A | 10 | 83 | 96841 | 1163.01 | 411 | 403 | 82.9 |
| A | 13 | 254 | 5679 | 63.63 | 411 | 403 | 82.9 |
| A | 13 | 6 | 4640 | 51.1 | 411 | 403 | 82.9 |
| B | 5 | 172 | 145944 | 1903.16 | 402 | 392 | 76.5 |
| B | 4 | 171 | 94566 | 1231.37 | 402 | 392 | 76.5 |
| B | 5 | 255 | 40899 | 529.65 | 402 | 392 | 76.5 |
| C | 0 | 207 | 290818 | 3201.38 | 394 | 397 | 90.7 |
| C | 15 | 214 | 144312 | 1586.41 | 394 | 397 | 90.7 |
| C | 0 | 10 | 92265 | 1012.68 | 394 | 397 | 90.7 |
| D | 12 | 235 | 308998 | 3175.35 | 398 | 388 | 97.2 |
| D | 10 | 118 | 187002 | 1920.11 | 398 | 388 | 97.2 |
| D | 12 | 227 | 111107 | 1139.21 | 398 | 388 | 97.2 |
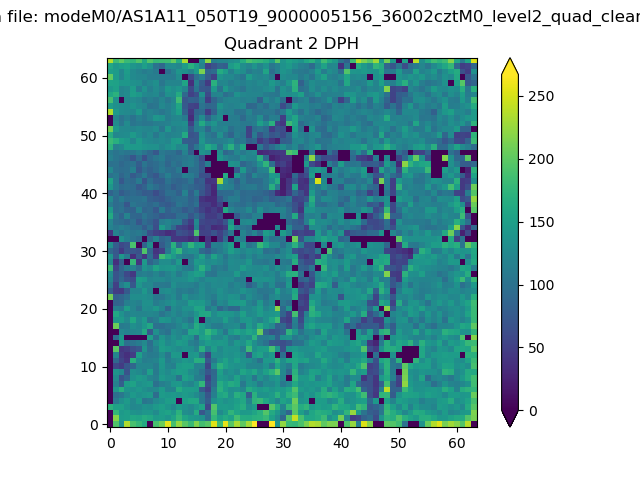
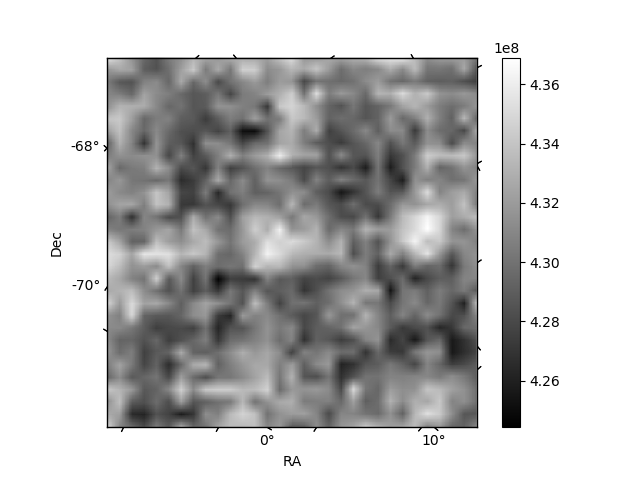
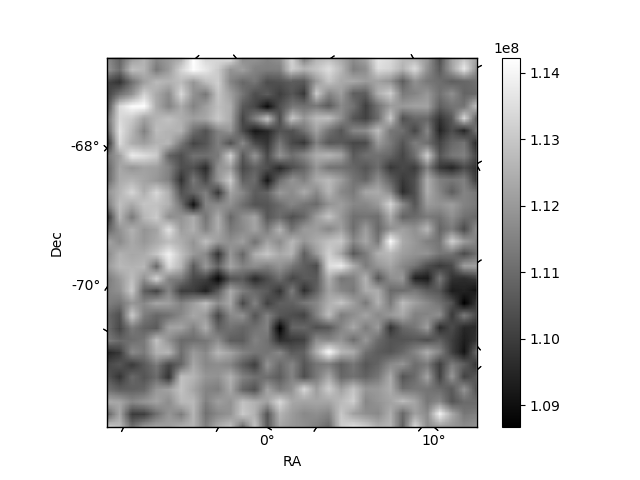
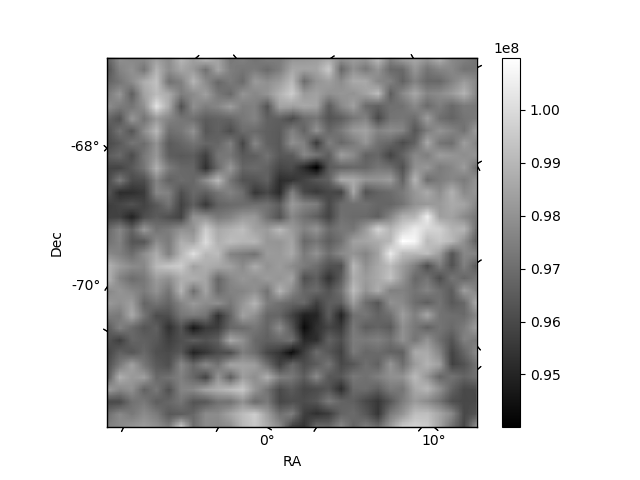
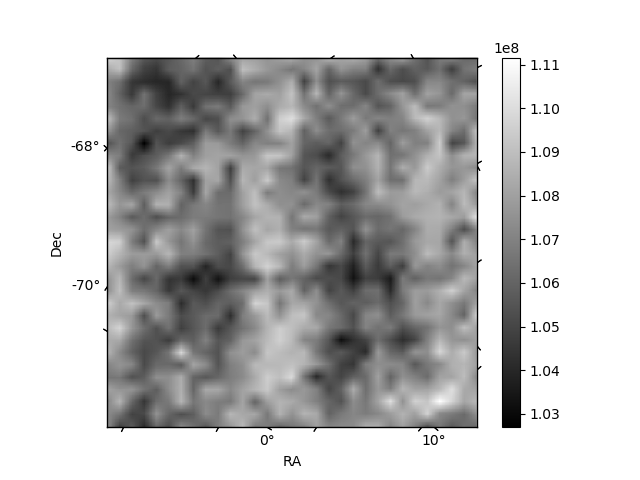
Histogram calculated using DETX and DETY for each event in the final _common_clean file
| Quadrant A | 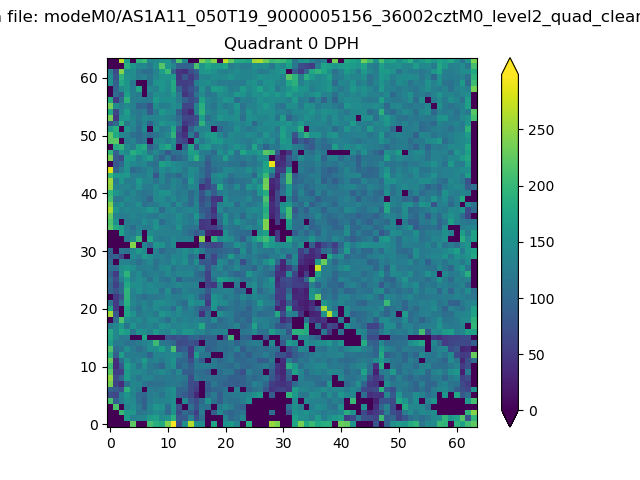 |
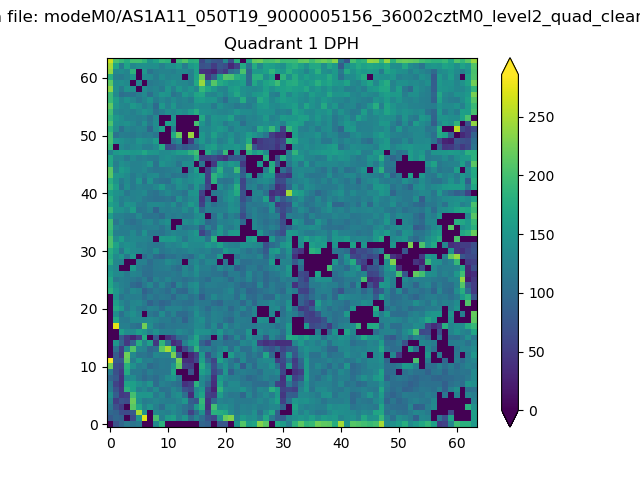 |
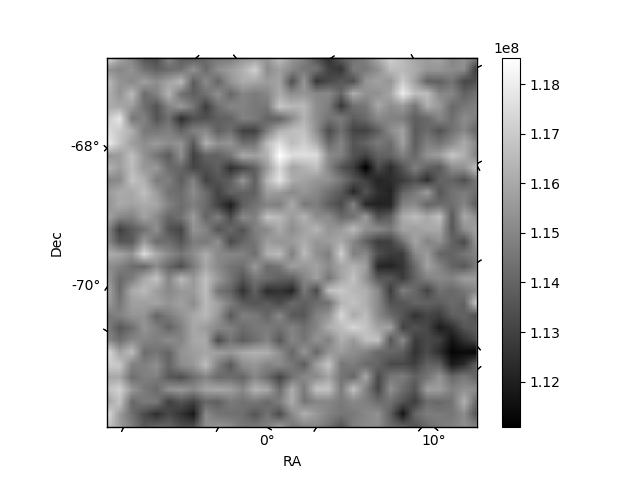
Quadrant B |
|---|---|---|---|
| Quadrant D | 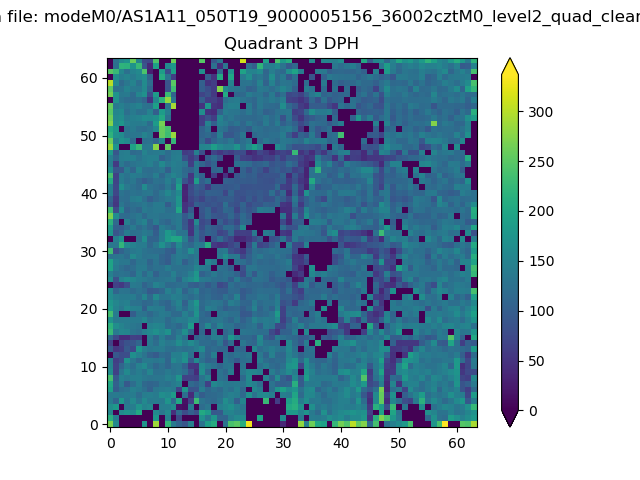 |
 |
Quadrant C |
| Plot type | Count rate plots | Images |
|---|---|---|
| Comparison with Poisson distribution Blue bars denote a histogram of data divided into 1 sec bins. Red curve is a Poisson curve with rate = median count rate of data. |
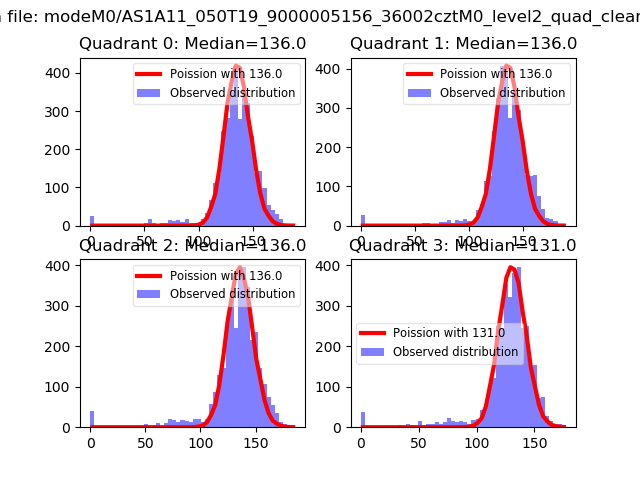 |
 |
| Quadrant-wise count rates Data is divided into 100 sec bins |
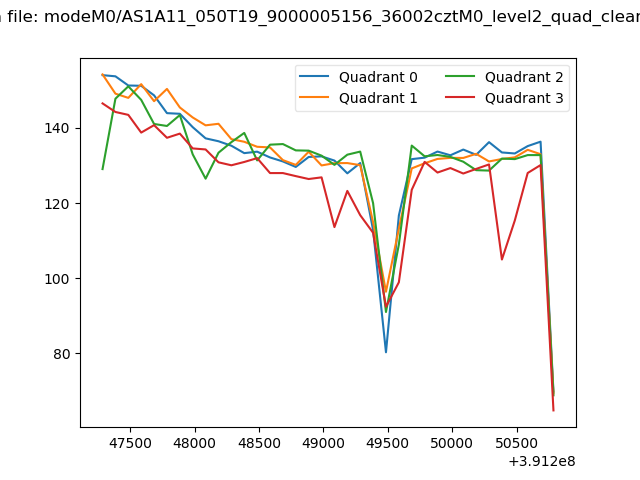 |
|
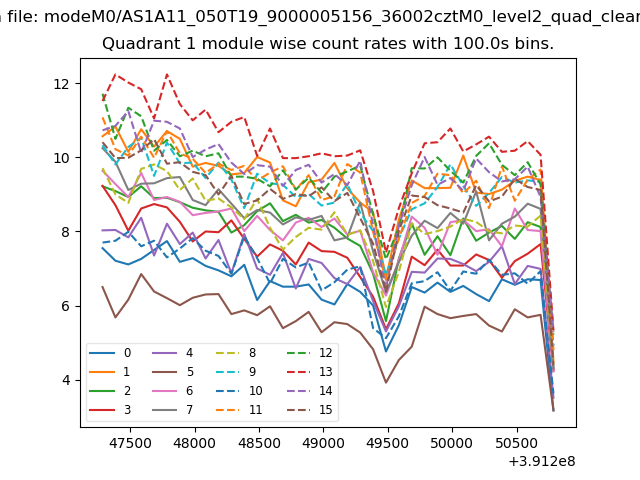
| Module-wise count rates for Quadrant A Data is divided into 100 sec bins |
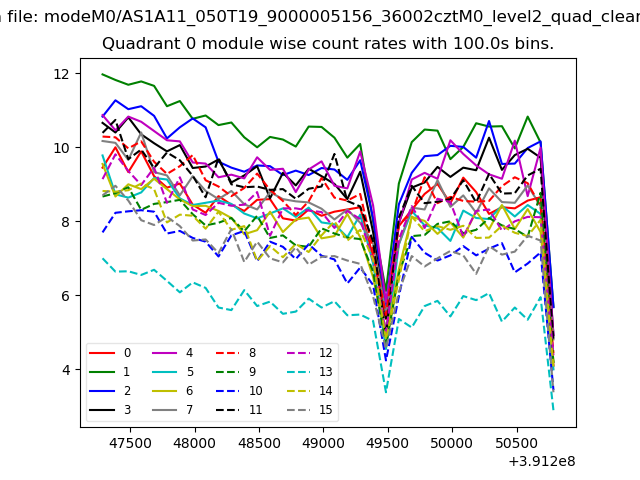 |
 |
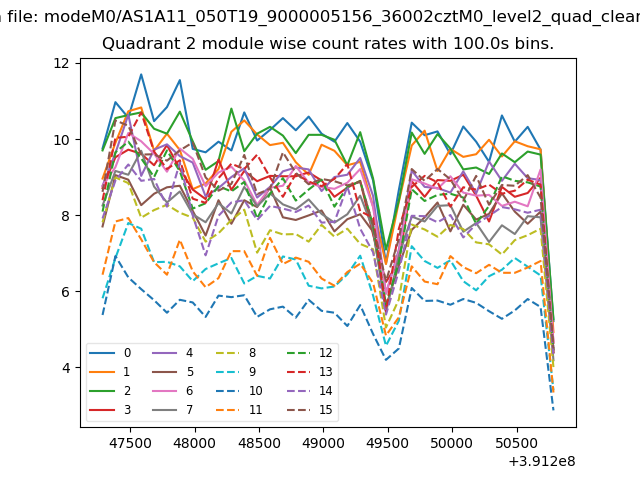
| Module-wise count rates for Quadrant B Data is divided into 100 sec bins |
 |
 |
| Module-wise count rates for Quadrant C Data is divided into 100 sec bins |
 |
 |
| Module-wise count rates for Quadrant D Data is divided into 100 sec bins |
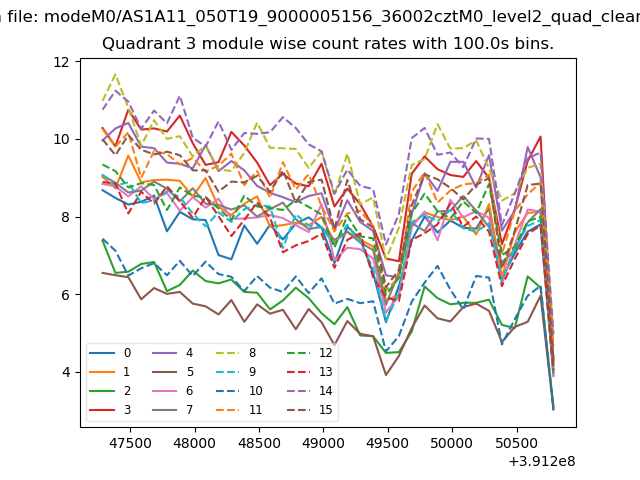 |
 |
| Parameter | Plot |
|---|---|
| CZT HV Monitor | 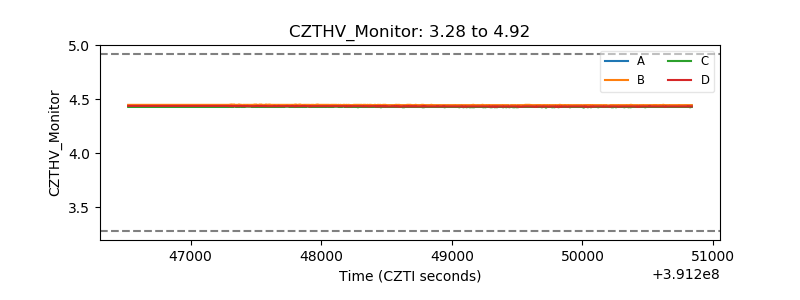 |
| D_VDD | 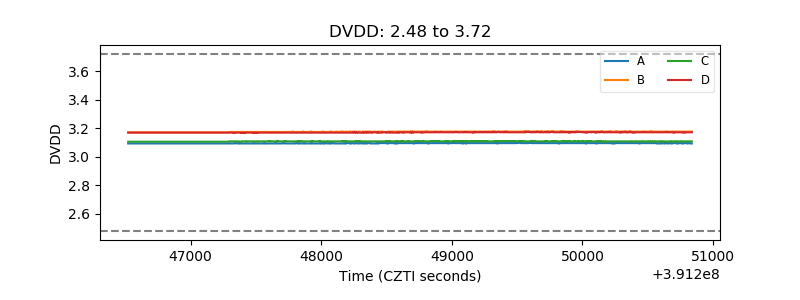 |
| Temperature 1 | 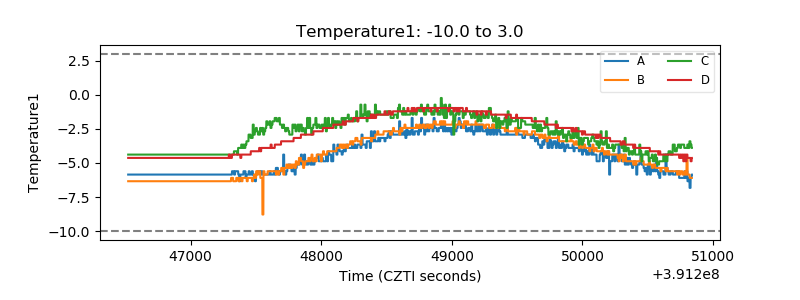 |
| Veto HV Monitor | 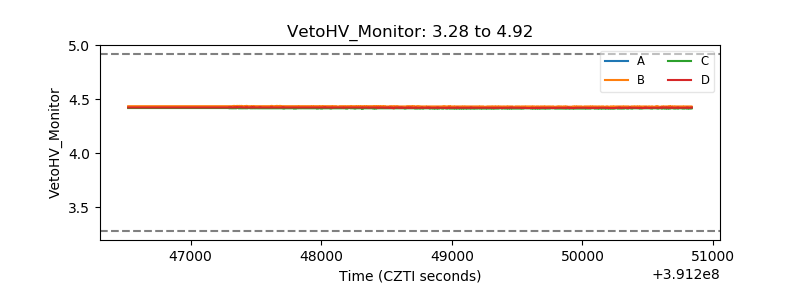 |
| Veto LLD | 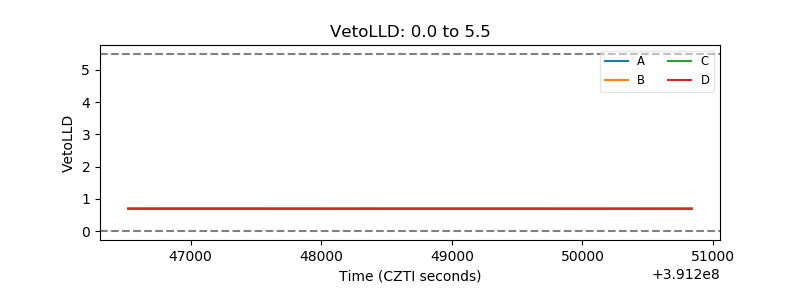 |
| Alpha Counter | 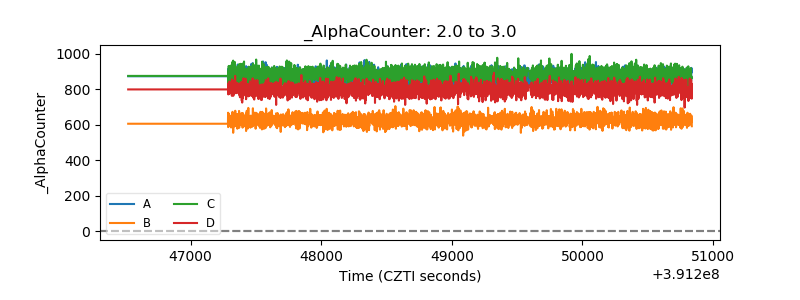 |
| _CPM_Rate | 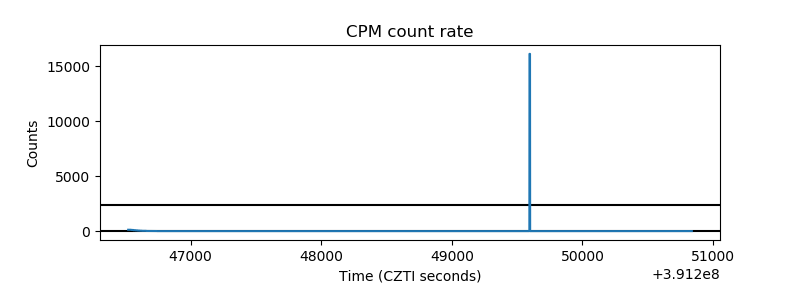 |
| CZT Counter | 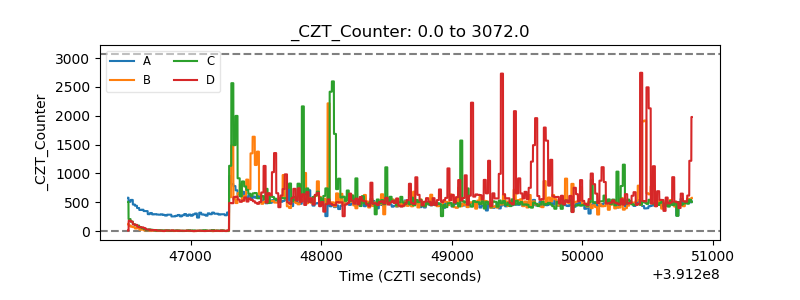 |
| +2.5 Volts monitor | 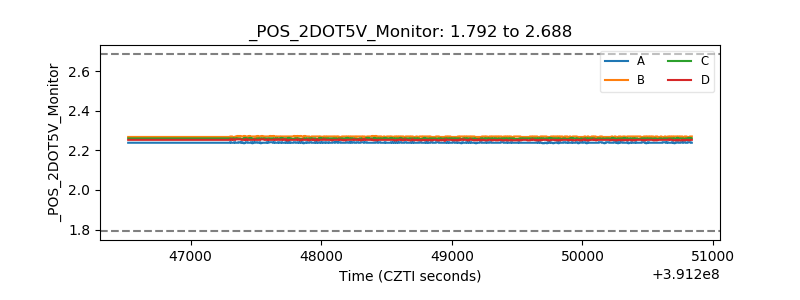 |
| +5 Volts monitor | 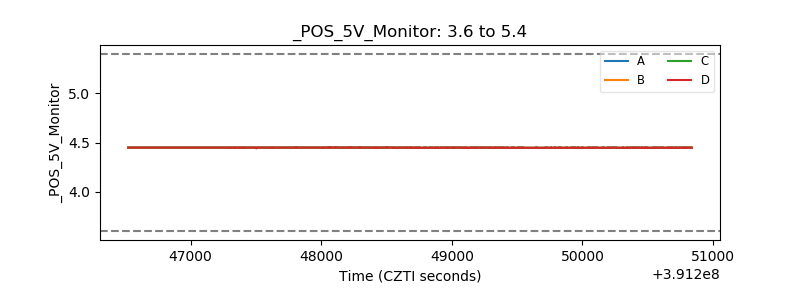 |
| _ROLL_ROT | 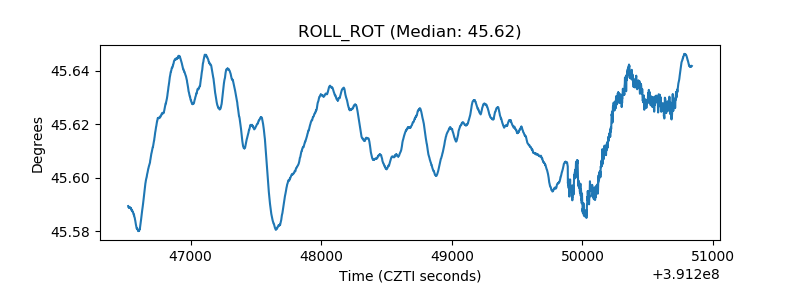 |
| _Roll_DEC | 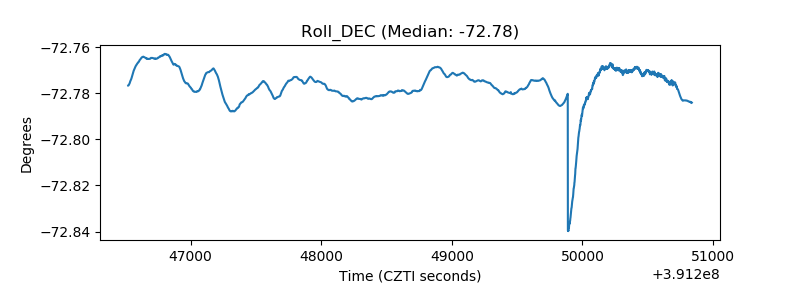 |
| _Roll_RA | 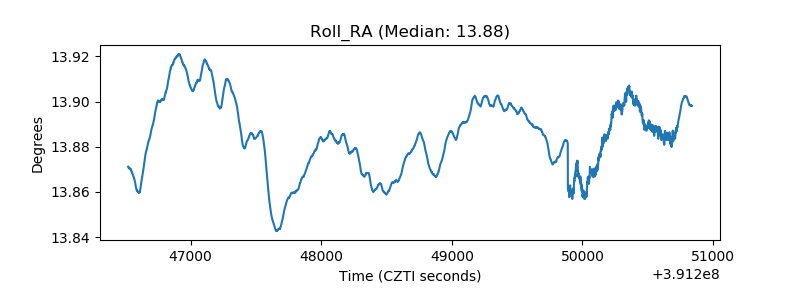 |
| Veto Counter | 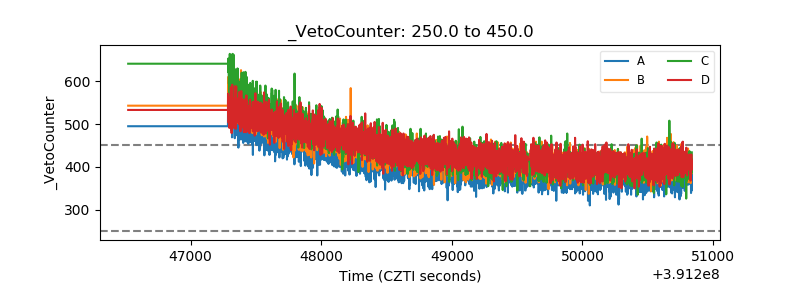 |