| Param | Original file | Final file |
|---|---|---|
| Filename | modeM0/AS1A11_050T19_9000005156_35998cztM0_level2.evt | modeM0/AS1A11_050T19_9000005156_35998cztM0_level2_quad_clean.evt |
| Size (bytes) | 521,346,240 | 102,280,320 |
| Size | 497.2 MB | 97.5 MB |
| Events in quadrant A | 2,627,237 | 717,190 |
| Events in quadrant B | 3,099,835 | 718,051 |
| Events in quadrant C | 4,874,070 | 656,768 |
| Events in quadrant D | 4,826,185 | 631,582 |
| Mode M0 | |||
|---|---|---|---|
| Quadrant | BADHDUFLAG | Total packets | Discarded packets |
| A | 0 | 11135 | 3 |
| B | 0 | 12606 | 2 |
| C | 0 | 17766 | 2 |
| D | 0 | 17918 | 2 |
| Mode SS | |||
|---|---|---|---|
| Quadrant | BADHDUFLAG | Total packets | Discarded packets |
| A | 0 | 112 | 0 |
| B | 0 | 112 | 0 |
| C | 0 | 112 | 0 |
| D | 0 | 112 | 0 |
| Mode M9 | |||
|---|---|---|---|
| Quadrant | BADHDUFLAG | Total packets | Discarded packets |
| A | 0 | 35 | 0 |
| B | 0 | 35 | 0 |
| C | 0 | 35 | 0 |
| D | 0 | 35 | 0 |
| Quadrant | Total seconds | Saturated seconds | Saturation percentage |
|---|---|---|---|
| A | 5329 | 7 | 0.131357% |
| B | 5329 | 108 | 2.026647% |
| C | 5329 | 808 | 15.162319% |
| D | 5329 | 725 | 13.604804% |
Noise dominated data is calculated using 1-second bins in cleaned event files. If a bin has >2000 counts, and if more than 50% of those come from <1% of pixels, then it is considered to be noise-dominated and hence unusable.
| Quadrant | # 1 sec bins | Bins with >0 counts | Bins with >2000 counts | High rate bins dominated by noise | Noise dominated (total time) | Noise dominated (detector-on time) | Marked lightcurve |
|---|---|---|---|---|---|---|---|
| A | 8918 | 5332 | 0 | 0 | 0.00% | 0.00% | 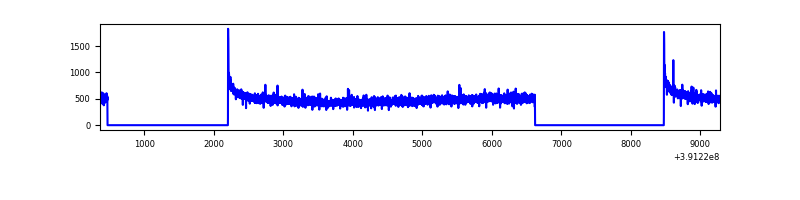 |
| B | 8918 | 5332 | 66 | 66 | 0.74% | 1.24% | 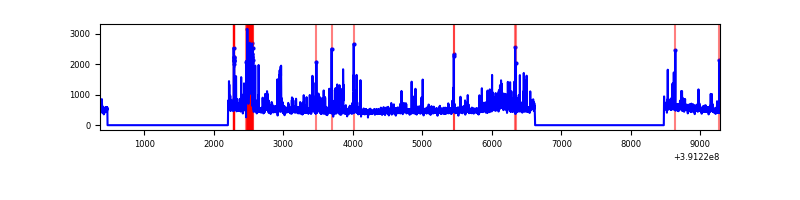 |
| C | 8918 | 5332 | 718 | 718 | 8.05% | 13.47% | 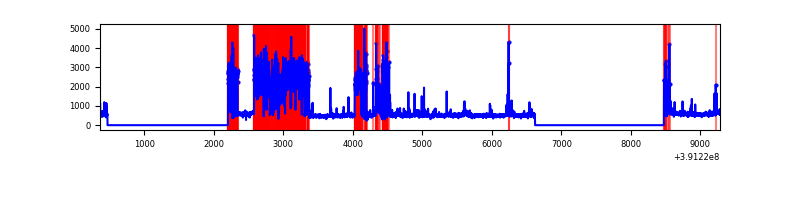 |
| D | 8918 | 5332 | 539 | 539 | 6.04% | 10.11% | 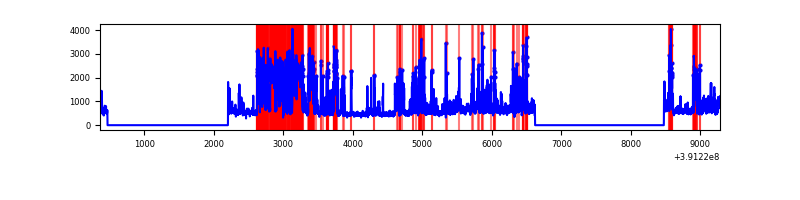 |
Top three noisy pixels from each quadrant. If the there are fewer than three noisy pixels in the level2.evt file, extra rows are filled as -1
| Pixel properties | Quadrant properties | ||||||
|---|---|---|---|---|---|---|---|
| Quadrant | DetID | PixID | Counts | Sigma | Mean | Median | Sigma |
| A | 10 | 83 | 164445 | 1292.66 | 633 | 621 | 126.7 |
| A | 8 | 144 | 8408 | 61.44 | 633 | 621 | 126.7 |
| A | 13 | 254 | 8034 | 58.49 | 633 | 621 | 126.7 |
| B | 4 | 171 | 248842 | 2112.42 | 622 | 606 | 117.5 |
| B | 5 | 172 | 233597 | 1982.69 | 622 | 606 | 117.5 |
| B | 4 | 232 | 88148 | 744.96 | 622 | 606 | 117.5 |
| C | 0 | 207 | 1938410 | 14513.08 | 582 | 586 | 133.5 |
| C | 9 | 187 | 297478 | 2223.53 | 582 | 586 | 133.5 |
| C | 15 | 214 | 210140 | 1569.43 | 582 | 586 | 133.5 |
| D | 1 | 52 | 1486972 | 10313.36 | 585 | 568 | 144.1 |
| D | 12 | 235 | 328535 | 2275.59 | 585 | 568 | 144.1 |
| D | 2 | 250 | 196197 | 1357.36 | 585 | 568 | 144.1 |
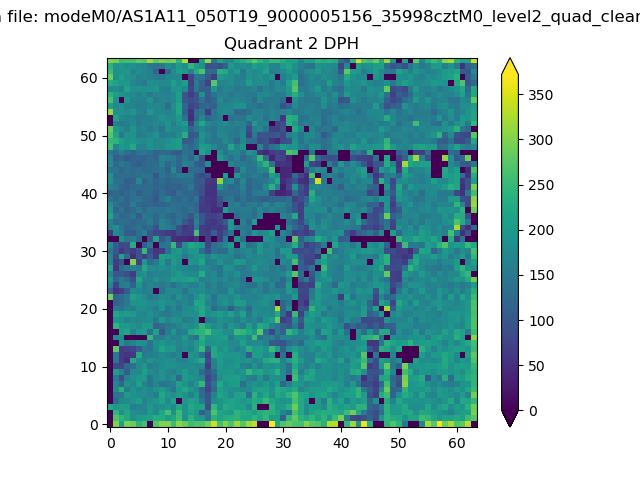
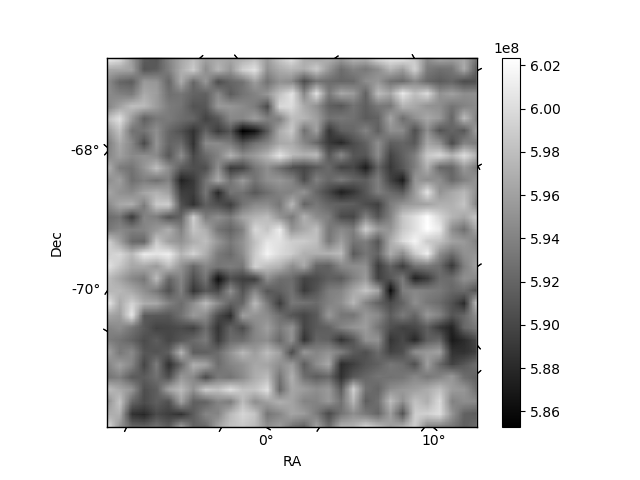
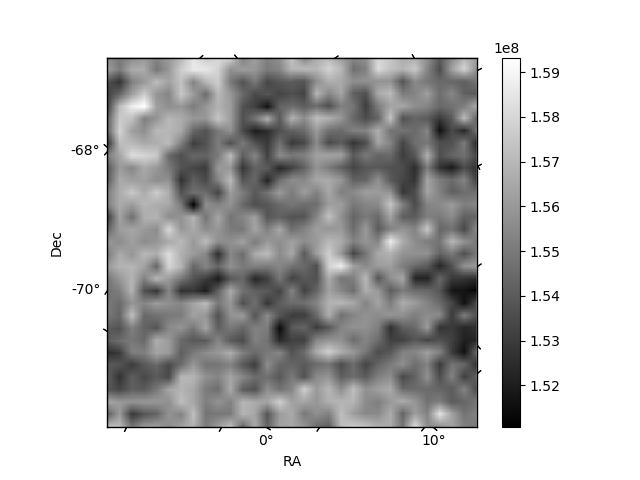
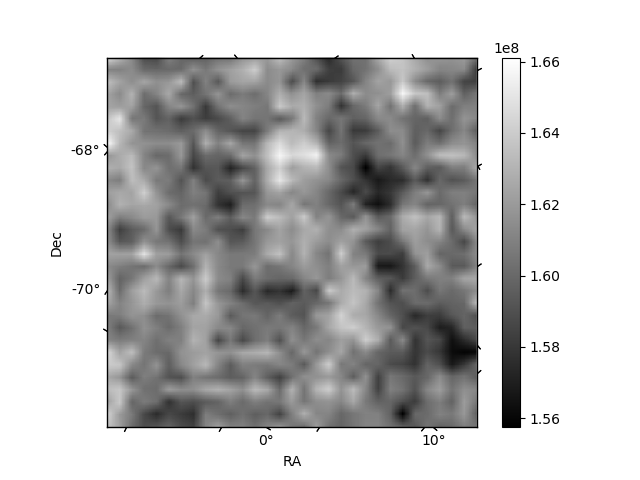
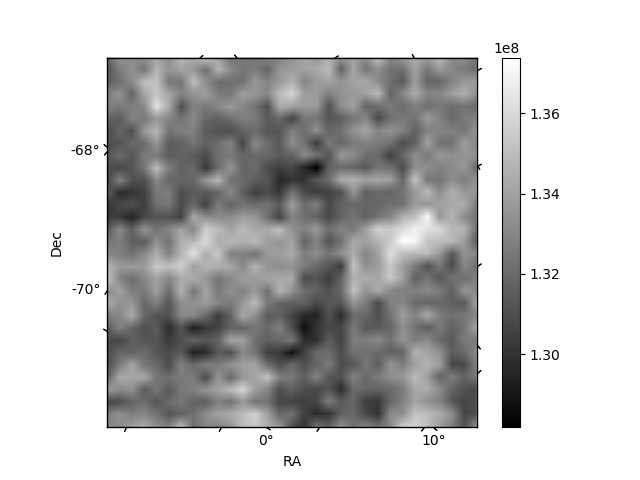
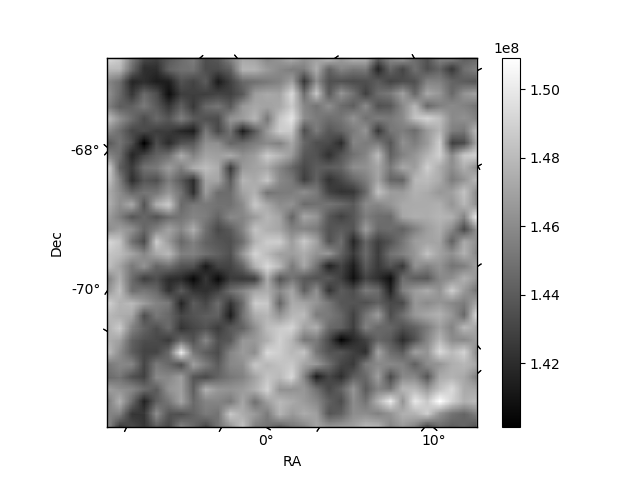
Histogram calculated using DETX and DETY for each event in the final _common_clean file
| Quadrant A | 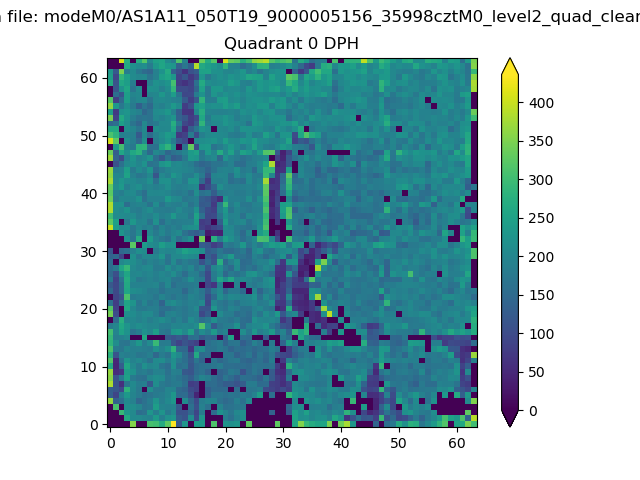 |
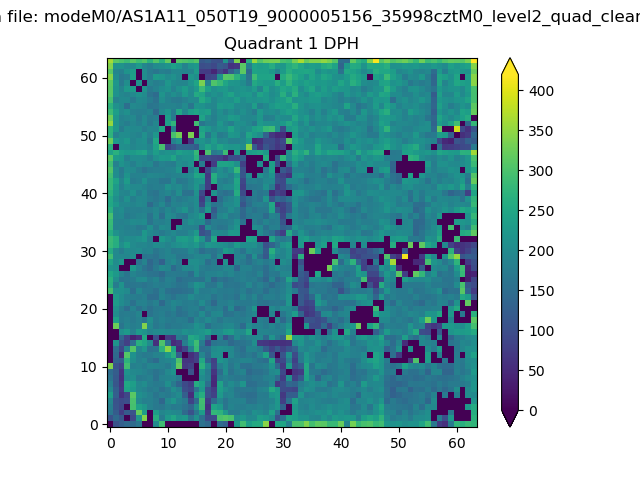 |
Quadrant B |
|---|---|---|---|
| Quadrant D | 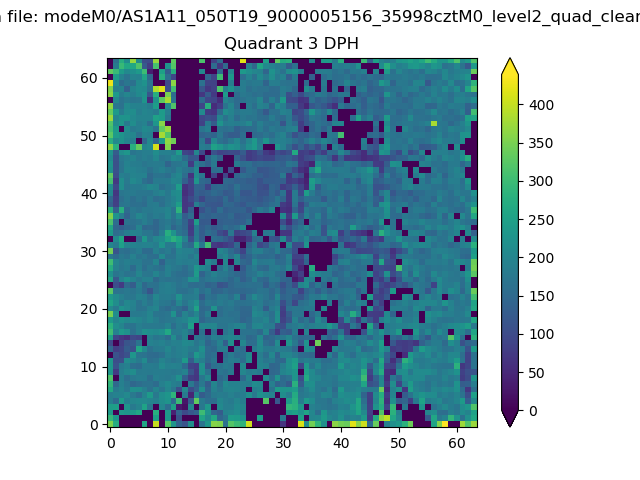 |
 |
Quadrant C |
| Plot type | Count rate plots | Images |
|---|---|---|
| Comparison with Poisson distribution Blue bars denote a histogram of data divided into 1 sec bins. Red curve is a Poisson curve with rate = median count rate of data. |
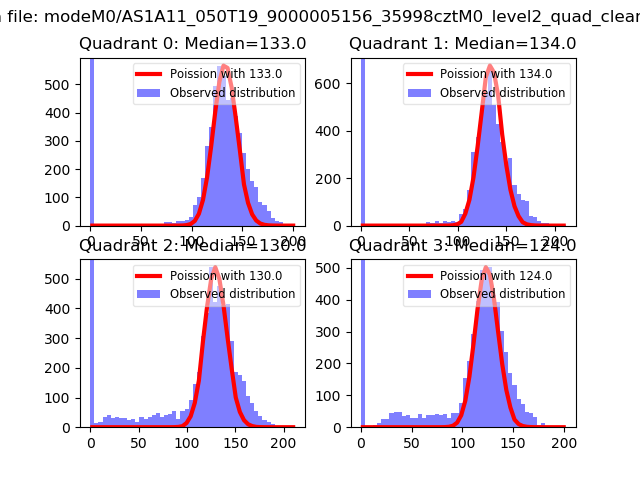 |
 |
| Quadrant-wise count rates Data is divided into 100 sec bins |
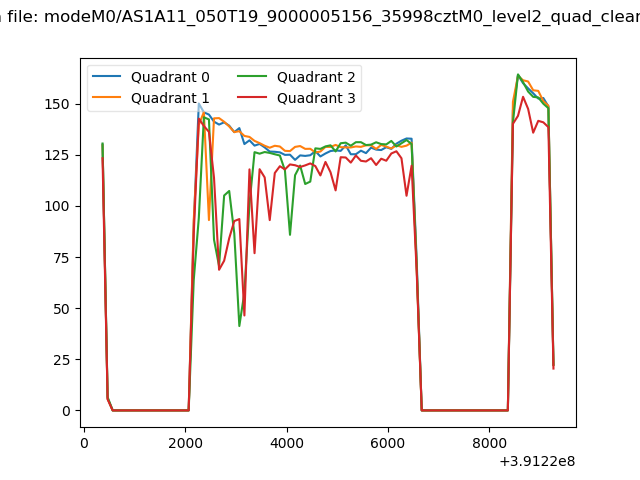 |
|
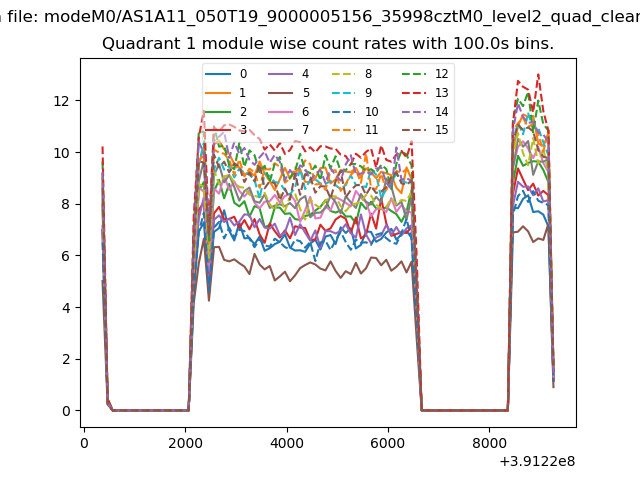
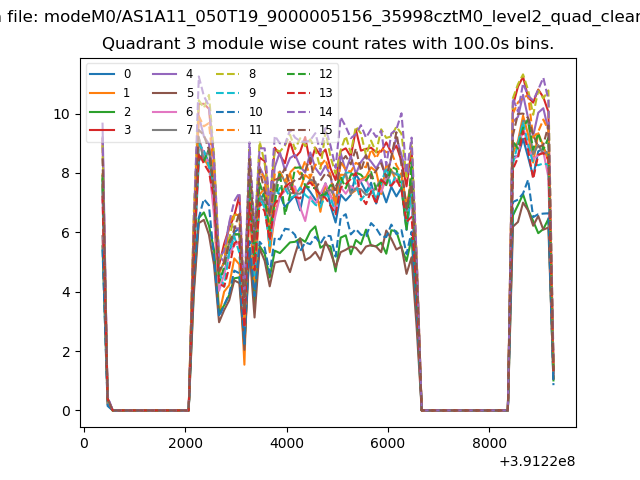
| Module-wise count rates for Quadrant A Data is divided into 100 sec bins |
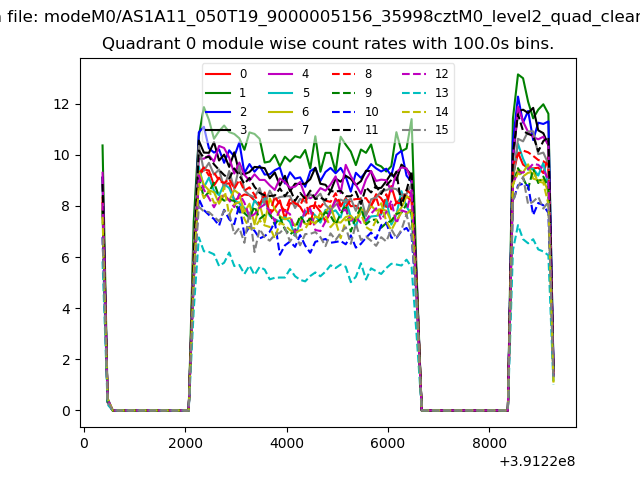 |
 |
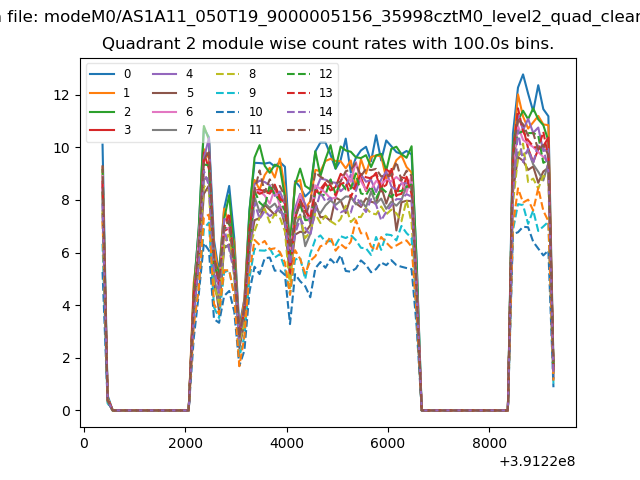
| Module-wise count rates for Quadrant B Data is divided into 100 sec bins |
 |
 |
| Module-wise count rates for Quadrant C Data is divided into 100 sec bins |
 |
 |
| Module-wise count rates for Quadrant D Data is divided into 100 sec bins |
 |
 |
| Parameter | Plot |
|---|---|
| CZT HV Monitor | 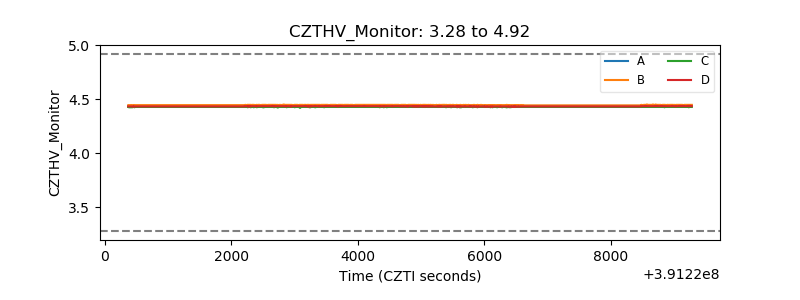 |
| D_VDD | 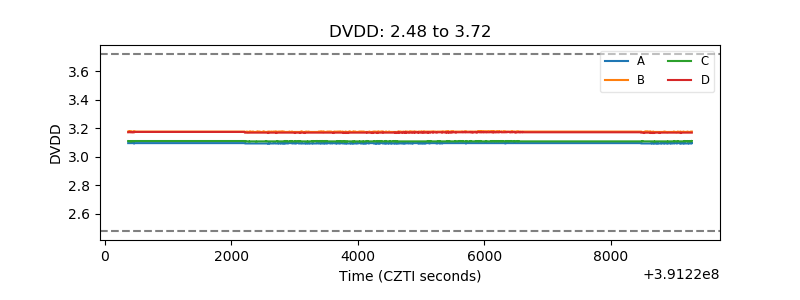 |
| Temperature 1 | 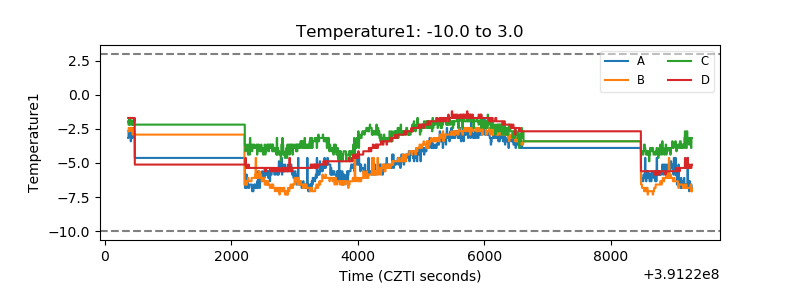 |
| Veto HV Monitor | 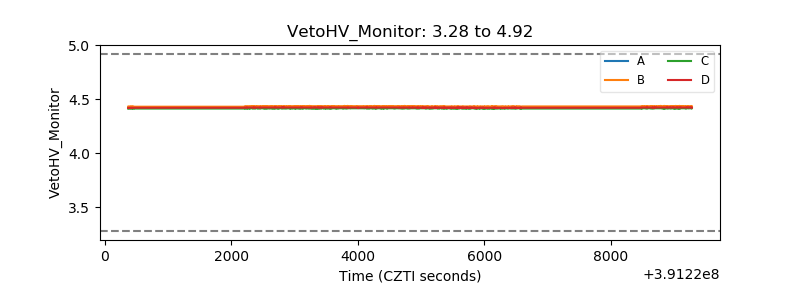 |
| Veto LLD | 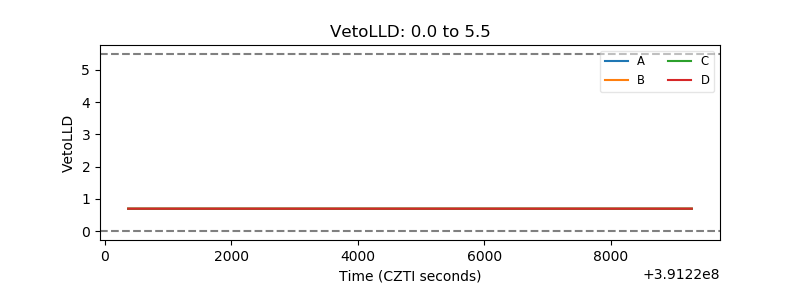 |
| Alpha Counter | 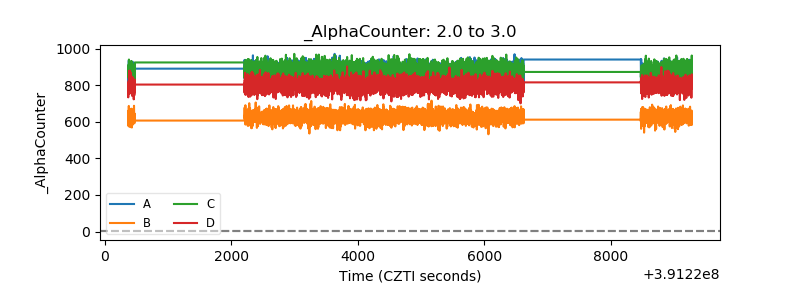 |
| _CPM_Rate | 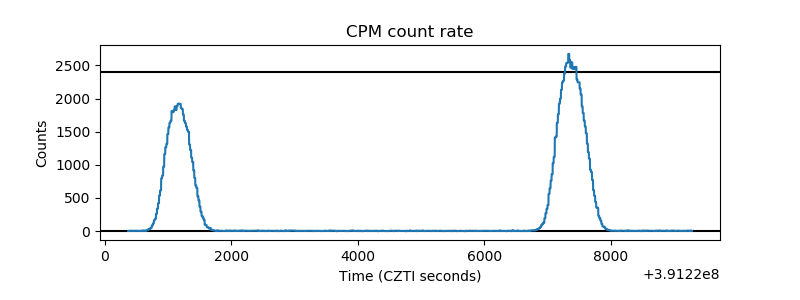 |
| CZT Counter | 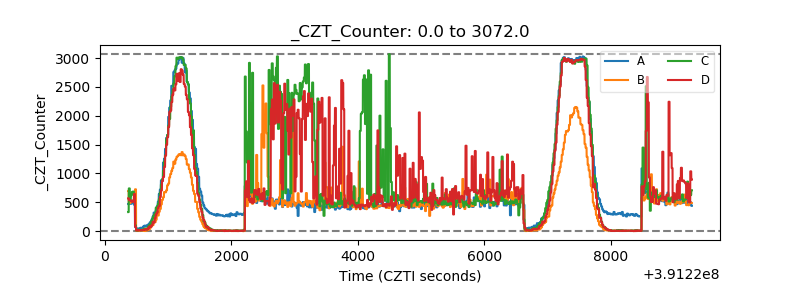 |
| +2.5 Volts monitor | 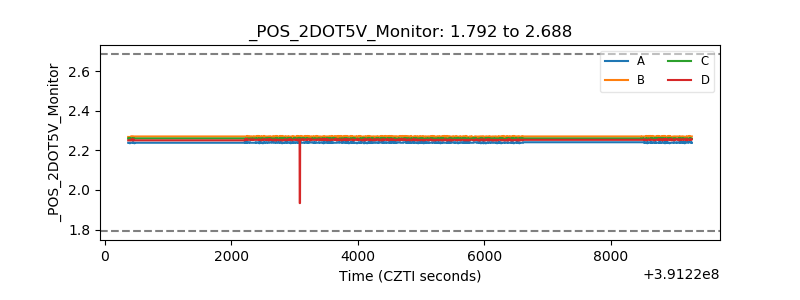 |
| +5 Volts monitor | 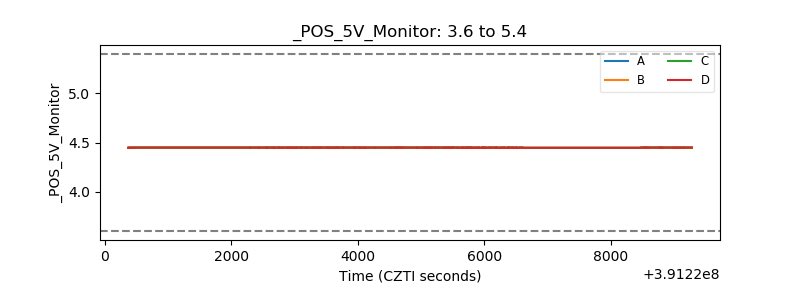 |
| _ROLL_ROT | 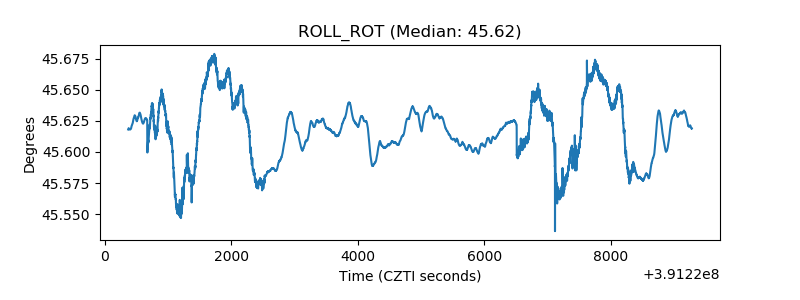 |
| _Roll_DEC | 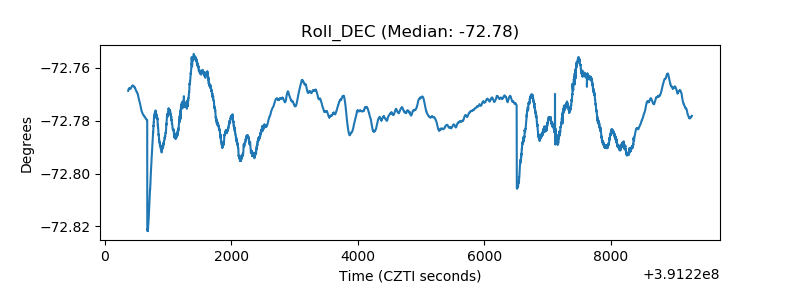 |
| _Roll_RA | 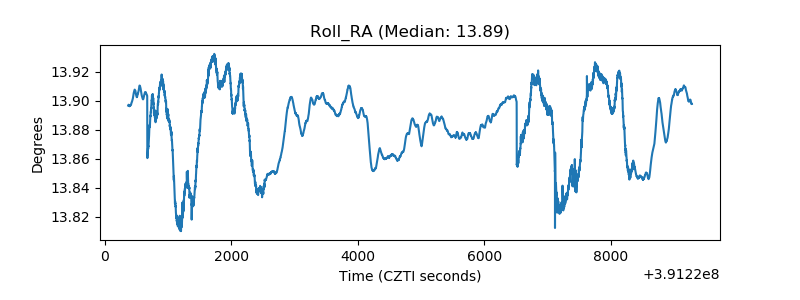 |
| Veto Counter | 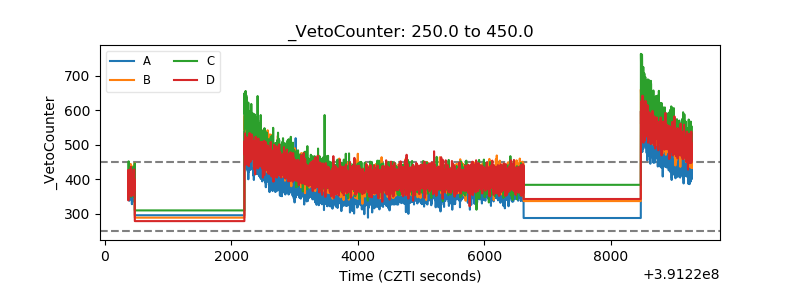 |