| Param | Original file | Final file |
|---|---|---|
| Filename | modeM0/AS1A11_050T19_9000005156_35997cztM0_level2.evt | modeM0/AS1A11_050T19_9000005156_35997cztM0_level2_quad_clean.evt |
| Size (bytes) | 524,070,720 | 98,971,200 |
| Size | 499.8 MB | 94.4 MB |
| Events in quadrant A | 2,587,532 | 694,906 |
| Events in quadrant B | 3,110,393 | 691,418 |
| Events in quadrant C | 4,207,771 | 647,045 |
| Events in quadrant D | 5,597,826 | 583,588 |
| Mode M0 | |||
|---|---|---|---|
| Quadrant | BADHDUFLAG | Total packets | Discarded packets |
| A | 0 | 11214 | 3 |
| B | 0 | 12770 | 2 |
| C | 0 | 15848 | 2 |
| D | 0 | 20298 | 2 |
| Mode SS | |||
|---|---|---|---|
| Quadrant | BADHDUFLAG | Total packets | Discarded packets |
| A | 0 | 110 | 0 |
| B | 0 | 110 | 0 |
| C | 0 | 110 | 0 |
| D | 0 | 110 | 0 |
| Mode M9 | |||
|---|---|---|---|
| Quadrant | BADHDUFLAG | Total packets | Discarded packets |
| A | 0 | 32 | 0 |
| B | 0 | 32 | 0 |
| C | 0 | 32 | 0 |
| D | 0 | 32 | 0 |
| Quadrant | Total seconds | Saturated seconds | Saturation percentage |
|---|---|---|---|
| A | 5424 | 6 | 0.110619% |
| B | 5424 | 138 | 2.544248% |
| C | 5424 | 556 | 10.250737% |
| D | 5424 | 1059 | 19.524336% |
Noise dominated data is calculated using 1-second bins in cleaned event files. If a bin has >2000 counts, and if more than 50% of those come from <1% of pixels, then it is considered to be noise-dominated and hence unusable.
| Quadrant | # 1 sec bins | Bins with >0 counts | Bins with >2000 counts | High rate bins dominated by noise | Noise dominated (total time) | Noise dominated (detector-on time) | Marked lightcurve |
|---|---|---|---|---|---|---|---|
| A | 7159 | 5426 | 0 | 0 | 0.00% | 0.00% | 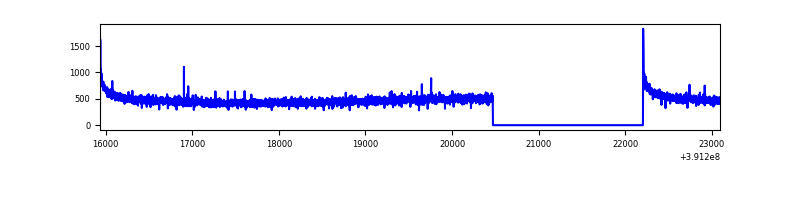 |
| B | 7159 | 5426 | 85 | 85 | 1.19% | 1.57% | 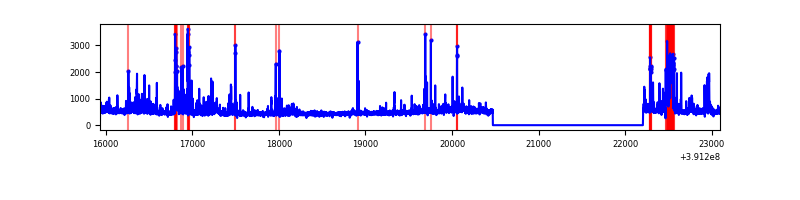 |
| C | 7158 | 5425 | 471 | 471 | 6.58% | 8.68% | 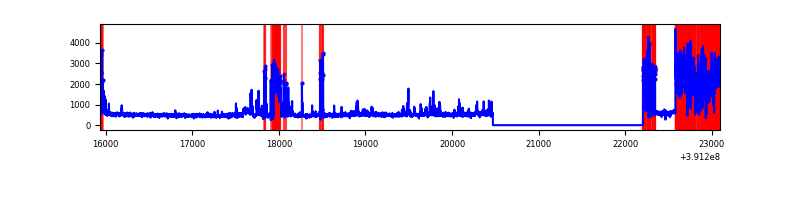 |
| D | 7159 | 5426 | 777 | 777 | 10.85% | 14.32% | 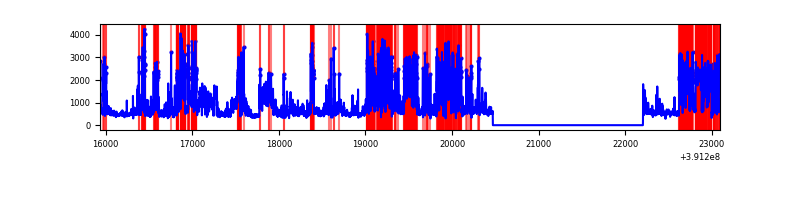 |
Top three noisy pixels from each quadrant. If the there are fewer than three noisy pixels in the level2.evt file, extra rows are filled as -1
| Pixel properties | Quadrant properties | ||||||
|---|---|---|---|---|---|---|---|
| Quadrant | DetID | PixID | Counts | Sigma | Mean | Median | Sigma |
| A | 10 | 83 | 161864 | 1280.09 | 624 | 611 | 126.0 |
| A | 13 | 254 | 8976 | 66.4 | 624 | 611 | 126.0 |
| A | 13 | 6 | 7375 | 53.7 | 624 | 611 | 126.0 |
| B | 4 | 171 | 310906 | 2657.18 | 614 | 598 | 116.8 |
| B | 5 | 172 | 243278 | 2078.08 | 614 | 598 | 116.8 |
| B | 5 | 255 | 51053 | 432.05 | 614 | 598 | 116.8 |
| C | 0 | 207 | 1121122 | 8234.24 | 585 | 587 | 136.1 |
| C | 9 | 187 | 375451 | 2754.69 | 585 | 587 | 136.1 |
| C | 15 | 214 | 216693 | 1588.05 | 585 | 587 | 136.1 |
| D | 1 | 52 | 2321423 | 16877.39 | 555 | 537 | 137.5 |
| D | 12 | 235 | 479055 | 3479.76 | 555 | 537 | 137.5 |
| D | 8 | 230 | 182744 | 1325.0 | 555 | 537 | 137.5 |
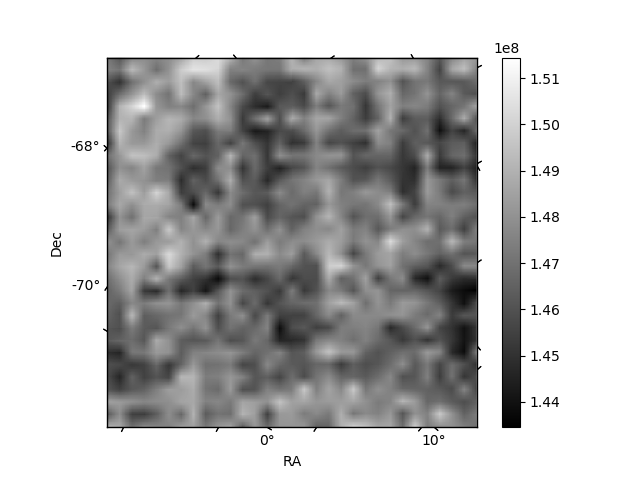
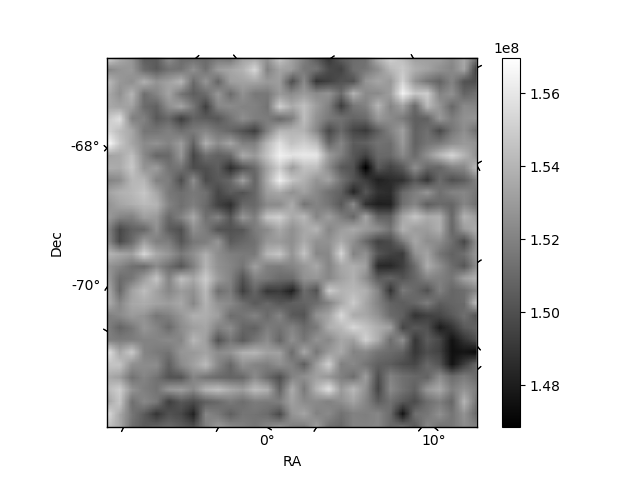
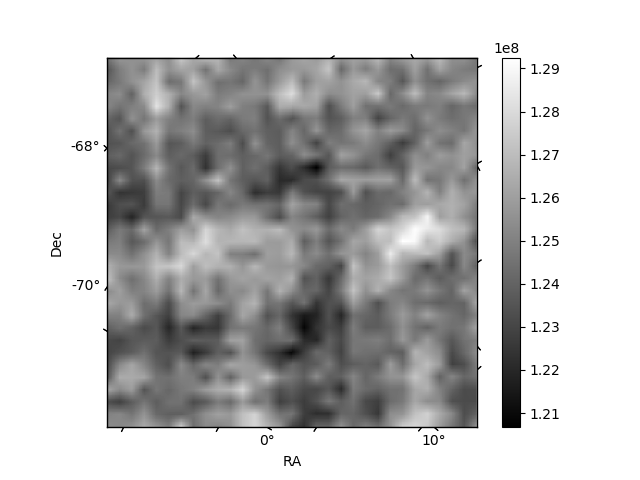
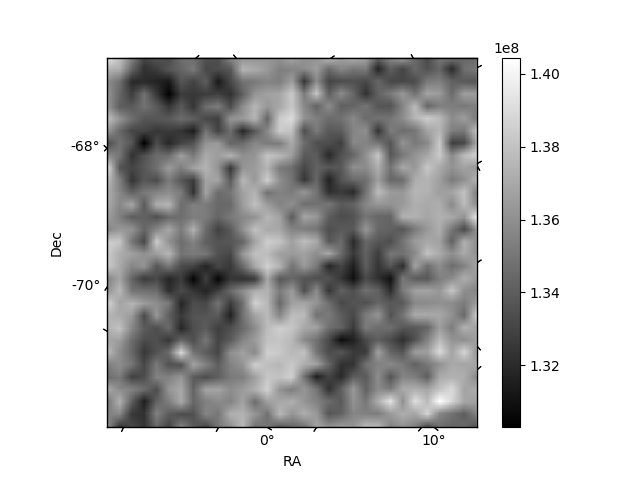
Histogram calculated using DETX and DETY for each event in the final _common_clean file
| Quadrant A | 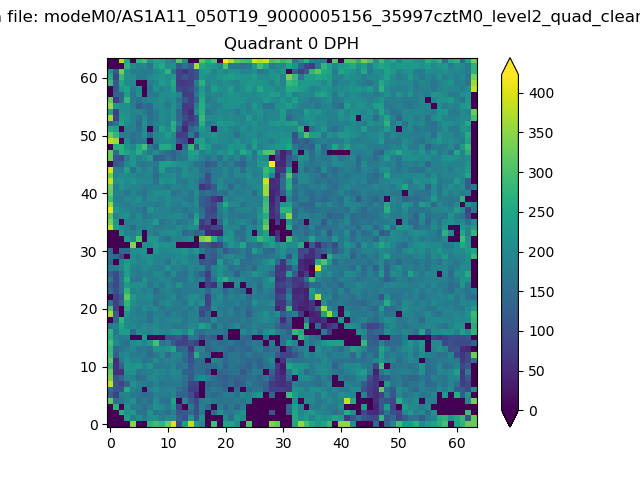 |
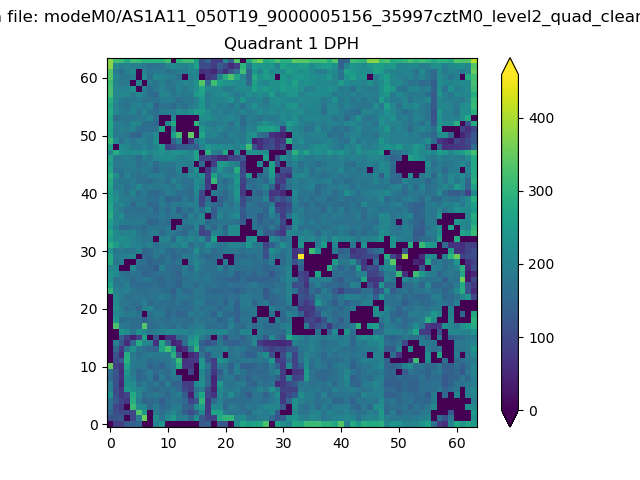 |
Quadrant B |
|---|---|---|---|
| Quadrant D | 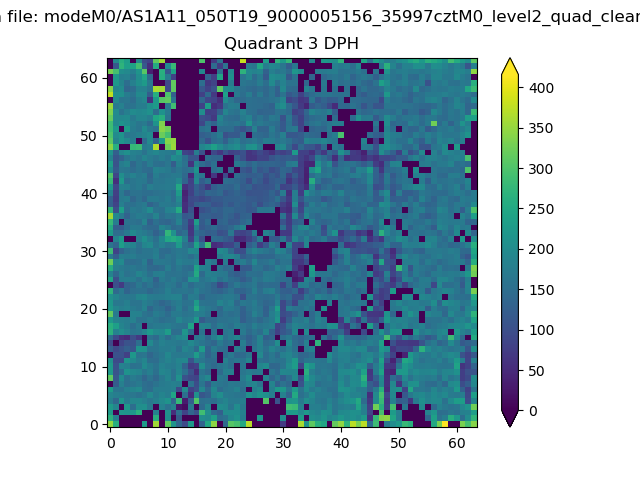 |
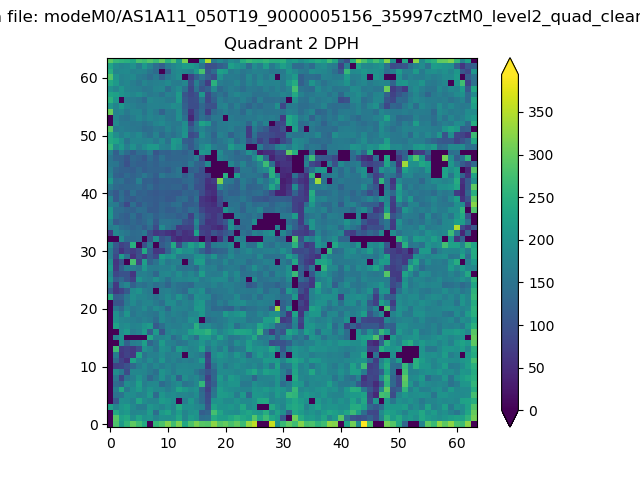 |
Quadrant C |
| Plot type | Count rate plots | Images |
|---|---|---|
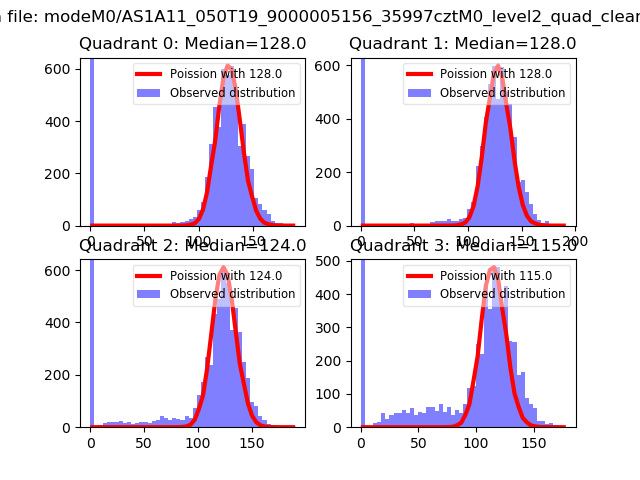
| Comparison with Poisson distribution Blue bars denote a histogram of data divided into 1 sec bins. Red curve is a Poisson curve with rate = median count rate of data. |
 |
 |
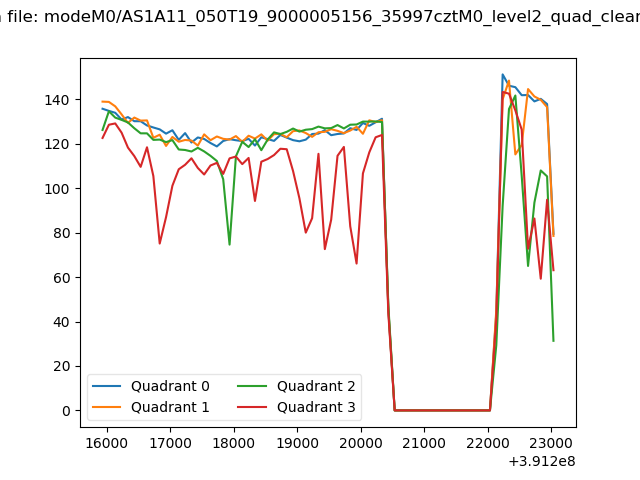
| Quadrant-wise count rates Data is divided into 100 sec bins |
 |
|
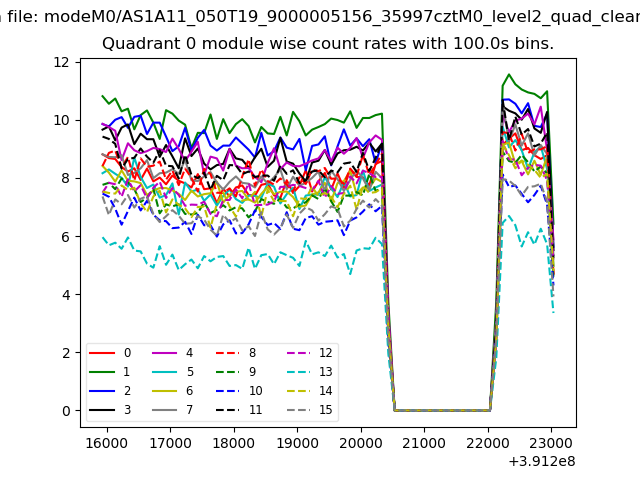
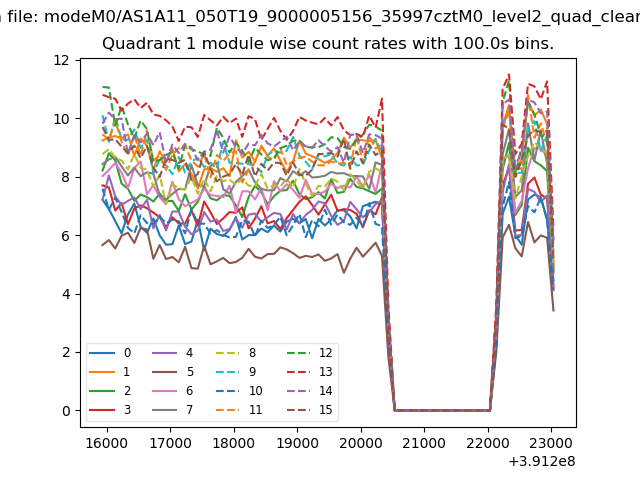
| Module-wise count rates for Quadrant A Data is divided into 100 sec bins |
 |
 |
| Module-wise count rates for Quadrant B Data is divided into 100 sec bins |
 |
 |
| Module-wise count rates for Quadrant C Data is divided into 100 sec bins |
 |
 |
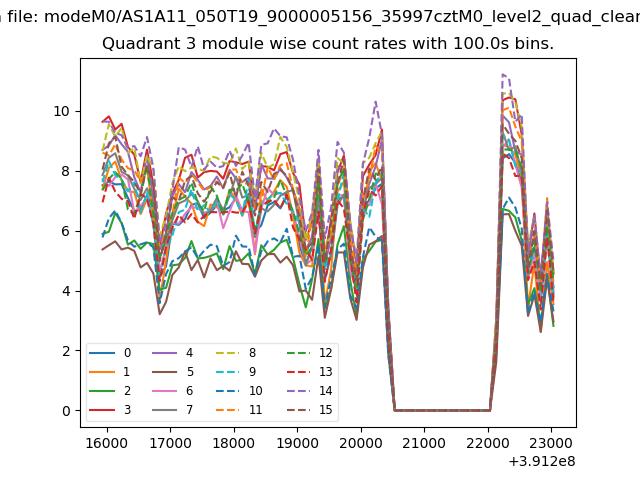
| Module-wise count rates for Quadrant D Data is divided into 100 sec bins |
 |
 |
| Parameter | Plot |
|---|---|
| CZT HV Monitor | 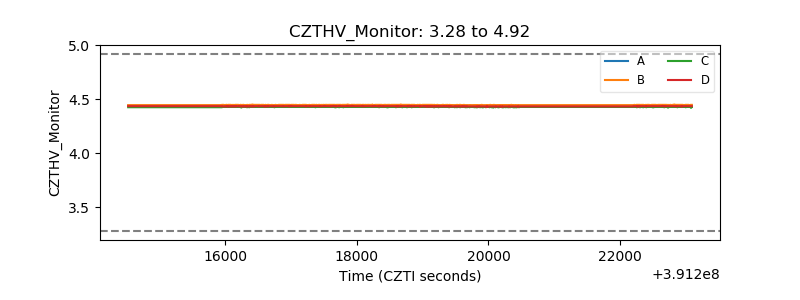 |
| D_VDD | 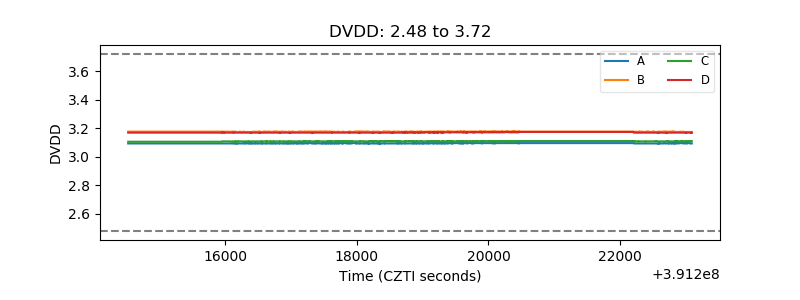 |
| Temperature 1 | 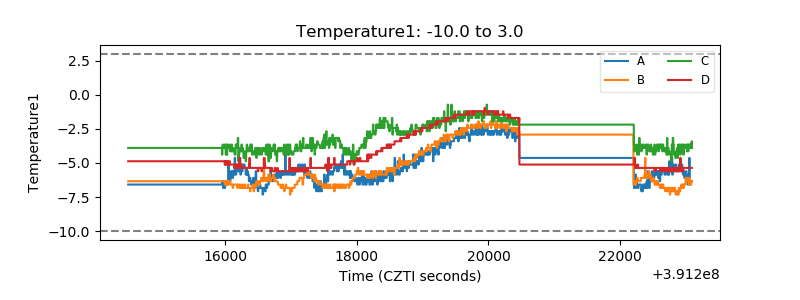 |
| Veto HV Monitor | 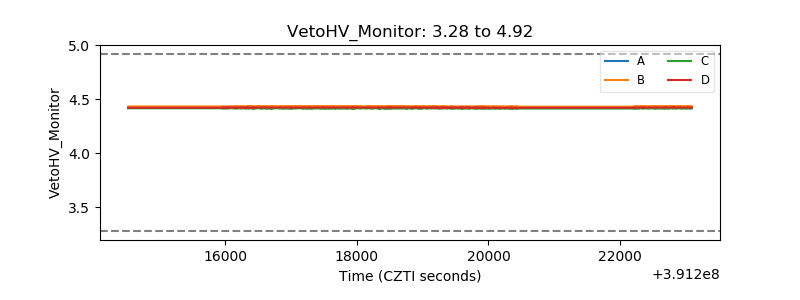 |
| Veto LLD | 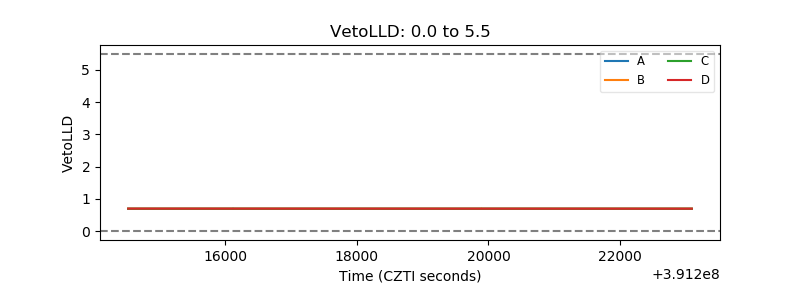 |
| Alpha Counter | 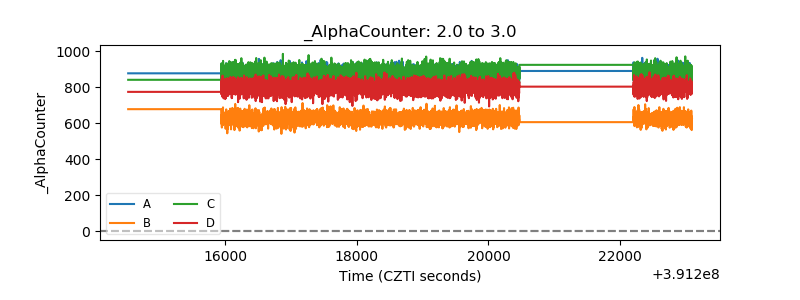 |
| _CPM_Rate | 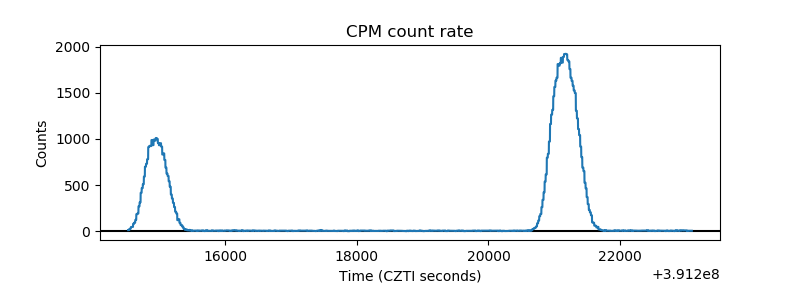 |
| CZT Counter | 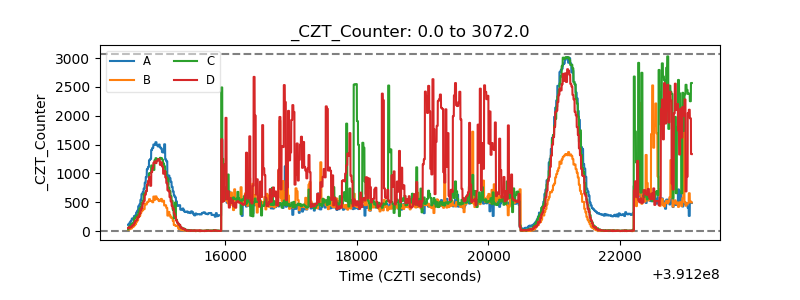 |
| +2.5 Volts monitor | 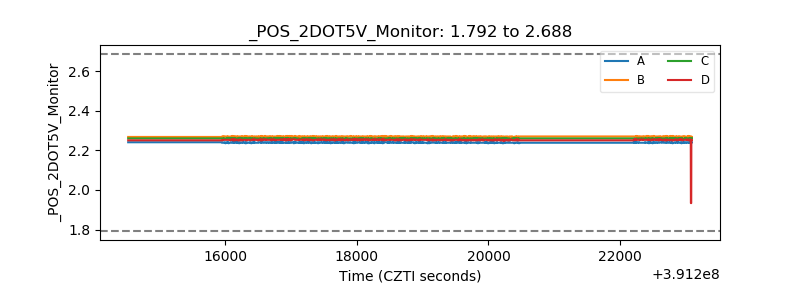 |
| +5 Volts monitor | 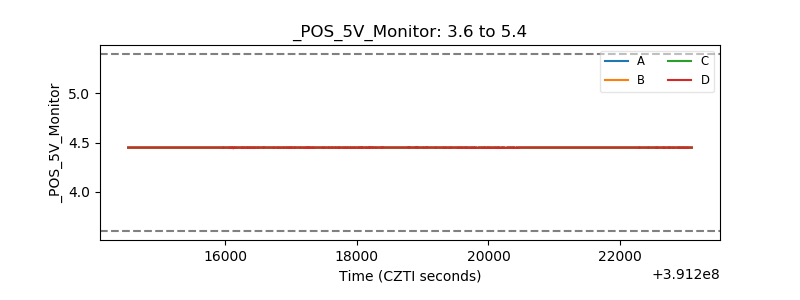 |
| _ROLL_ROT | 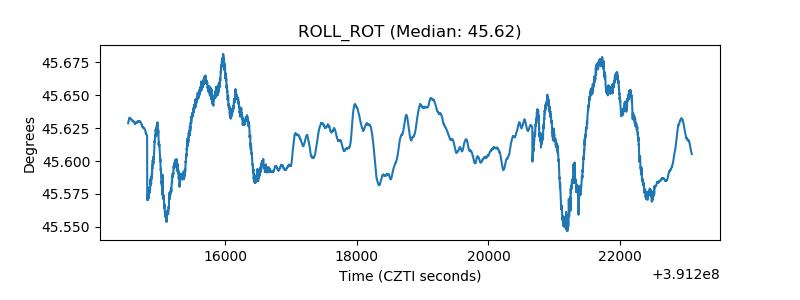 |
| _Roll_DEC | 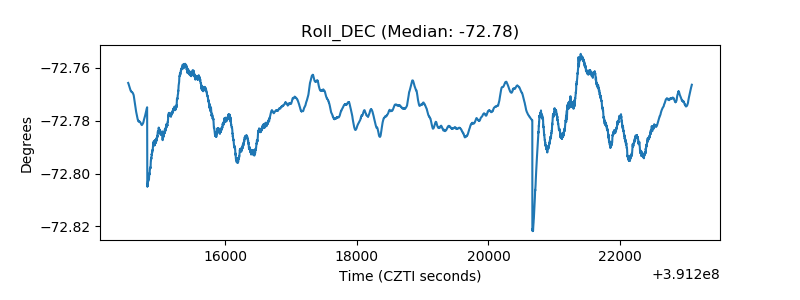 |
| _Roll_RA | 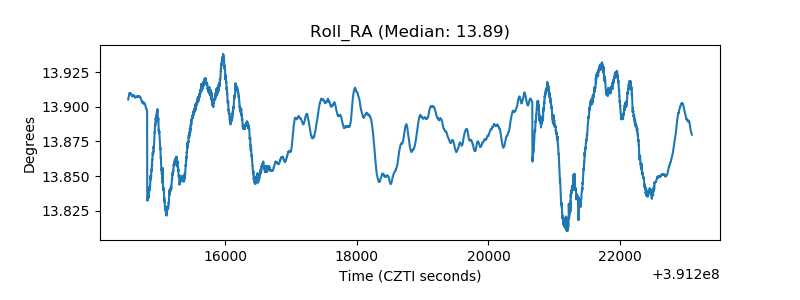 |
| Veto Counter | 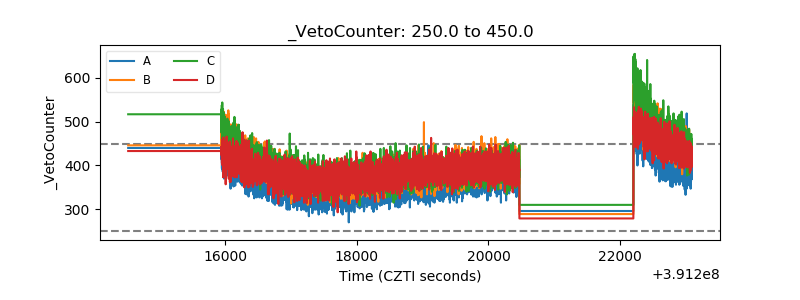 |