| Param | Original file | Final file |
|---|---|---|
| Filename | modeM0/AS1A11_050T19_9000005156_35995cztM0_level2.evt | modeM0/AS1A11_050T19_9000005156_35995cztM0_level2_quad_clean.evt |
| Size (bytes) | 490,999,680 | 102,242,880 |
| Size | 468.3 MB | 97.5 MB |
| Events in quadrant A | 2,634,455 | 699,057 |
| Events in quadrant B | 3,074,859 | 699,037 |
| Events in quadrant C | 3,070,482 | 683,466 |
| Events in quadrant D | 5,709,210 | 621,893 |
| Mode M0 | |||
|---|---|---|---|
| Quadrant | BADHDUFLAG | Total packets | Discarded packets |
| A | 0 | 11543 | 3 |
| B | 0 | 12797 | 2 |
| C | 0 | 12419 | 2 |
| D | 0 | 20855 | 2 |
| Mode SS | |||
|---|---|---|---|
| Quadrant | BADHDUFLAG | Total packets | Discarded packets |
| A | 0 | 114 | 0 |
| B | 0 | 114 | 0 |
| C | 0 | 114 | 0 |
| D | 0 | 114 | 0 |
| Mode M9 | |||
|---|---|---|---|
| Quadrant | BADHDUFLAG | Total packets | Discarded packets |
| A | 0 | 28 | 0 |
| B | 0 | 28 | 0 |
| C | 0 | 28 | 0 |
| D | 0 | 29 | 0 |
| Quadrant | Total seconds | Saturated seconds | Saturation percentage |
|---|---|---|---|
| A | 5618 | 8 | 0.142399% |
| B | 5618 | 82 | 1.459594% |
| C | 5618 | 79 | 1.406194% |
| D | 5618 | 614 | 10.929156% |
Noise dominated data is calculated using 1-second bins in cleaned event files. If a bin has >2000 counts, and if more than 50% of those come from <1% of pixels, then it is considered to be noise-dominated and hence unusable.
| Quadrant | # 1 sec bins | Bins with >0 counts | Bins with >2000 counts | High rate bins dominated by noise | Noise dominated (total time) | Noise dominated (detector-on time) | Marked lightcurve |
|---|---|---|---|---|---|---|---|
| A | 7201 | 5619 | 0 | 0 | 0.00% | 0.00% | 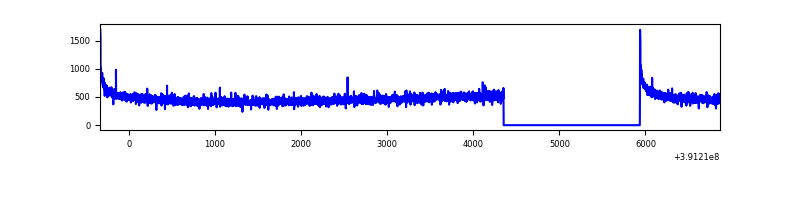 |
| B | 7201 | 5619 | 47 | 47 | 0.65% | 0.84% | 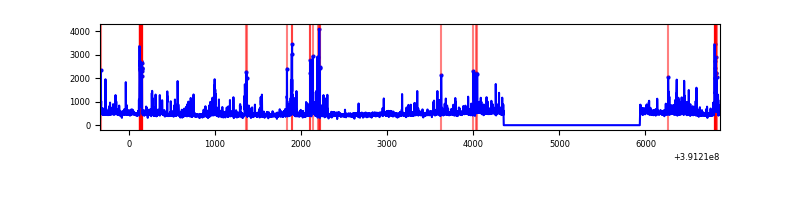 |
| C | 7201 | 5619 | 50 | 50 | 0.69% | 0.89% | 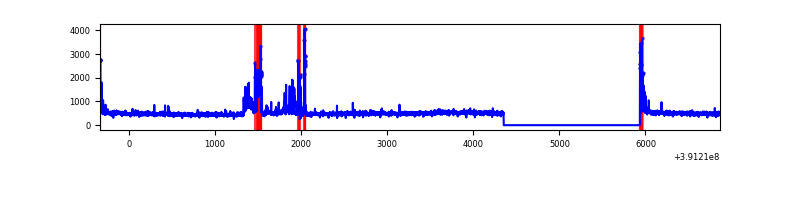 |
| D | 7201 | 5618 | 484 | 484 | 6.72% | 8.62% | 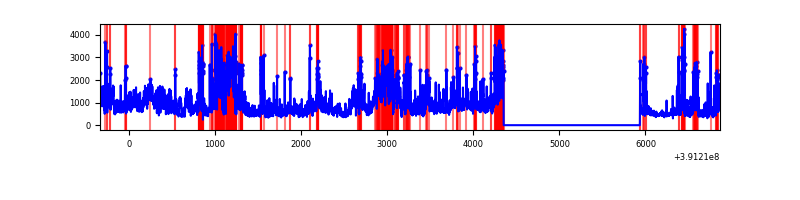 |
Top three noisy pixels from each quadrant. If the there are fewer than three noisy pixels in the level2.evt file, extra rows are filled as -1
| Pixel properties | Quadrant properties | ||||||
|---|---|---|---|---|---|---|---|
| Quadrant | DetID | PixID | Counts | Sigma | Mean | Median | Sigma |
| A | 10 | 83 | 165372 | 1282.71 | 636 | 622 | 128.4 |
| A | 13 | 6 | 9285 | 67.45 | 636 | 622 | 128.4 |
| A | 13 | 254 | 8246 | 59.36 | 636 | 622 | 128.4 |
| B | 5 | 255 | 232000 | 1902.02 | 630 | 614 | 121.7 |
| B | 5 | 172 | 209126 | 1713.99 | 630 | 614 | 121.7 |
| B | 4 | 171 | 55833 | 453.91 | 630 | 614 | 121.7 |
| C | 9 | 187 | 315898 | 2178.66 | 620 | 624 | 144.7 |
| C | 15 | 214 | 234527 | 1616.36 | 620 | 624 | 144.7 |
| C | 0 | 10 | 81227 | 557.0 | 620 | 624 | 144.7 |
| D | 1 | 52 | 1314856 | 9112.63 | 596 | 581 | 144.2 |
| D | 12 | 235 | 1122950 | 7782.04 | 596 | 581 | 144.2 |
| D | 12 | 227 | 689246 | 4774.91 | 596 | 581 | 144.2 |
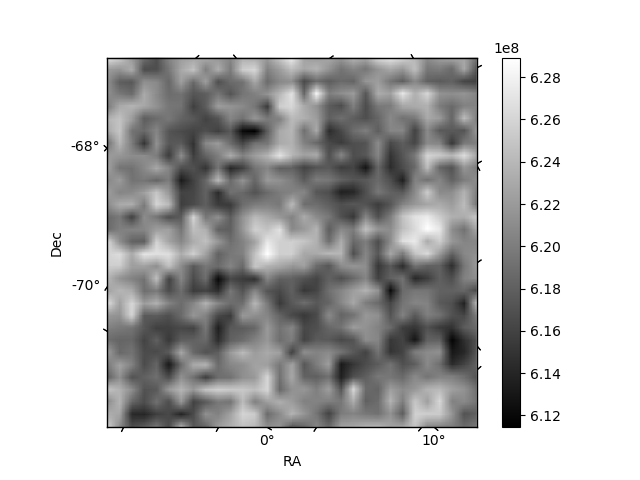
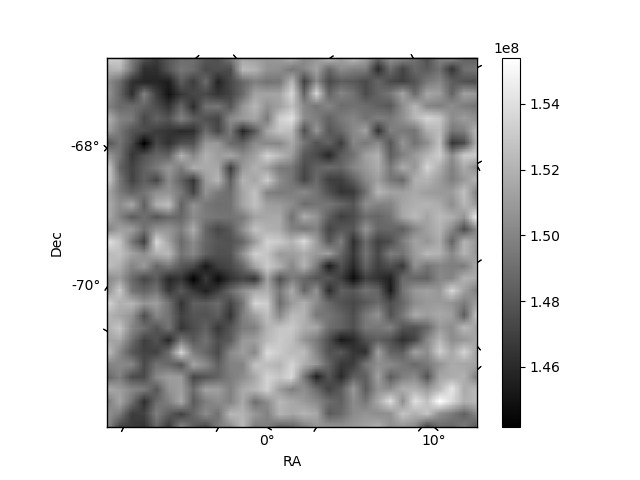
Histogram calculated using DETX and DETY for each event in the final _common_clean file
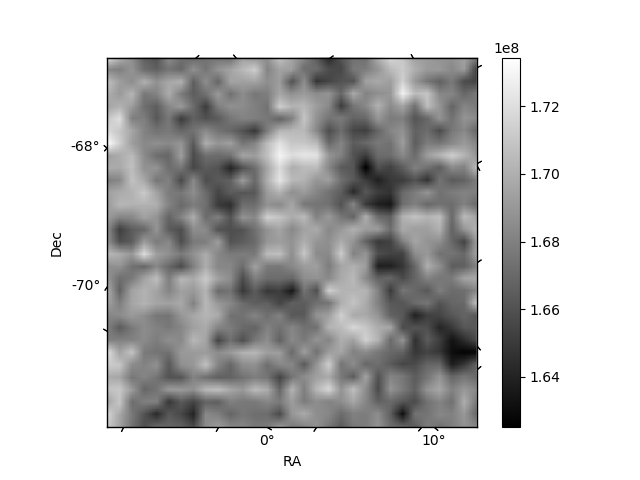
| Quadrant A | 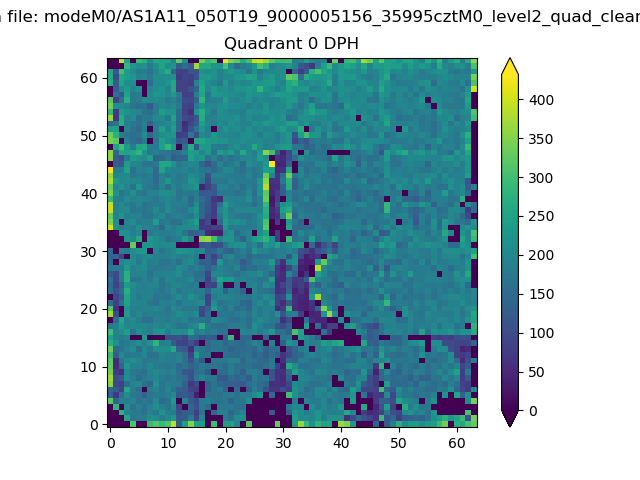 |
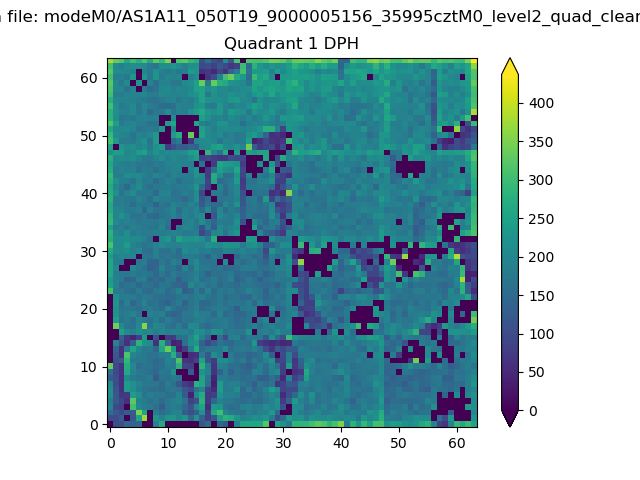 |
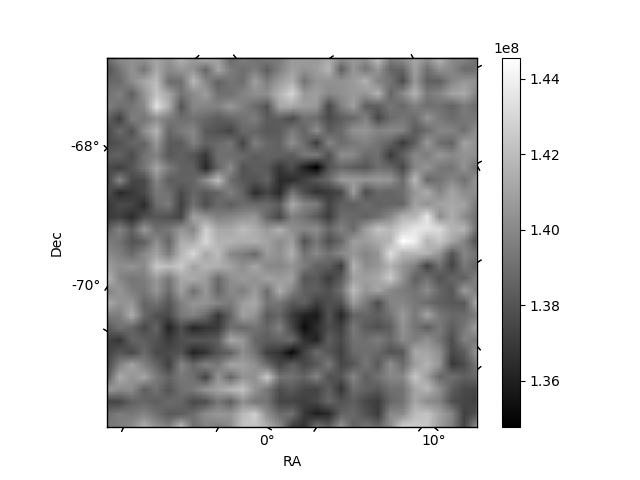
Quadrant B |
|---|---|---|---|
| Quadrant D | 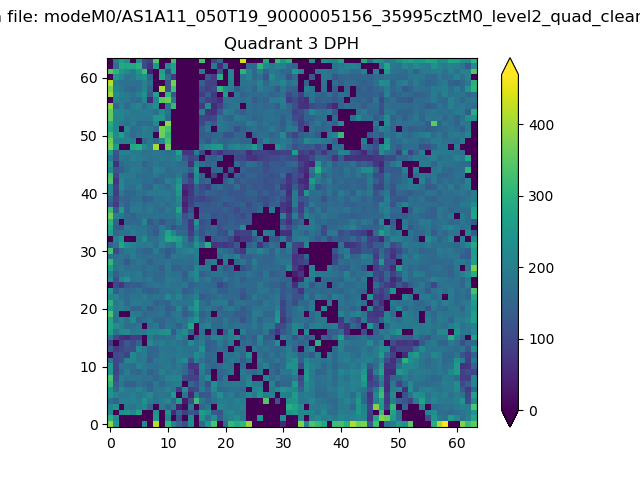 |
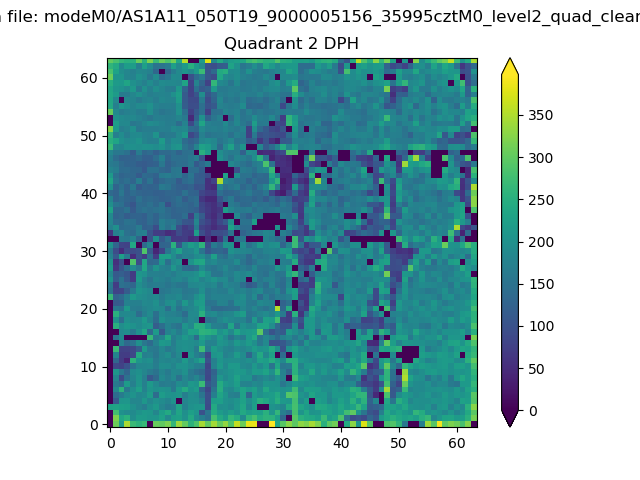 |
Quadrant C |
| Plot type | Count rate plots | Images |
|---|---|---|
| Comparison with Poisson distribution Blue bars denote a histogram of data divided into 1 sec bins. Red curve is a Poisson curve with rate = median count rate of data. |
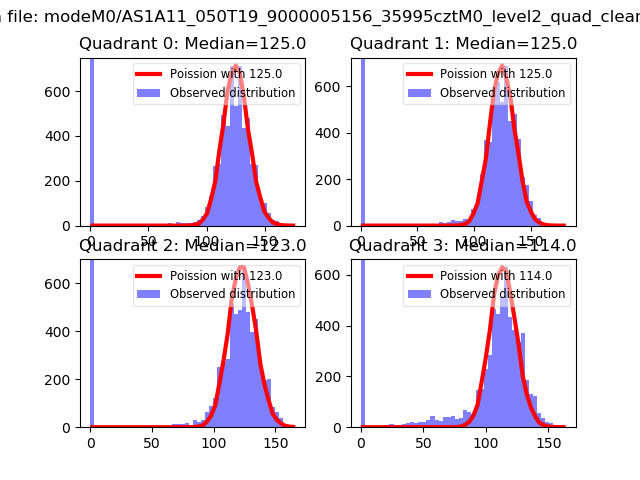 |
 |
| Quadrant-wise count rates Data is divided into 100 sec bins |
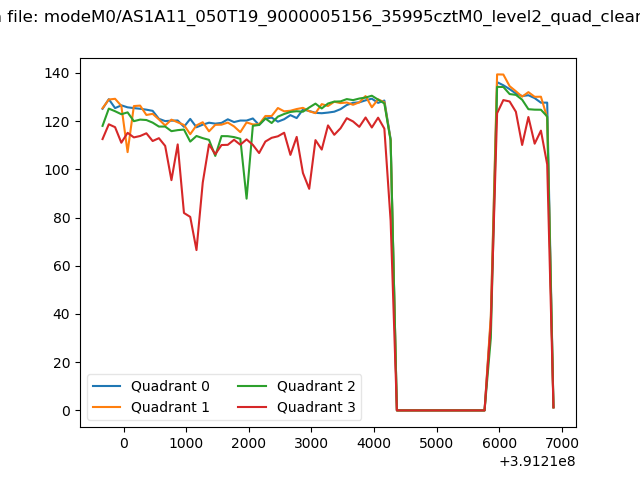 |
|
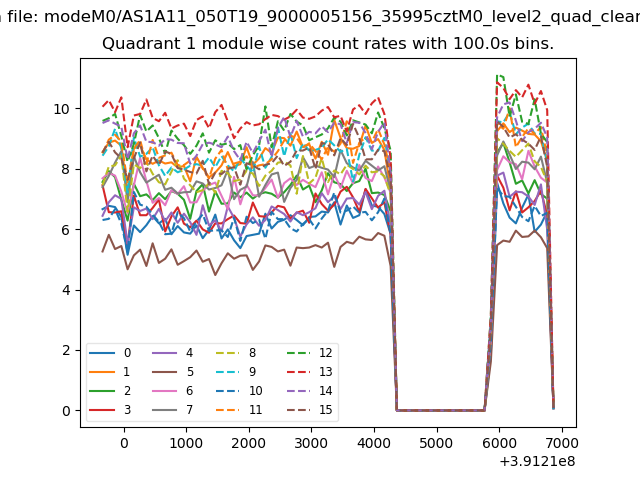
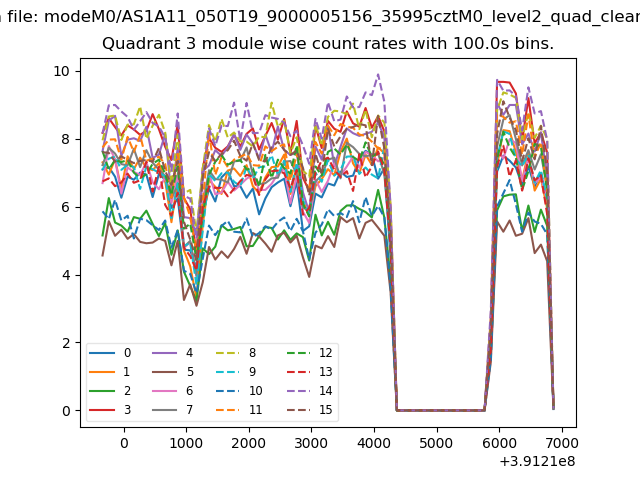
| Module-wise count rates for Quadrant A Data is divided into 100 sec bins |
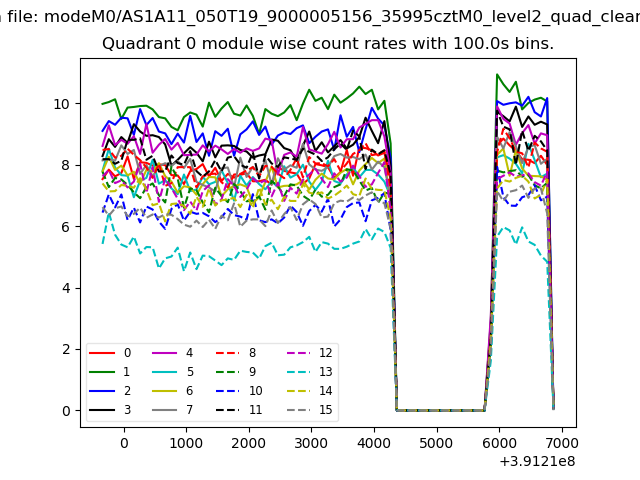 |
 |
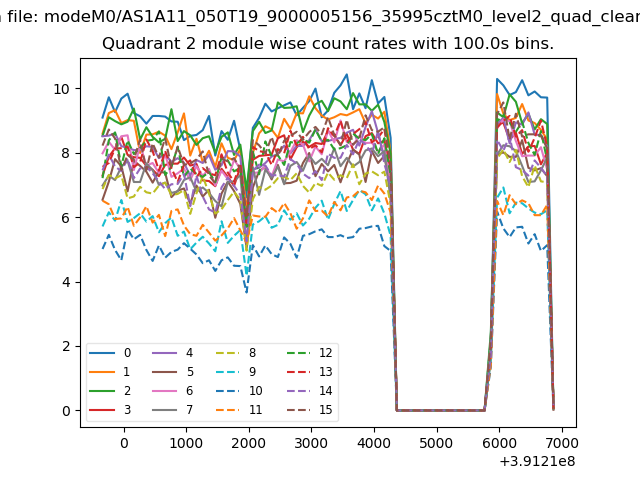
| Module-wise count rates for Quadrant B Data is divided into 100 sec bins |
 |
 |
| Module-wise count rates for Quadrant C Data is divided into 100 sec bins |
 |
 |
| Module-wise count rates for Quadrant D Data is divided into 100 sec bins |
 |
 |
| Parameter | Plot |
|---|---|
| CZT HV Monitor | 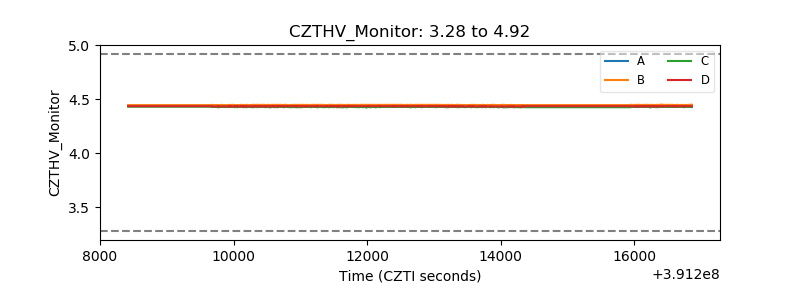 |
| D_VDD | 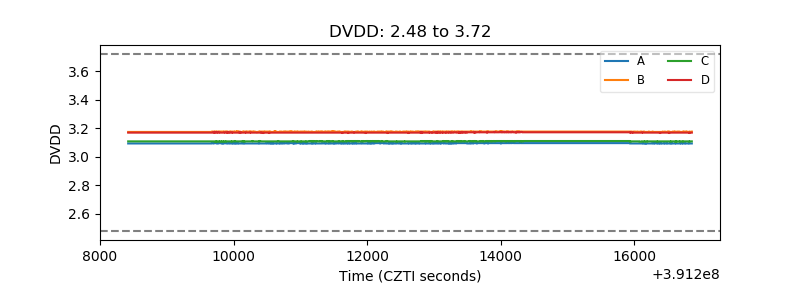 |
| Temperature 1 | 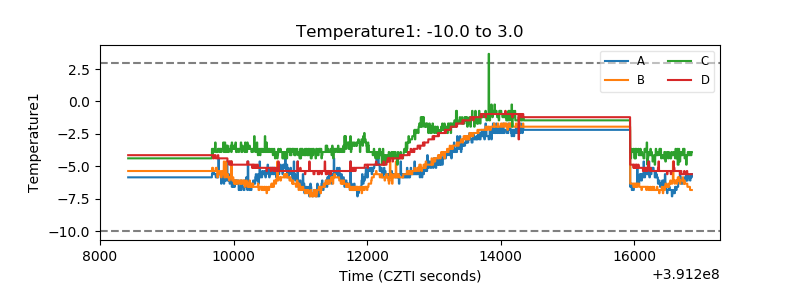 |
| Veto HV Monitor | 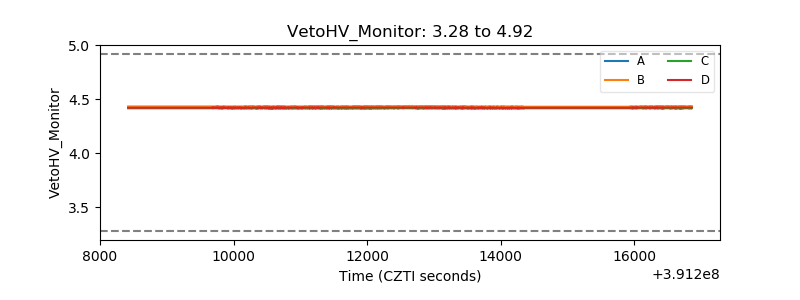 |
| Veto LLD | 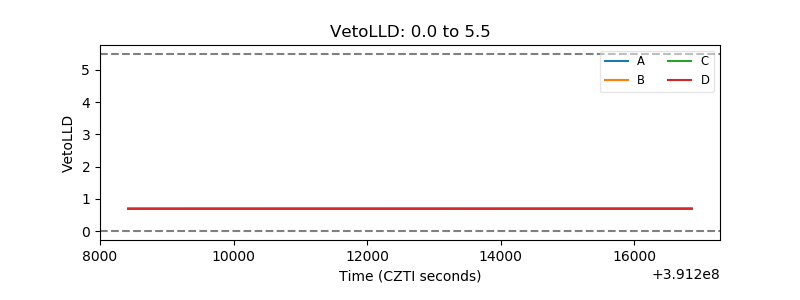 |
| Alpha Counter | 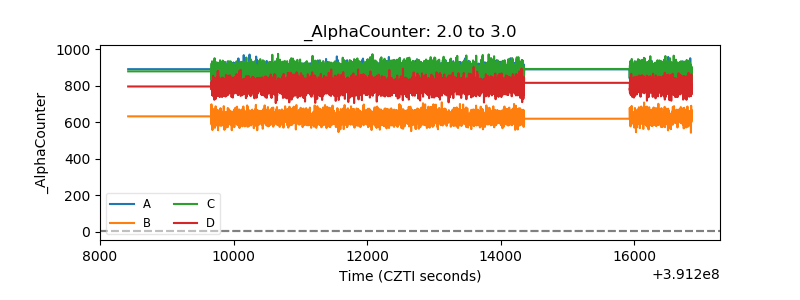 |
| _CPM_Rate | 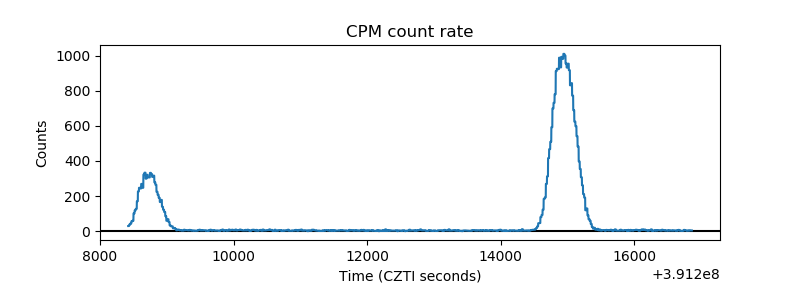 |
| CZT Counter | 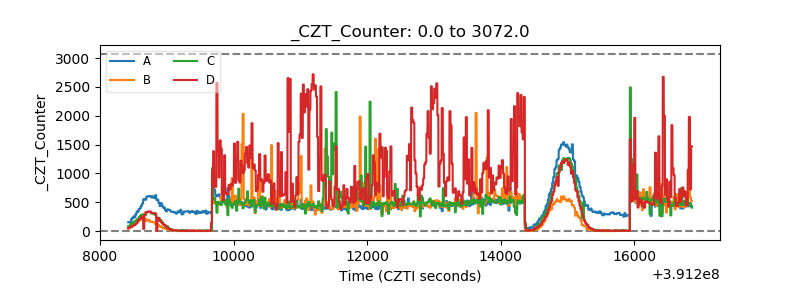 |
| +2.5 Volts monitor | 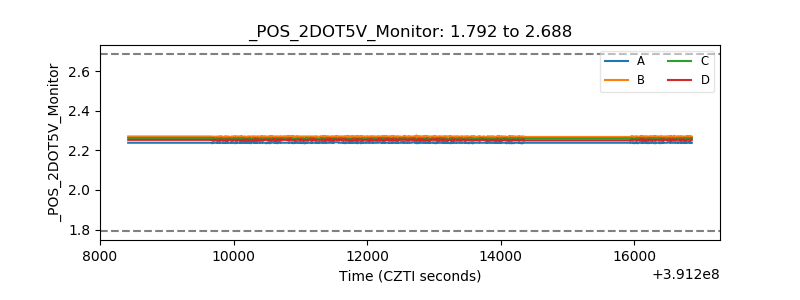 |
| +5 Volts monitor | 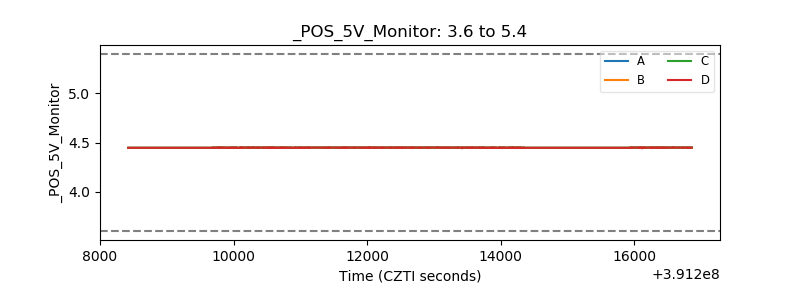 |
| _ROLL_ROT | 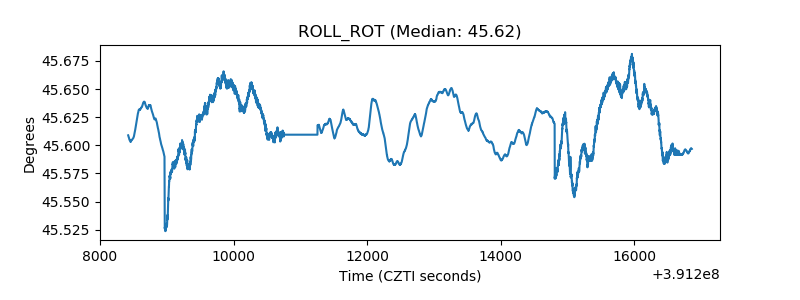 |
| _Roll_DEC | 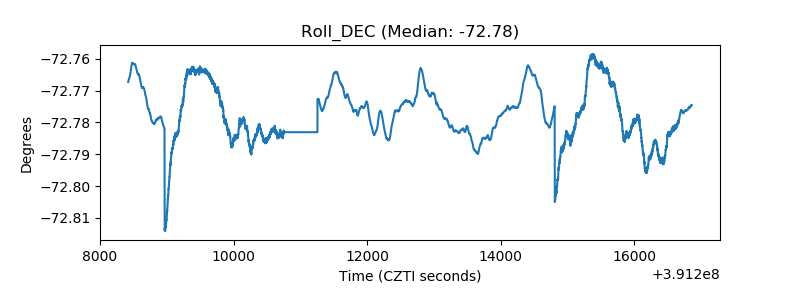 |
| _Roll_RA | 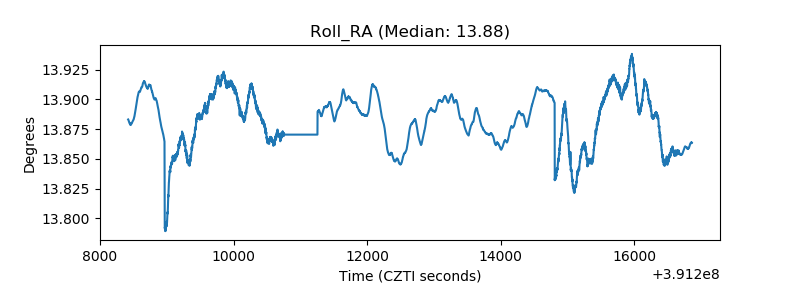 |
| Veto Counter | 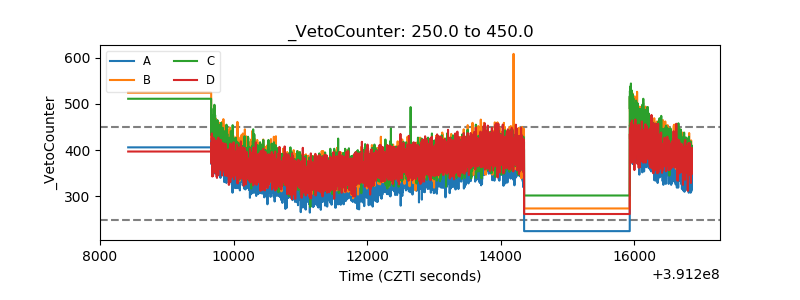 |