| Param | Original file | Final file |
|---|---|---|
| Filename | modeM0/AS1A11_050T19_9000005156_35994cztM0_level2.evt | modeM0/AS1A11_050T19_9000005156_35994cztM0_level2_quad_clean.evt |
| Size (bytes) | 1,489,320,000 | 279,383,040 |
| Size | 1.4 GB | 266.4 MB |
| Events in quadrant A | 7,342,655 | 1,958,186 |
| Events in quadrant B | 9,296,358 | 1,916,595 |
| Events in quadrant C | 14,505,202 | 1,725,852 |
| Events in quadrant D | 12,895,592 | 1,771,165 |
| Mode M0 | |||
|---|---|---|---|
| Quadrant | BADHDUFLAG | Total packets | Discarded packets |
| A | 0 | 32281 | 5 |
| B | 0 | 37937 | 4 |
| C | 0 | 53133 | 4 |
| D | 0 | 48971 | 4 |
| Mode SS | |||
|---|---|---|---|
| Quadrant | BADHDUFLAG | Total packets | Discarded packets |
| A | 0 | 322 | 0 |
| B | 0 | 322 | 0 |
| C | 0 | 322 | 0 |
| D | 0 | 322 | 0 |
| Mode M9 | |||
|---|---|---|---|
| Quadrant | BADHDUFLAG | Total packets | Discarded packets |
| A | 0 | 49 | 0 |
| B | 0 | 49 | 0 |
| C | 0 | 49 | 0 |
| D | 0 | 50 | 0 |
| Quadrant | Total seconds | Saturated seconds | Saturation percentage |
|---|---|---|---|
| A | 15785 | 23 | 0.145708% |
| B | 15785 | 469 | 2.971175% |
| C | 15785 | 2862 | 18.131137% |
| D | 15785 | 1439 | 9.116250% |
Noise dominated data is calculated using 1-second bins in cleaned event files. If a bin has >2000 counts, and if more than 50% of those come from <1% of pixels, then it is considered to be noise-dominated and hence unusable.
| Quadrant | # 1 sec bins | Bins with >0 counts | Bins with >2000 counts | High rate bins dominated by noise | Noise dominated (total time) | Noise dominated (detector-on time) | Marked lightcurve |
|---|---|---|---|---|---|---|---|
| A | 19903 | 15788 | 0 | 0 | 0.00% | 0.00% | 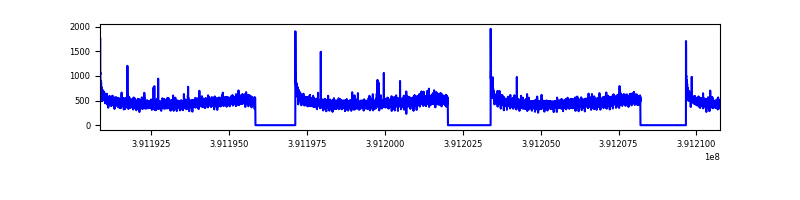 |
| B | 19903 | 15788 | 332 | 332 | 1.67% | 2.10% | 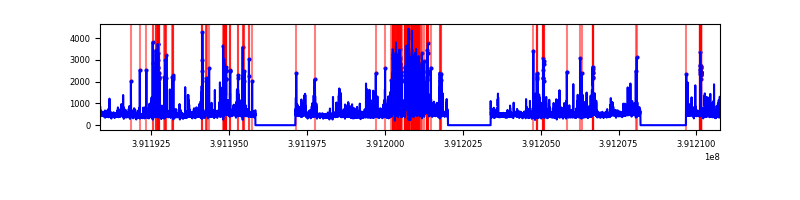 |
| C | 19903 | 15788 | 2543 | 2543 | 12.78% | 16.11% | 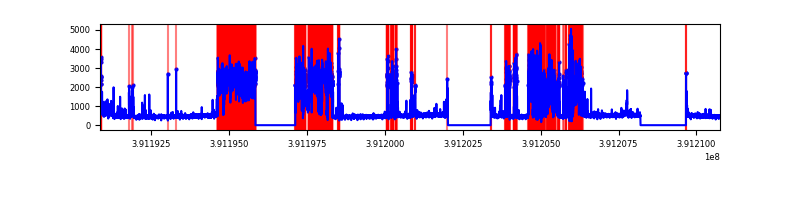 |
| D | 19903 | 15788 | 1247 | 1247 | 6.27% | 7.90% | 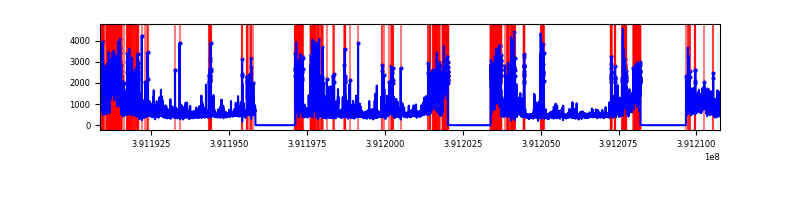 |
Top three noisy pixels from each quadrant. If the there are fewer than three noisy pixels in the level2.evt file, extra rows are filled as -1
| Pixel properties | Quadrant properties | ||||||
|---|---|---|---|---|---|---|---|
| Quadrant | DetID | PixID | Counts | Sigma | Mean | Median | Sigma |
| A | 10 | 83 | 411223 | 1150.45 | 1785 | 1749 | 355.9 |
| A | 13 | 254 | 25928 | 67.93 | 1785 | 1749 | 355.9 |
| A | 3 | 137 | 19153 | 48.9 | 1785 | 1749 | 355.9 |
| B | 5 | 172 | 1440424 | 4316.79 | 1749 | 1699 | 333.3 |
| B | 5 | 255 | 275280 | 820.86 | 1749 | 1699 | 333.3 |
| B | 4 | 171 | 234777 | 699.33 | 1749 | 1699 | 333.3 |
| C | 9 | 187 | 7275772 | 19944.82 | 1595 | 1608 | 364.7 |
| C | 15 | 214 | 605713 | 1656.38 | 1595 | 1608 | 364.7 |
| C | 0 | 207 | 256977 | 700.19 | 1595 | 1608 | 364.7 |
| D | 12 | 227 | 1865029 | 4602.06 | 1682 | 1638 | 404.9 |
| D | 10 | 118 | 1718453 | 4240.06 | 1682 | 1638 | 404.9 |
| D | 12 | 235 | 1296081 | 3196.92 | 1682 | 1638 | 404.9 |
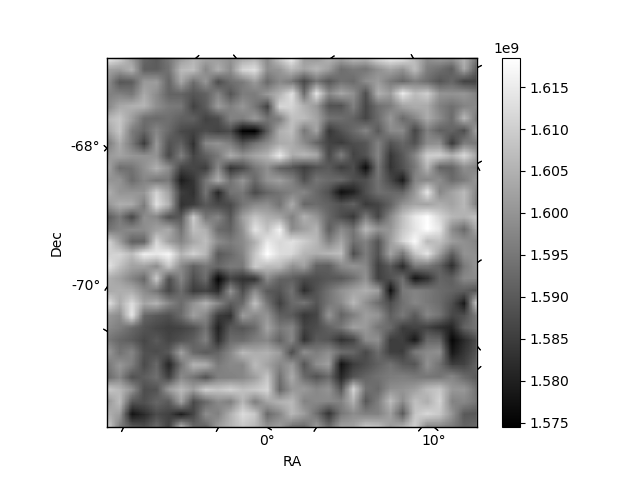
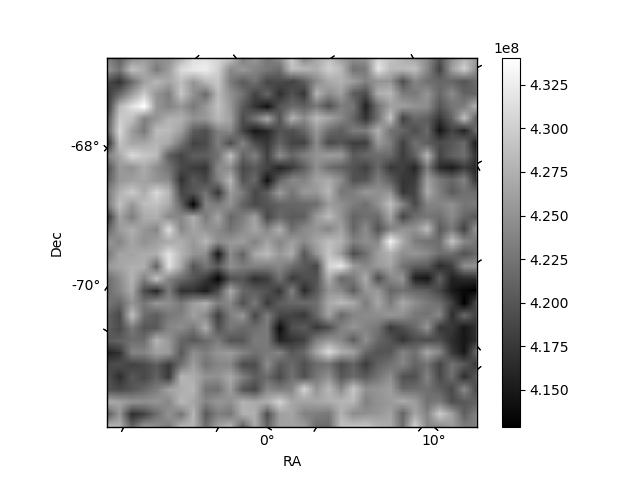
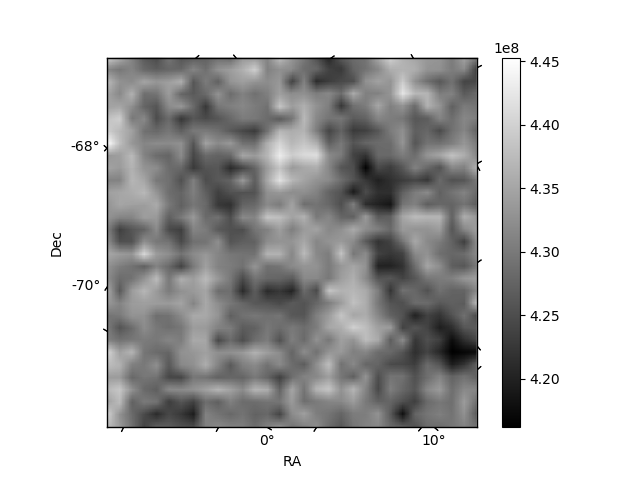
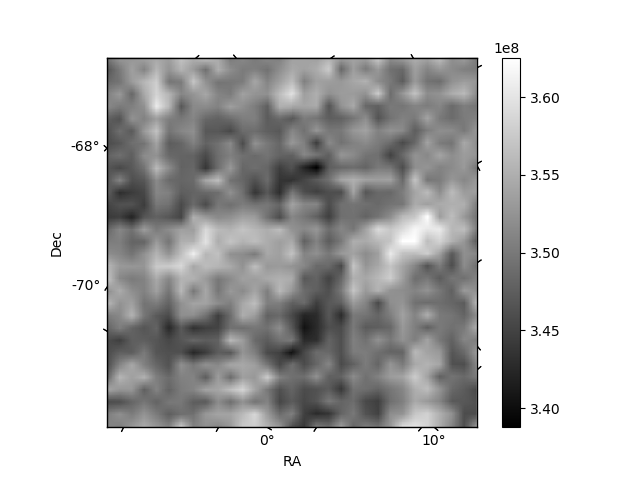
Histogram calculated using DETX and DETY for each event in the final _common_clean file
| Quadrant A | 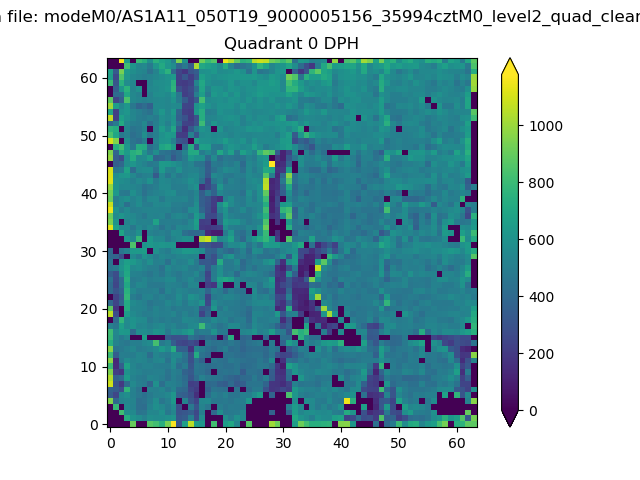 |
 |
Quadrant B |
|---|---|---|---|
| Quadrant D | 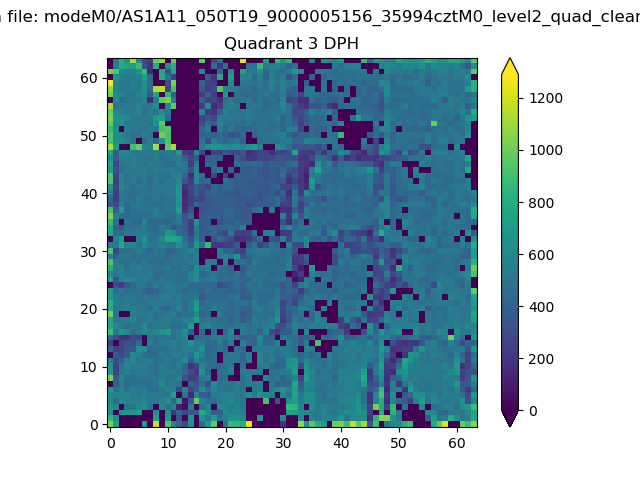 |
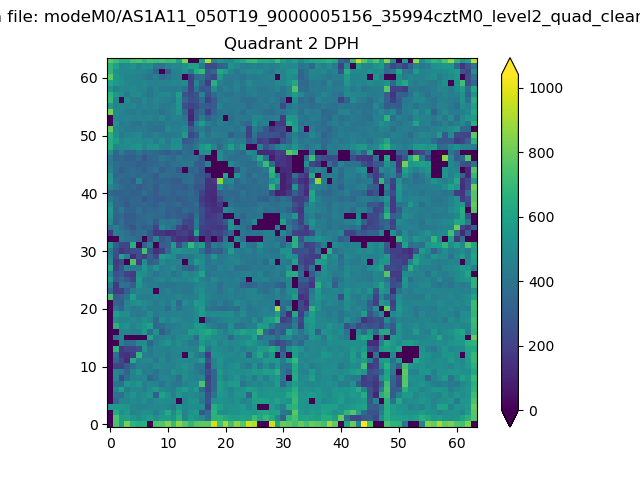 |
Quadrant C |
| Plot type | Count rate plots | Images |
|---|---|---|
| Comparison with Poisson distribution Blue bars denote a histogram of data divided into 1 sec bins. Red curve is a Poisson curve with rate = median count rate of data. |
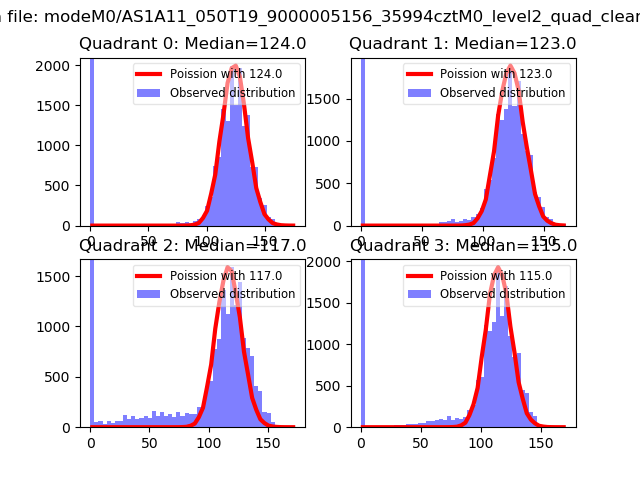 |
 |
| Quadrant-wise count rates Data is divided into 100 sec bins |
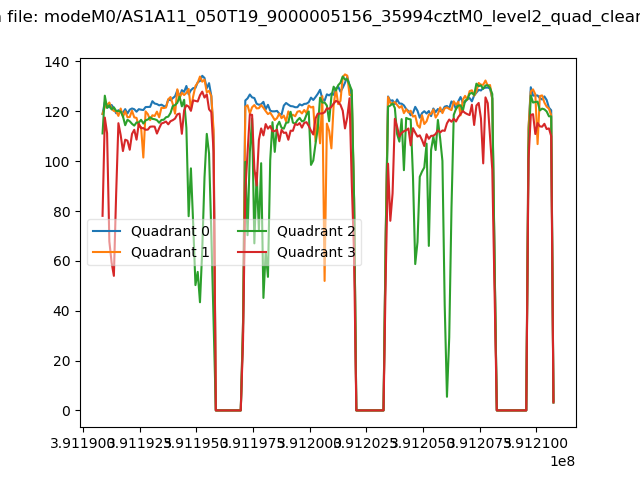 |
|
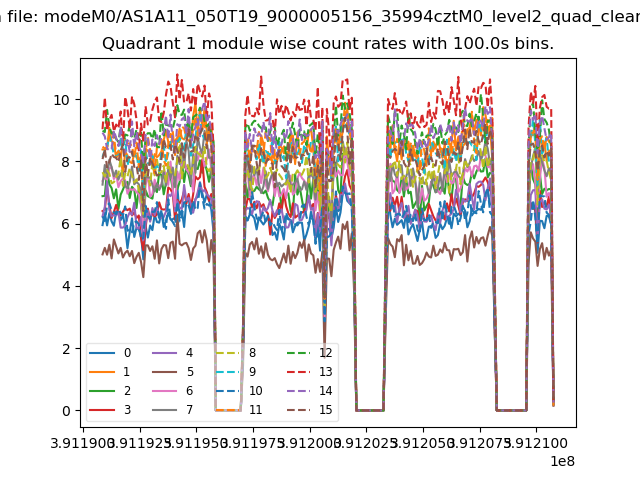
| Module-wise count rates for Quadrant A Data is divided into 100 sec bins |
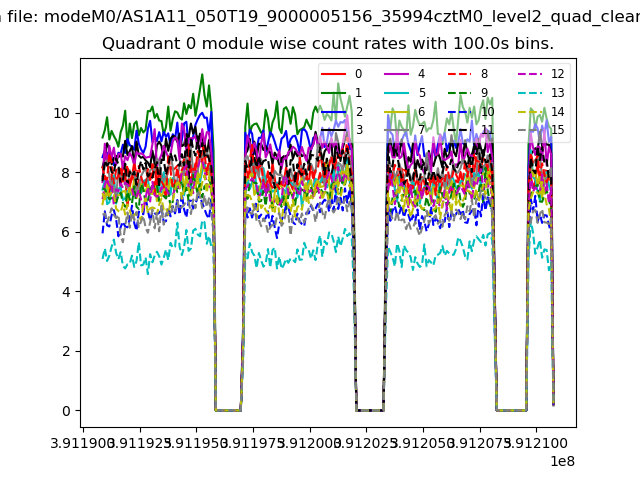 |
 |
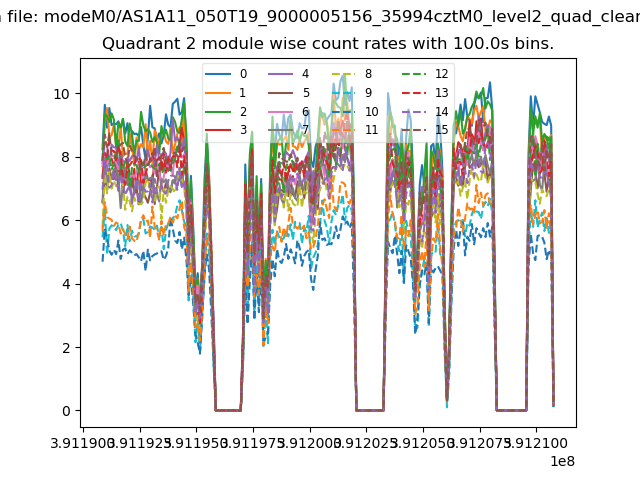
| Module-wise count rates for Quadrant B Data is divided into 100 sec bins |
 |
 |
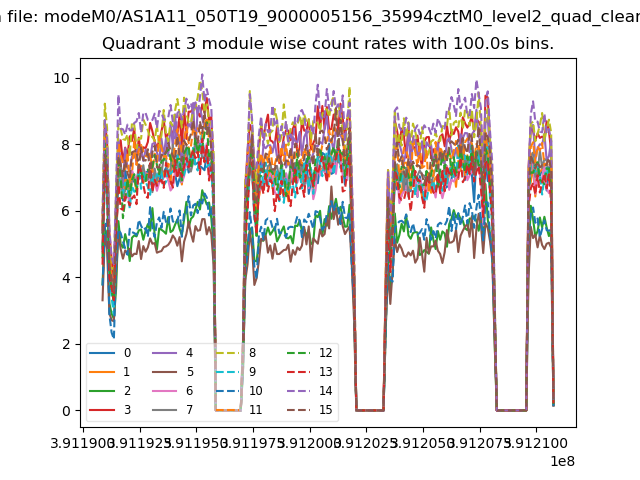
| Module-wise count rates for Quadrant C Data is divided into 100 sec bins |
 |
 |
| Module-wise count rates for Quadrant D Data is divided into 100 sec bins |
 |
 |
| Parameter | Plot |
|---|---|
| CZT HV Monitor | 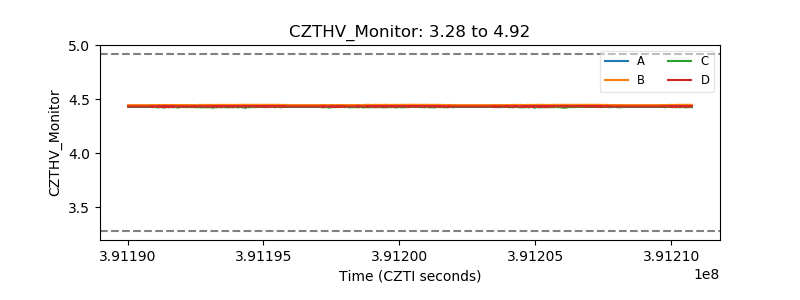 |
| D_VDD | 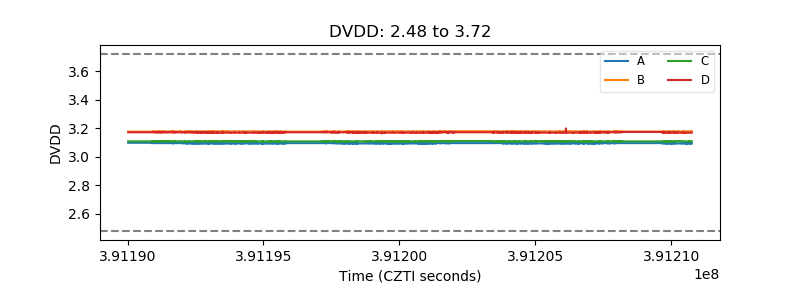 |
| Temperature 1 | 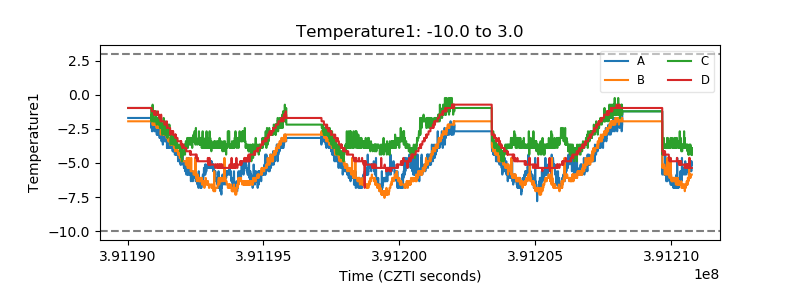 |
| Veto HV Monitor | 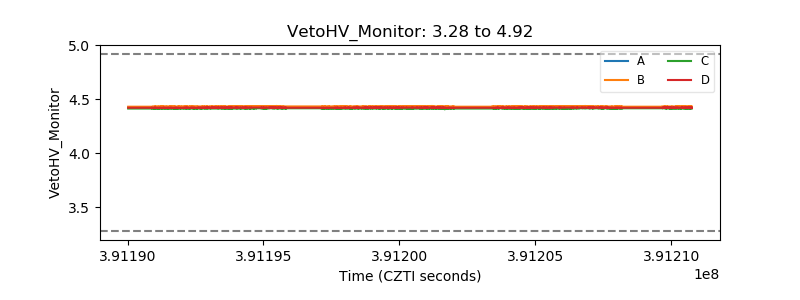 |
| Veto LLD | 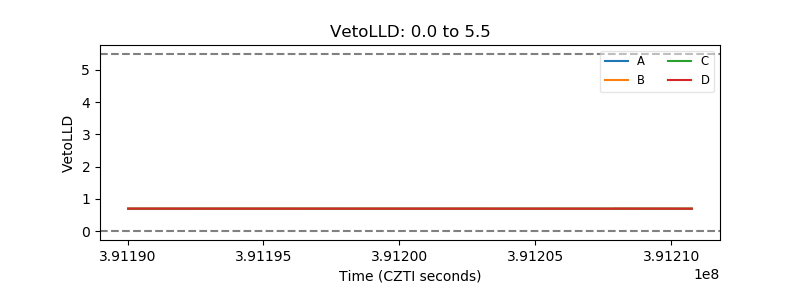 |
| Alpha Counter | 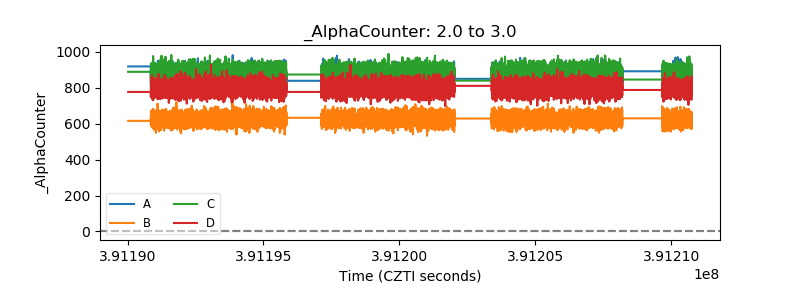 |
| _CPM_Rate | 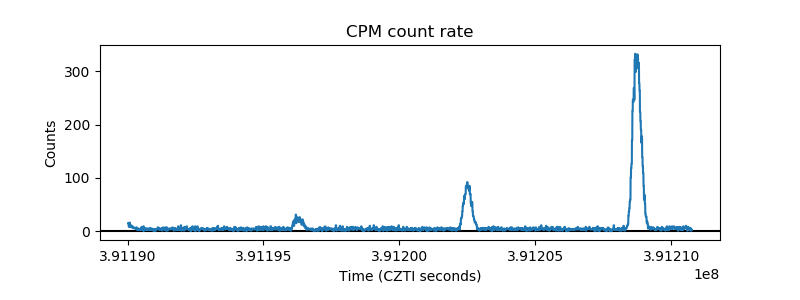 |
| CZT Counter | 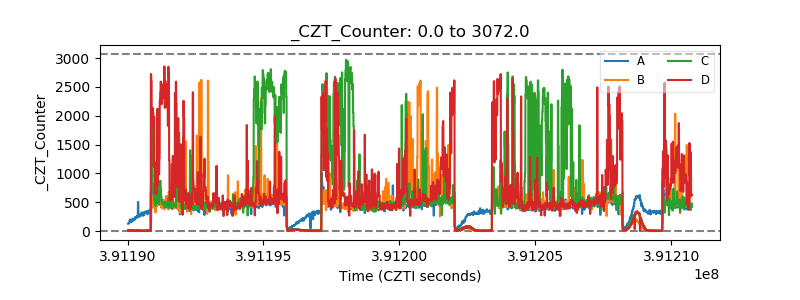 |
| +2.5 Volts monitor | 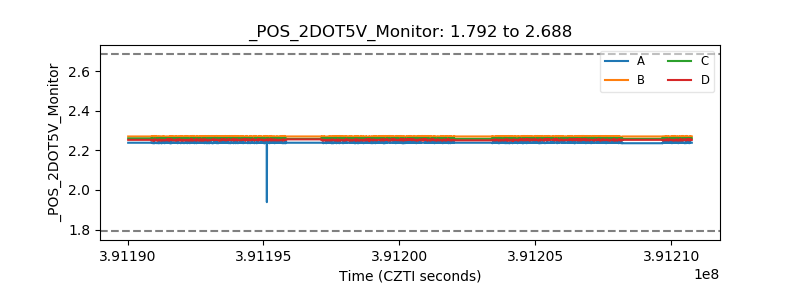 |
| +5 Volts monitor | 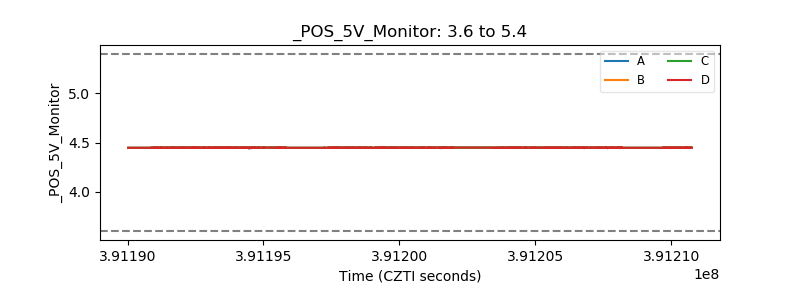 |
| _ROLL_ROT | 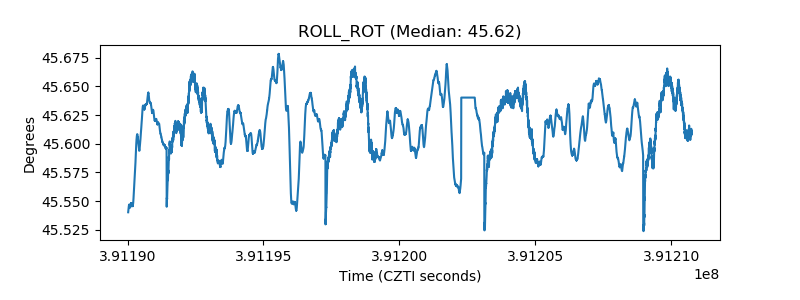 |
| _Roll_DEC | 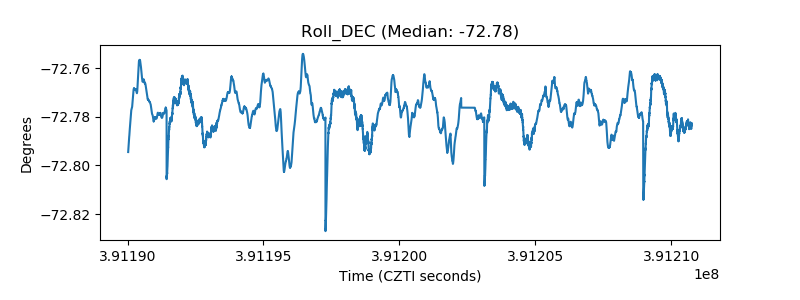 |
| _Roll_RA | 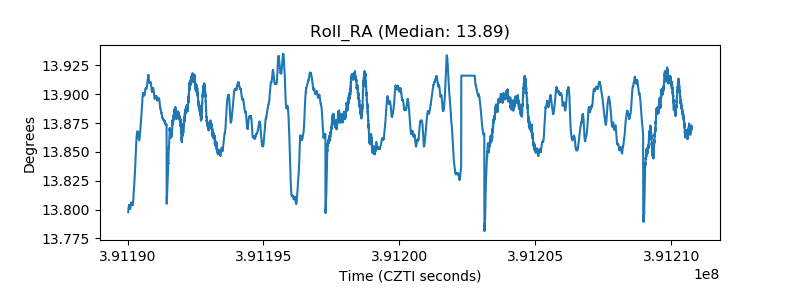 |
| Veto Counter | 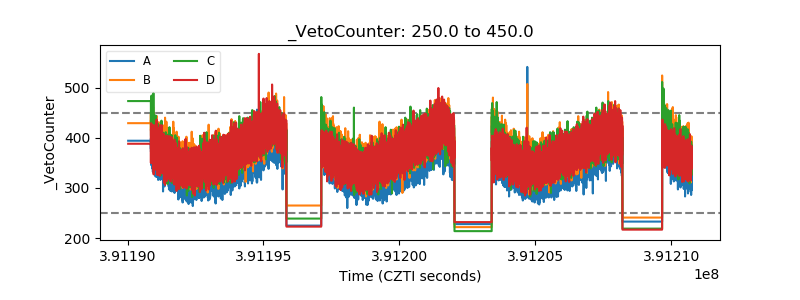 |