| Param | Original file | Final file |
|---|---|---|
| Filename | modeM0/AS1A11_050T19_9000005156_35991cztM0_level2.evt | modeM0/AS1A11_050T19_9000005156_35991cztM0_level2_quad_clean.evt |
| Size (bytes) | 566,979,840 | 104,955,840 |
| Size | 540.7 MB | 100.1 MB |
| Events in quadrant A | 2,753,304 | 729,888 |
| Events in quadrant B | 2,859,421 | 723,778 |
| Events in quadrant C | 5,559,815 | 660,787 |
| Events in quadrant D | 5,600,515 | 653,083 |
| Mode M0 | |||
|---|---|---|---|
| Quadrant | BADHDUFLAG | Total packets | Discarded packets |
| A | 0 | 12046 | 3 |
| B | 0 | 12371 | 2 |
| C | 0 | 20345 | 2 |
| D | 0 | 20667 | 2 |
| Mode SS | |||
|---|---|---|---|
| Quadrant | BADHDUFLAG | Total packets | Discarded packets |
| A | 0 | 120 | 0 |
| B | 0 | 120 | 0 |
| C | 0 | 120 | 0 |
| D | 0 | 120 | 0 |
| Mode M9 | |||
|---|---|---|---|
| Quadrant | BADHDUFLAG | Total packets | Discarded packets |
| A | 0 | 16 | 0 |
| B | 0 | 16 | 0 |
| C | 0 | 16 | 0 |
| D | 0 | 17 | 0 |
| Quadrant | Total seconds | Saturated seconds | Saturation percentage |
|---|---|---|---|
| A | 5874 | 12 | 0.204290% |
| B | 5874 | 17 | 0.289411% |
| C | 5874 | 741 | 12.614913% |
| D | 5874 | 621 | 10.572012% |
Noise dominated data is calculated using 1-second bins in cleaned event files. If a bin has >2000 counts, and if more than 50% of those come from <1% of pixels, then it is considered to be noise-dominated and hence unusable.
| Quadrant | # 1 sec bins | Bins with >0 counts | Bins with >2000 counts | High rate bins dominated by noise | Noise dominated (total time) | Noise dominated (detector-on time) | Marked lightcurve |
|---|---|---|---|---|---|---|---|
| A | 7157 | 5875 | 0 | 0 | 0.00% | 0.00% | 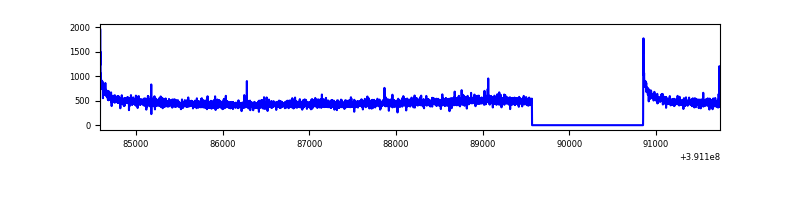 |
| B | 7157 | 5875 | 10 | 10 | 0.14% | 0.17% | 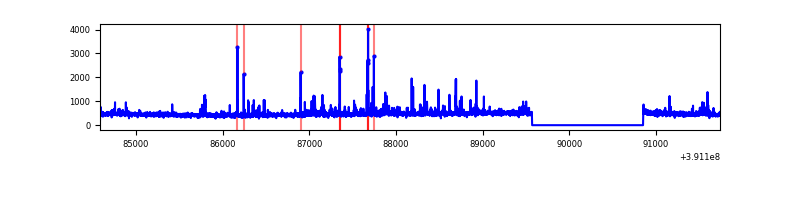 |
| C | 7157 | 5874 | 692 | 692 | 9.67% | 11.78% | 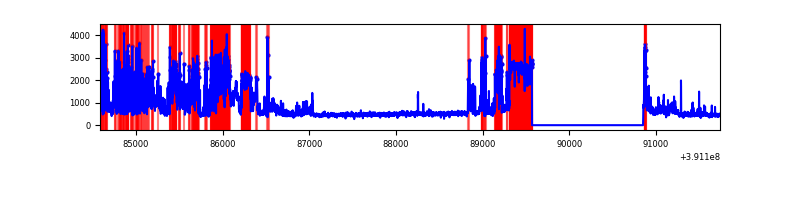 |
| D | 7157 | 5875 | 555 | 555 | 7.75% | 9.45% | 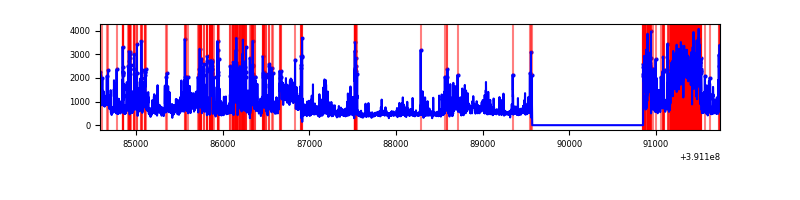 |
Top three noisy pixels from each quadrant. If the there are fewer than three noisy pixels in the level2.evt file, extra rows are filled as -1
| Pixel properties | Quadrant properties | ||||||
|---|---|---|---|---|---|---|---|
| Quadrant | DetID | PixID | Counts | Sigma | Mean | Median | Sigma |
| A | 10 | 83 | 182736 | 1365.86 | 663 | 649 | 133.3 |
| A | 13 | 254 | 8673 | 60.19 | 663 | 649 | 133.3 |
| A | 3 | 137 | 7090 | 48.31 | 663 | 649 | 133.3 |
| B | 5 | 172 | 120111 | 961.69 | 654 | 638 | 124.2 |
| B | 0 | 190 | 39205 | 310.44 | 654 | 638 | 124.2 |
| B | 4 | 171 | 38174 | 302.14 | 654 | 638 | 124.2 |
| C | 9 | 187 | 2703798 | 19528.38 | 599 | 604 | 138.4 |
| C | 15 | 214 | 232353 | 1674.2 | 599 | 604 | 138.4 |
| C | 9 | 69 | 140879 | 1013.37 | 599 | 604 | 138.4 |
| D | 10 | 118 | 1259328 | 8407.79 | 614 | 597 | 149.7 |
| D | 12 | 235 | 932383 | 6223.94 | 614 | 597 | 149.7 |
| D | 12 | 227 | 382624 | 2551.78 | 614 | 597 | 149.7 |
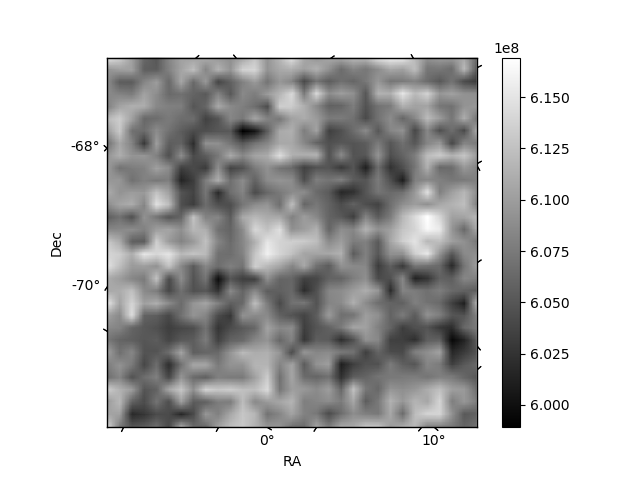
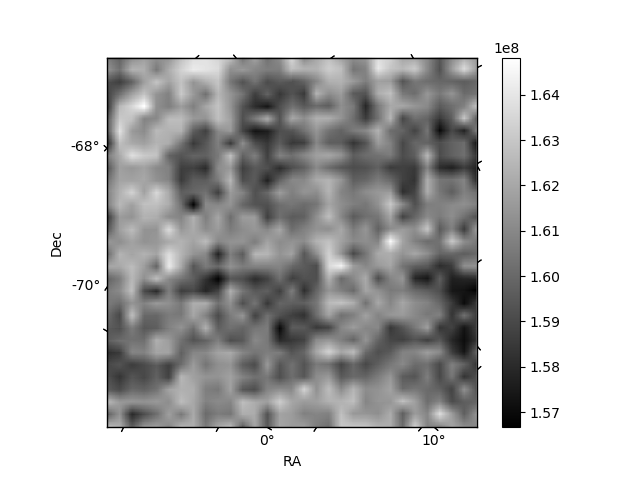
Histogram calculated using DETX and DETY for each event in the final _common_clean file
| Quadrant A | 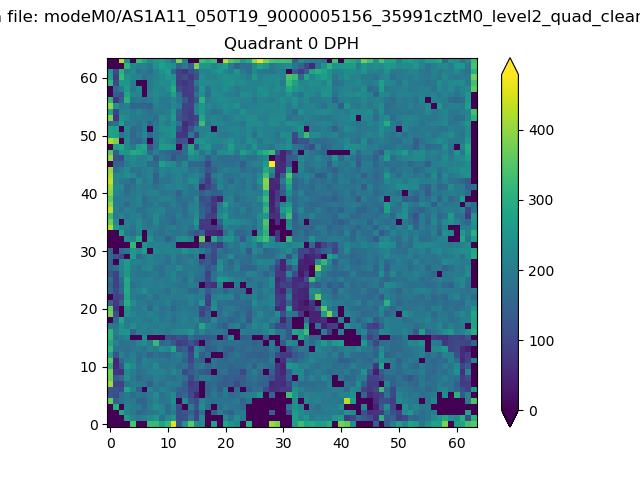 |
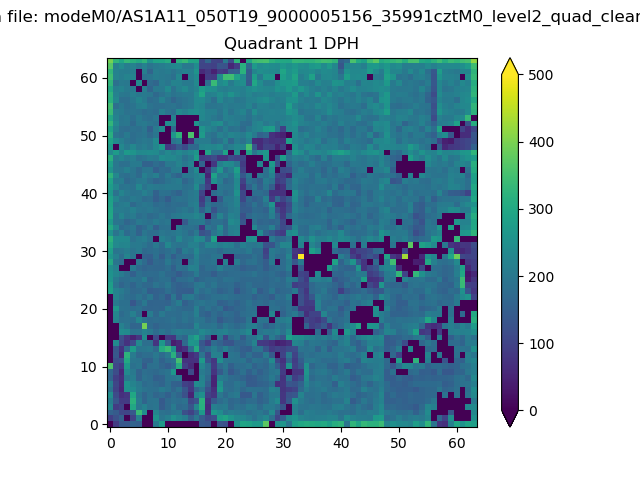 |
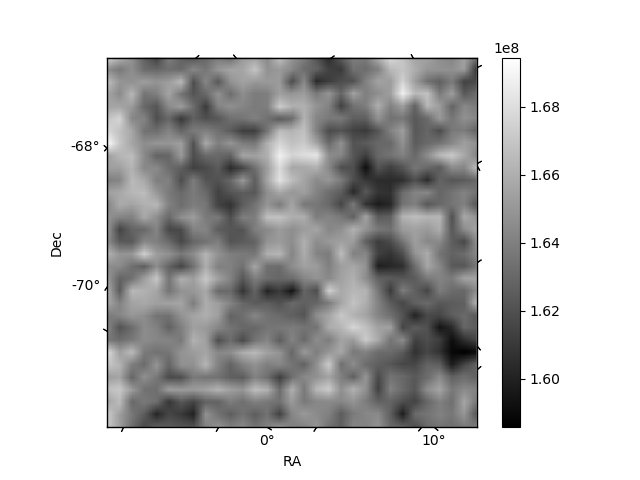
Quadrant B |
|---|---|---|---|
| Quadrant D | 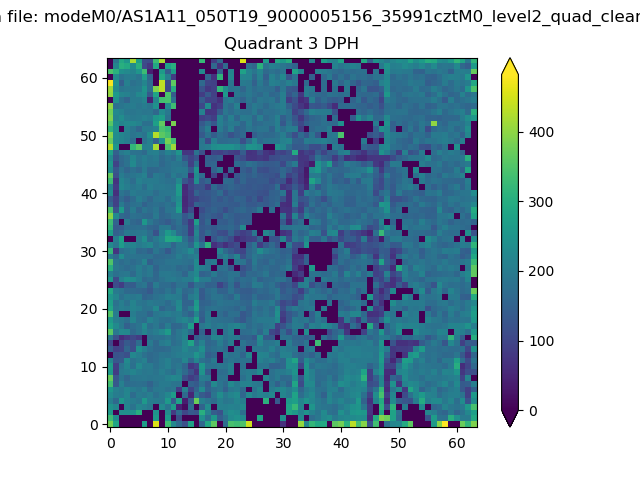 |
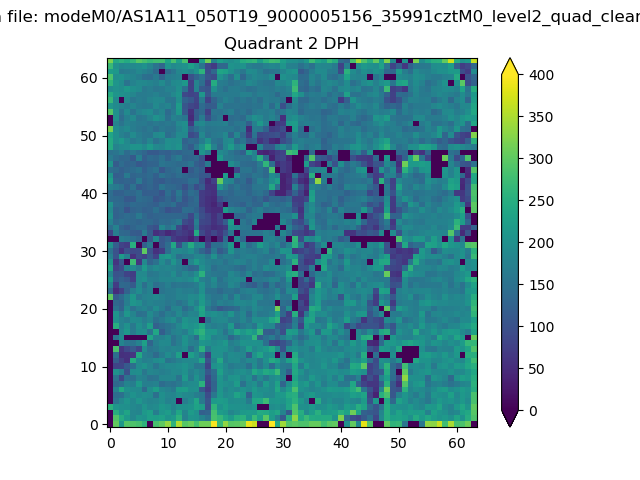 |
Quadrant C |
| Plot type | Count rate plots | Images |
|---|---|---|
| Comparison with Poisson distribution Blue bars denote a histogram of data divided into 1 sec bins. Red curve is a Poisson curve with rate = median count rate of data. |
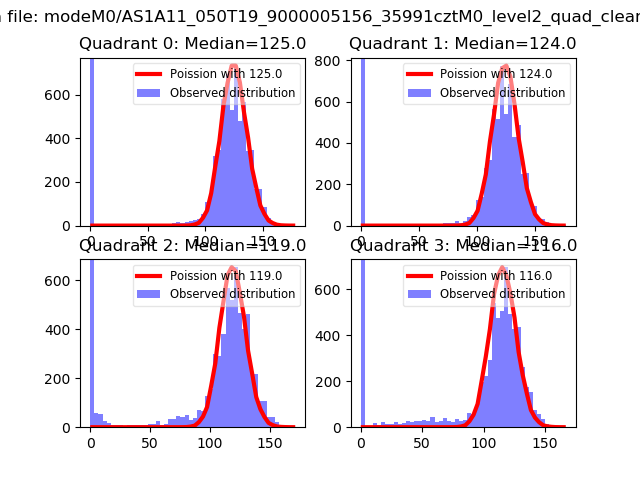 |
 |
| Quadrant-wise count rates Data is divided into 100 sec bins |
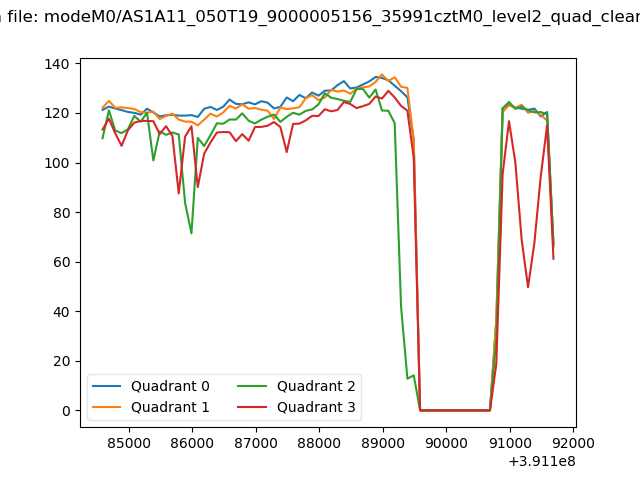 |
|
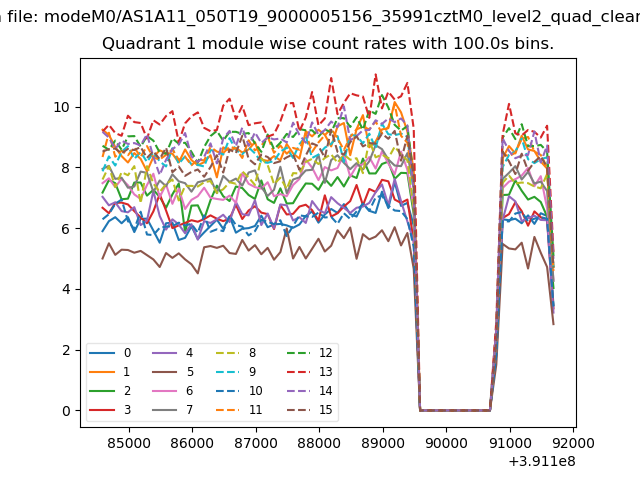
| Module-wise count rates for Quadrant A Data is divided into 100 sec bins |
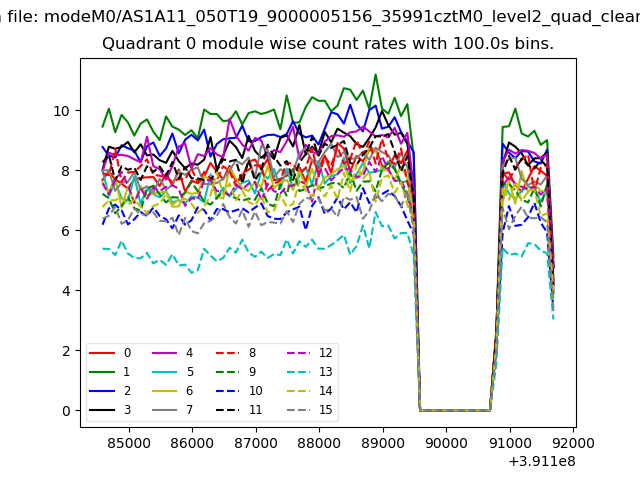 |
 |
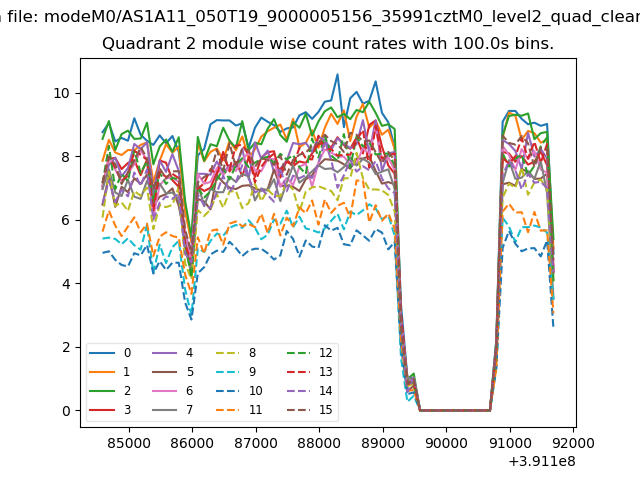
| Module-wise count rates for Quadrant B Data is divided into 100 sec bins |
 |
 |
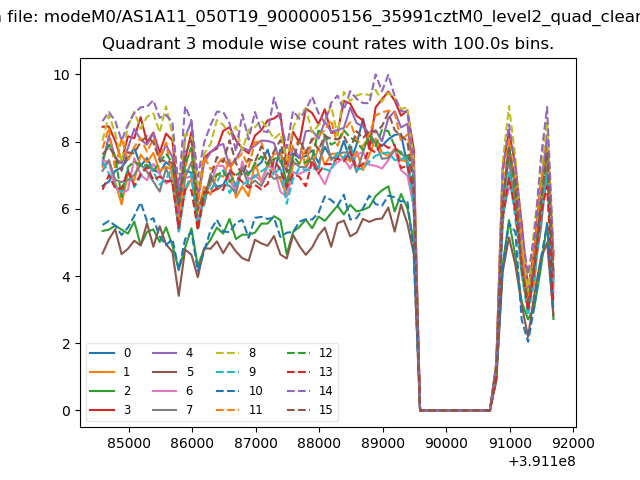
| Module-wise count rates for Quadrant C Data is divided into 100 sec bins |
 |
 |
| Module-wise count rates for Quadrant D Data is divided into 100 sec bins |
 |
 |
| Parameter | Plot |
|---|---|
| CZT HV Monitor | 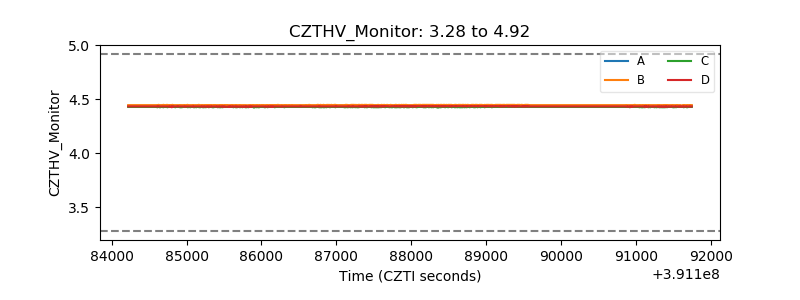 |
| D_VDD | 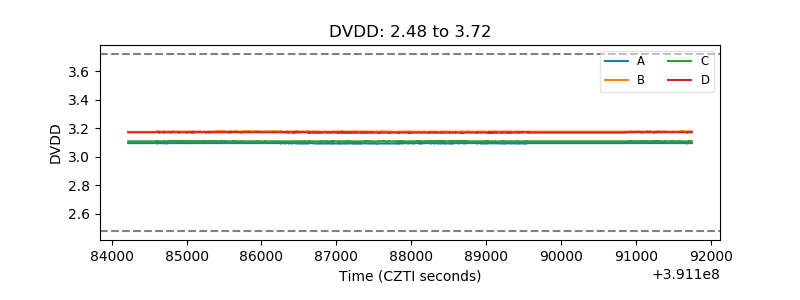 |
| Temperature 1 | 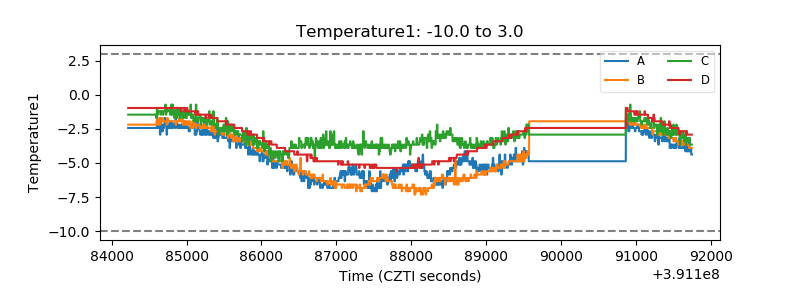 |
| Veto HV Monitor | 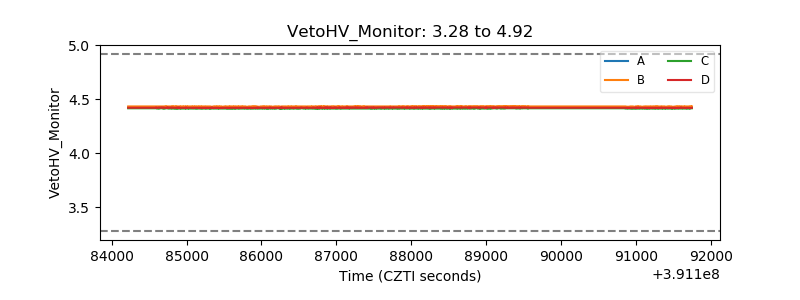 |
| Veto LLD | 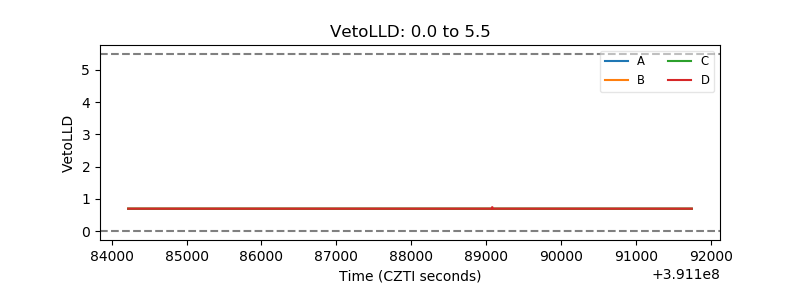 |
| Alpha Counter | 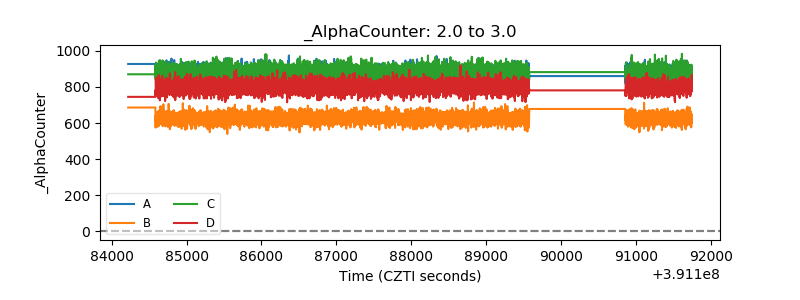 |
| _CPM_Rate | 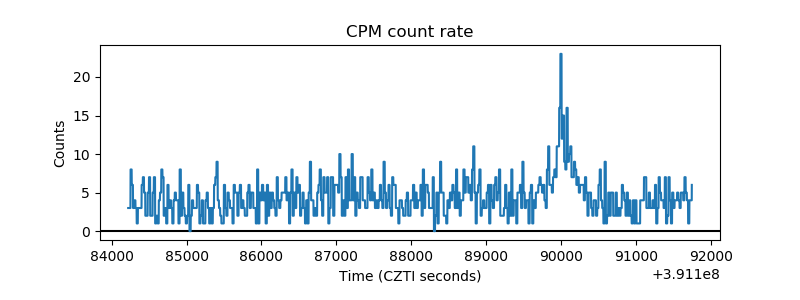 |
| CZT Counter | 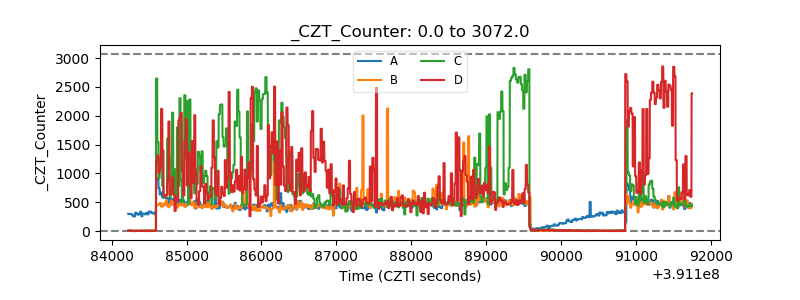 |
| +2.5 Volts monitor | 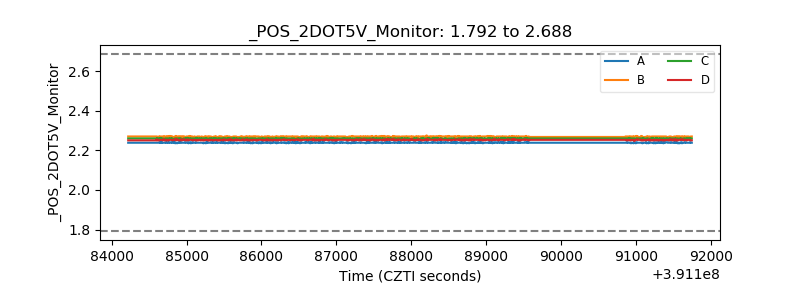 |
| +5 Volts monitor | 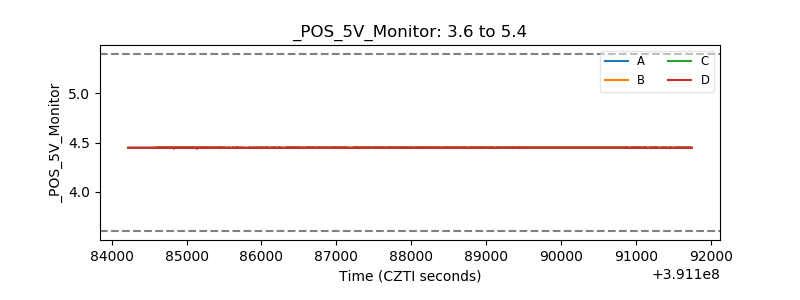 |
| _ROLL_ROT | 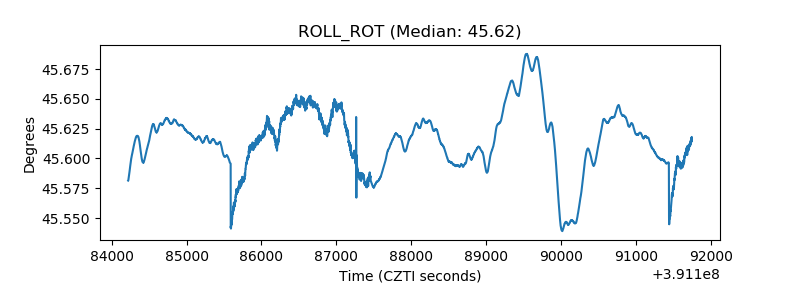 |
| _Roll_DEC | 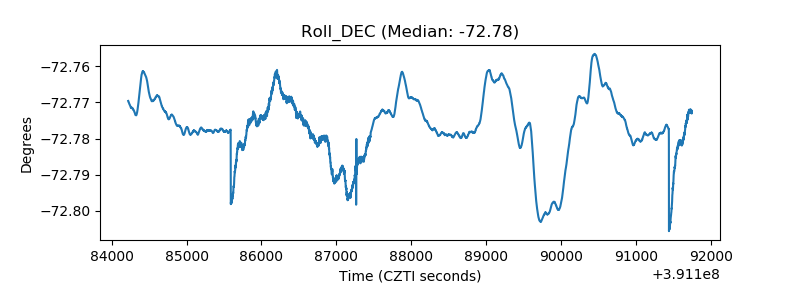 |
| _Roll_RA | 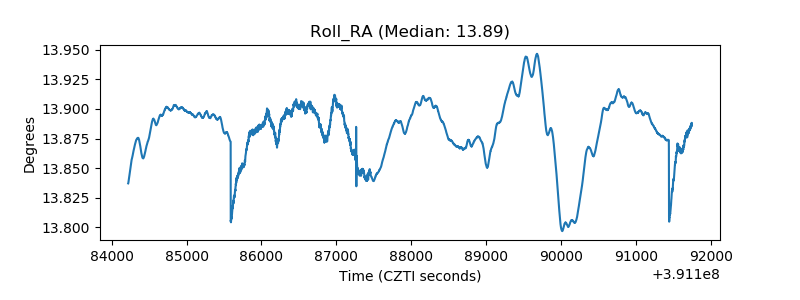 |
| Veto Counter | 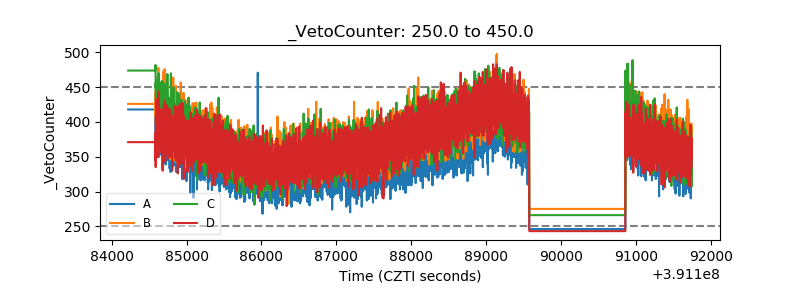 |