| Param | Original file | Final file |
|---|---|---|
| Filename | modeM0/AS1A11_050T19_9000005156_35984cztM0_level2.evt | modeM0/AS1A11_050T19_9000005156_35984cztM0_level2_quad_clean.evt |
| Size (bytes) | 790,038,720 | 87,929,280 |
| Size | 753.4 MB | 83.9 MB |
| Events in quadrant A | 2,559,904 | 710,125 |
| Events in quadrant B | 13,228,338 | 260,938 |
| Events in quadrant C | 3,631,034 | 692,059 |
| Events in quadrant D | 4,161,409 | 638,633 |
| Mode M0 | |||
|---|---|---|---|
| Quadrant | BADHDUFLAG | Total packets | Discarded packets |
| A | 0 | 10759 | 3 |
| B | 0 | 42841 | 2 |
| C | 0 | 13960 | 2 |
| D | 0 | 15613 | 2 |
| Mode SS | |||
|---|---|---|---|
| Quadrant | BADHDUFLAG | Total packets | Discarded packets |
| A | 0 | 104 | 0 |
| B | 0 | 104 | 0 |
| C | 0 | 104 | 0 |
| D | 0 | 104 | 0 |
| Mode M9 | |||
|---|---|---|---|
| Quadrant | BADHDUFLAG | Total packets | Discarded packets |
| A | 0 | 24 | 0 |
| B | 0 | 24 | 0 |
| C | 0 | 24 | 0 |
| D | 0 | 25 | 0 |
| Quadrant | Total seconds | Saturated seconds | Saturation percentage |
|---|---|---|---|
| A | 5116 | 5 | 0.097733% |
| B | 5116 | 5110 | 99.882721% |
| C | 5116 | 282 | 5.512119% |
| D | 5116 | 505 | 9.870993% |
Noise dominated data is calculated using 1-second bins in cleaned event files. If a bin has >2000 counts, and if more than 50% of those come from <1% of pixels, then it is considered to be noise-dominated and hence unusable.
| Quadrant | # 1 sec bins | Bins with >0 counts | Bins with >2000 counts | High rate bins dominated by noise | Noise dominated (total time) | Noise dominated (detector-on time) | Marked lightcurve |
|---|---|---|---|---|---|---|---|
| A | 7058 | 5117 | 0 | 0 | 0.00% | 0.00% | 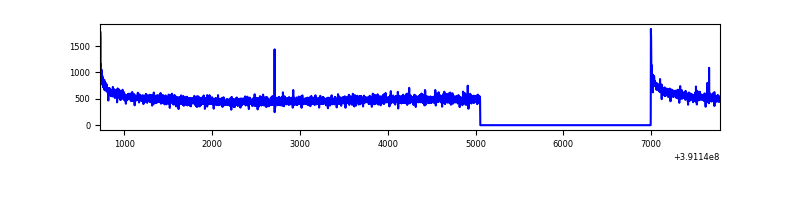 |
| B | 7057 | 5115 | 4989 | 4989 | 70.70% | 97.54% | 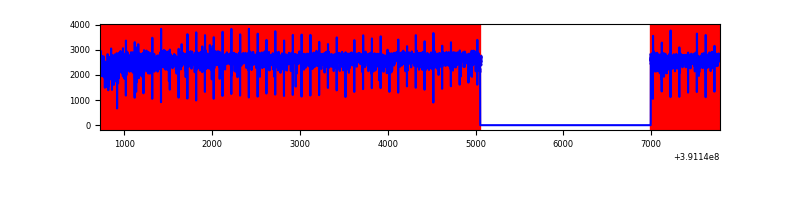 |
| C | 7058 | 5117 | 216 | 216 | 3.06% | 4.22% |  |
| D | 7058 | 5117 | 438 | 438 | 6.21% | 8.56% | 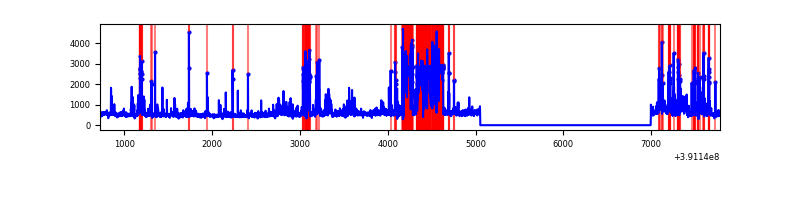 |
Top three noisy pixels from each quadrant. If the there are fewer than three noisy pixels in the level2.evt file, extra rows are filled as -1
| Pixel properties | Quadrant properties | ||||||
|---|---|---|---|---|---|---|---|
| Quadrant | DetID | PixID | Counts | Sigma | Mean | Median | Sigma |
| A | 10 | 83 | 163338 | 1312.82 | 617 | 605 | 124.0 |
| A | 13 | 254 | 8253 | 61.7 | 617 | 605 | 124.0 |
| A | 3 | 137 | 6047 | 43.9 | 617 | 605 | 124.0 |
| B | 5 | 31 | 4992193 | 101759.08 | 252 | 246 | 49.1 |
| B | 5 | 15 | 4663007 | 95048.74 | 252 | 246 | 49.1 |
| B | 5 | 14 | 2247036 | 45800.02 | 252 | 246 | 49.1 |
| C | 0 | 207 | 668831 | 4817.54 | 599 | 605 | 138.7 |
| C | 9 | 187 | 308482 | 2219.62 | 599 | 605 | 138.7 |
| C | 15 | 214 | 212400 | 1526.92 | 599 | 605 | 138.7 |
| D | 13 | 249 | 1087705 | 7741.62 | 577 | 561 | 140.4 |
| D | 1 | 52 | 251919 | 1789.94 | 577 | 561 | 140.4 |
| D | 8 | 195 | 201004 | 1427.37 | 577 | 561 | 140.4 |
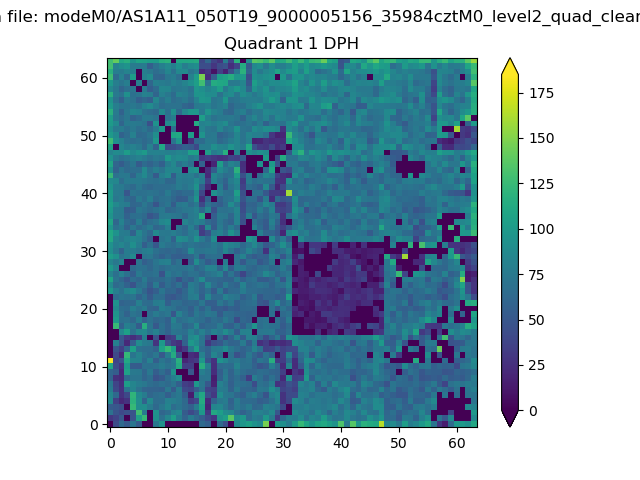
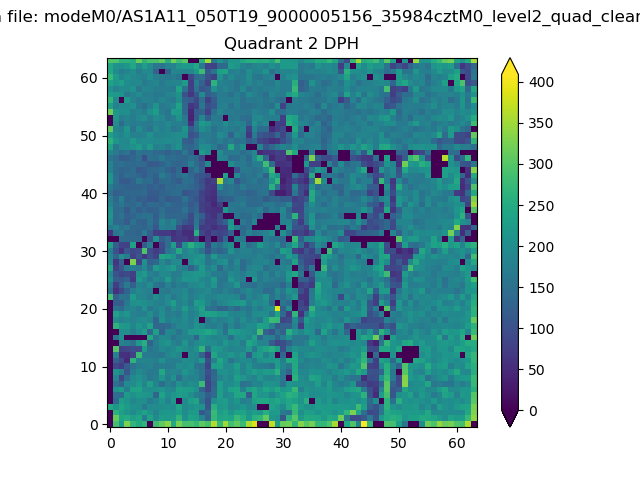
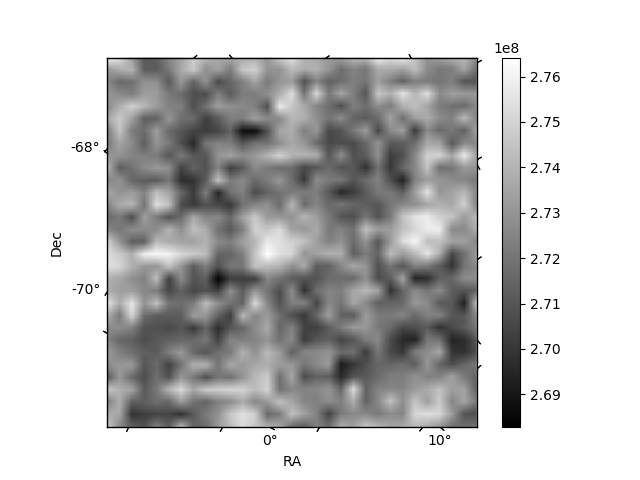
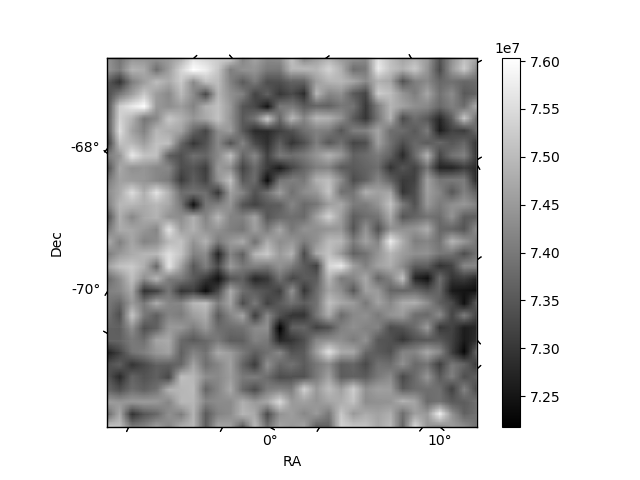
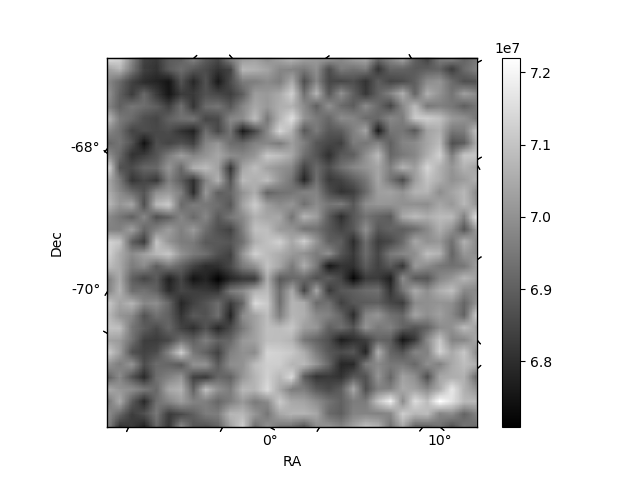
Histogram calculated using DETX and DETY for each event in the final _common_clean file
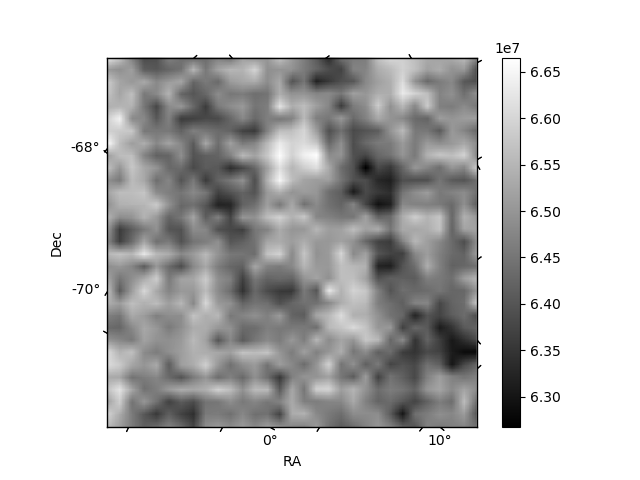
| Quadrant A | 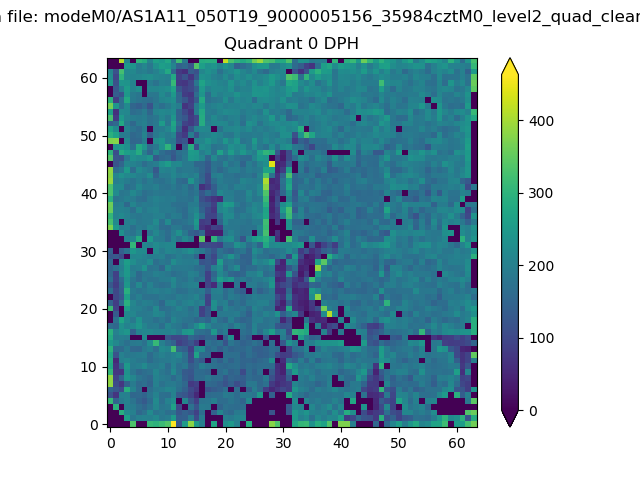 |
 |
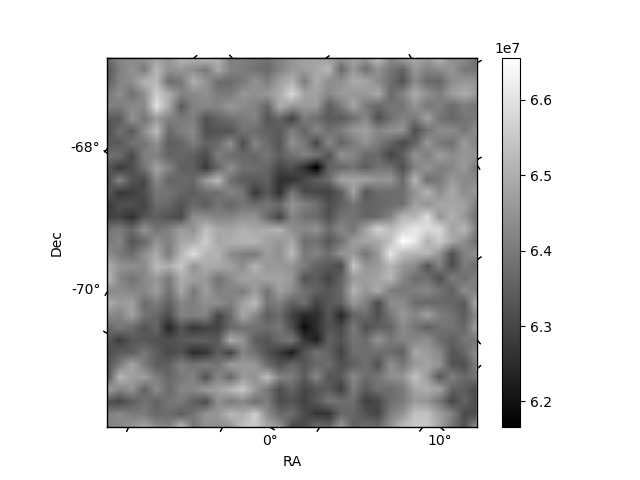
Quadrant B |
|---|---|---|---|
| Quadrant D | 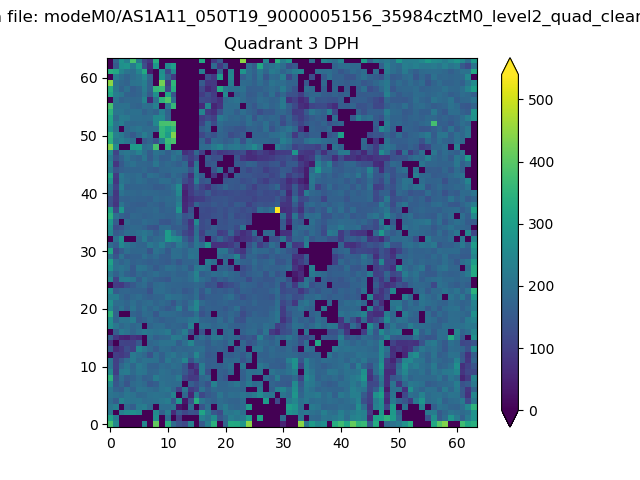 |
 |
Quadrant C |
| Plot type | Count rate plots | Images |
|---|---|---|
| Comparison with Poisson distribution Blue bars denote a histogram of data divided into 1 sec bins. Red curve is a Poisson curve with rate = median count rate of data. |
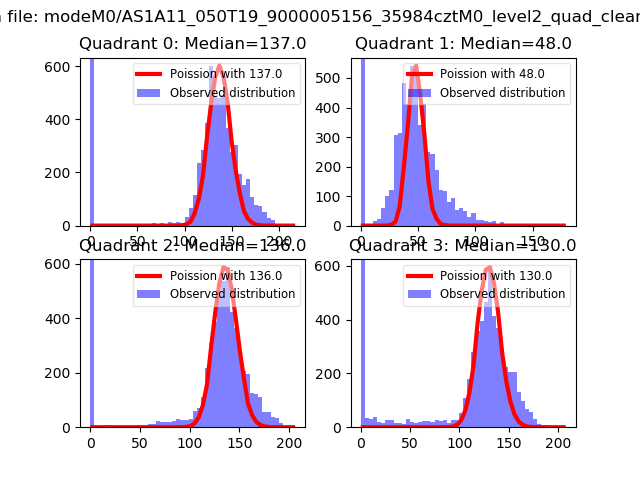 |
 |
| Quadrant-wise count rates Data is divided into 100 sec bins |
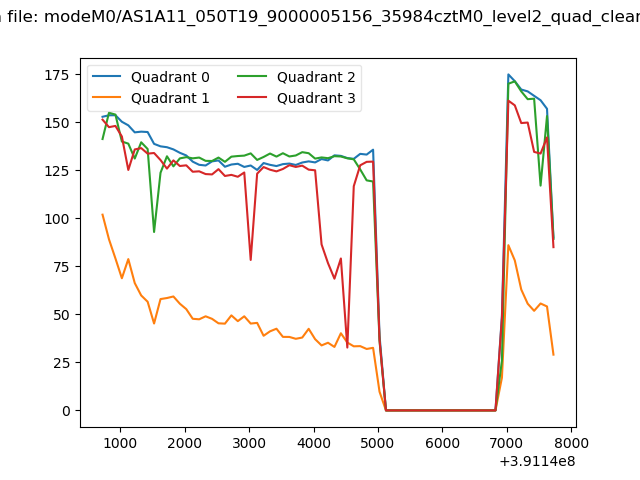 |
|
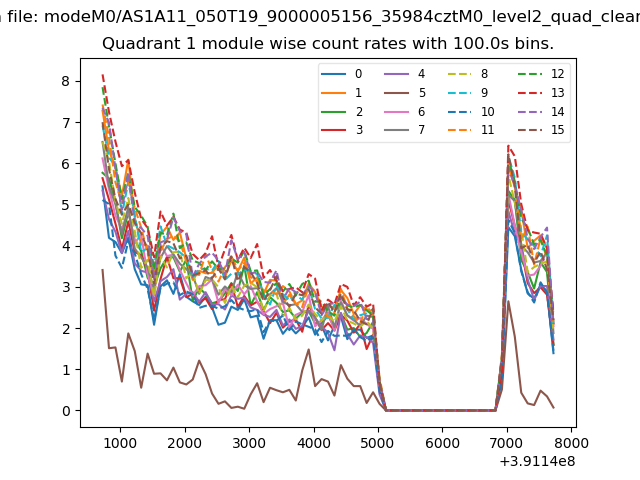
| Module-wise count rates for Quadrant A Data is divided into 100 sec bins |
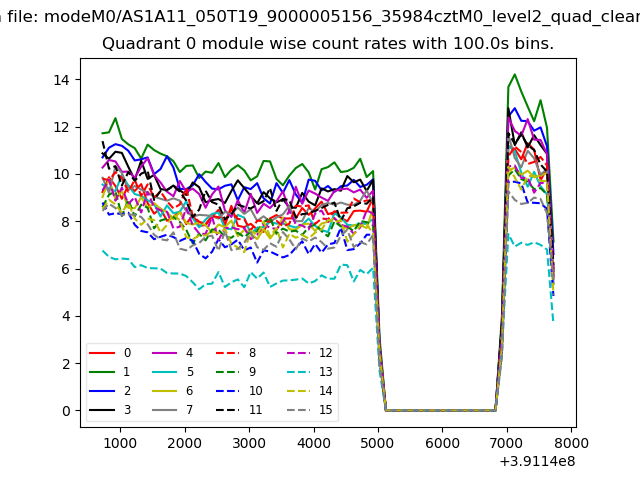 |
 |
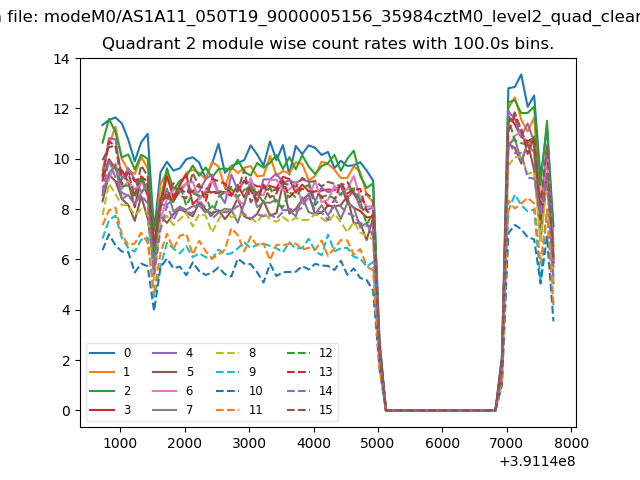
| Module-wise count rates for Quadrant B Data is divided into 100 sec bins |
 |
 |
| Module-wise count rates for Quadrant C Data is divided into 100 sec bins |
 |
 |
| Module-wise count rates for Quadrant D Data is divided into 100 sec bins |
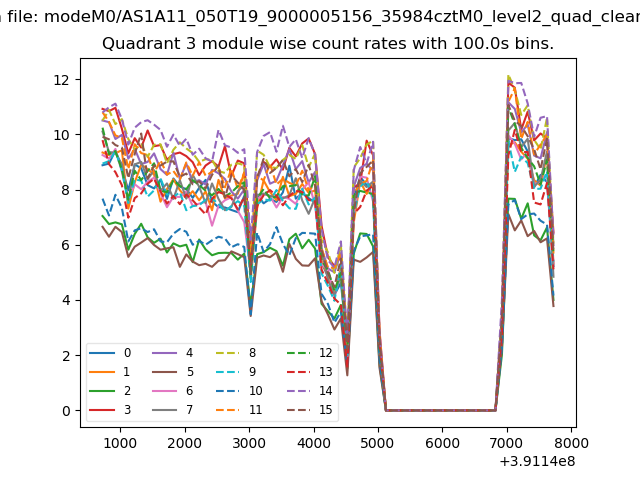 |
 |
| Parameter | Plot |
|---|---|
| CZT HV Monitor |  |
| D_VDD | 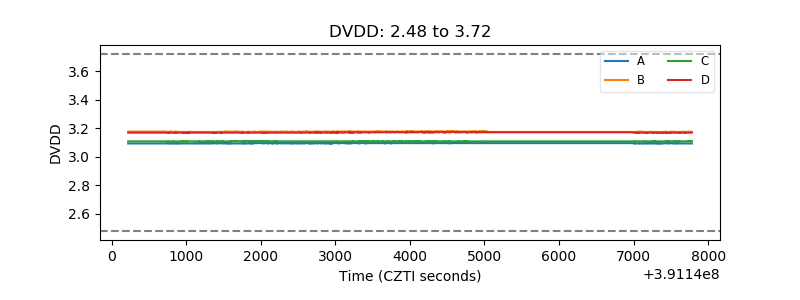 |
| Temperature 1 | 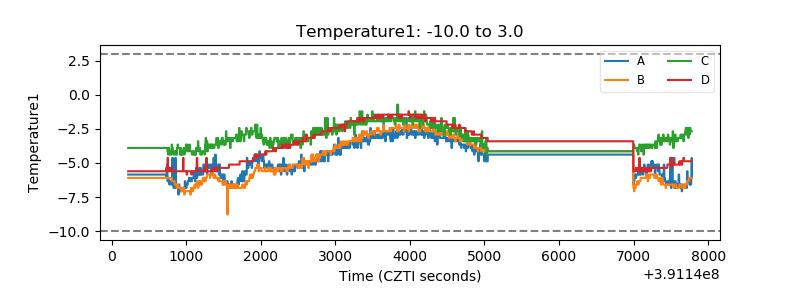 |
| Veto HV Monitor | 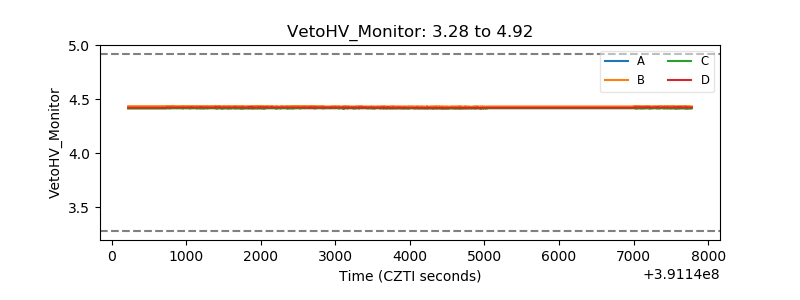 |
| Veto LLD | 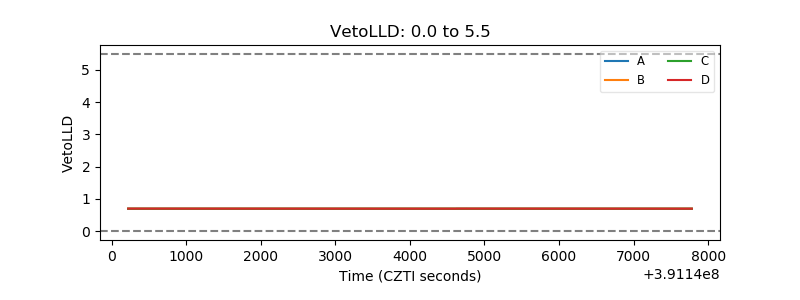 |
| Alpha Counter | 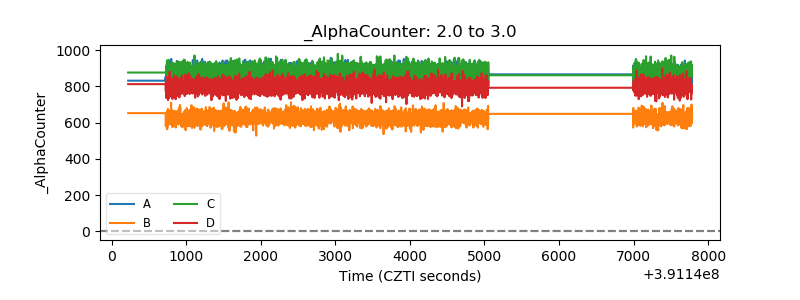 |
| _CPM_Rate | 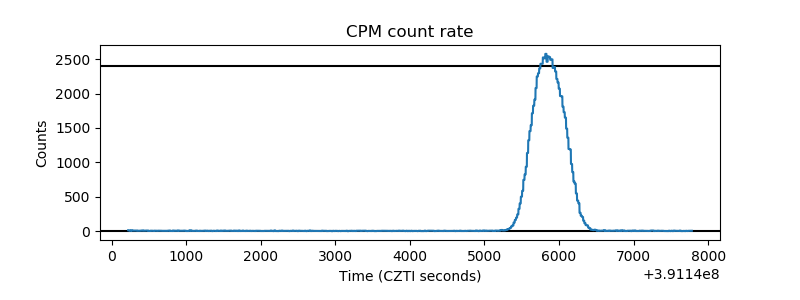 |
| CZT Counter | 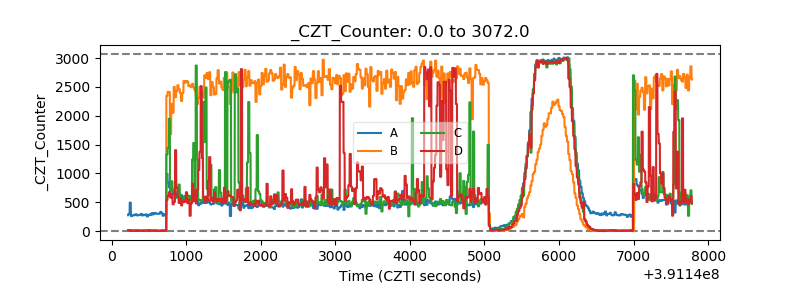 |
| +2.5 Volts monitor | 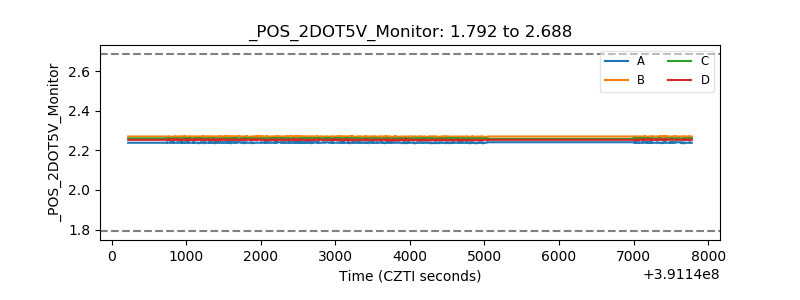 |
| +5 Volts monitor | 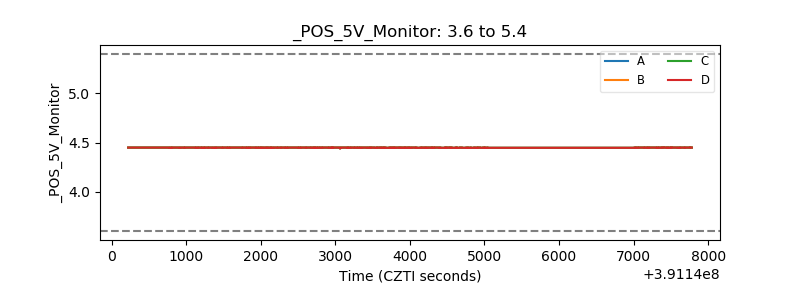 |
| _ROLL_ROT | 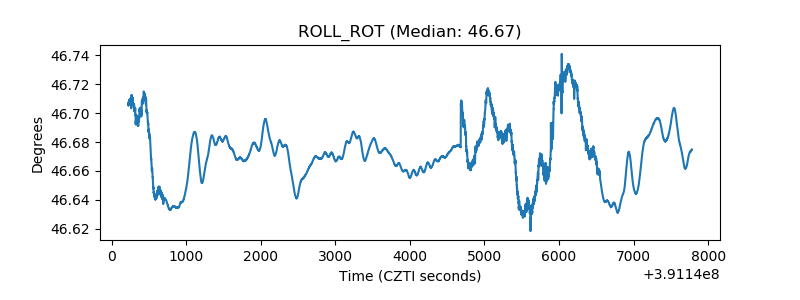 |
| _Roll_DEC | 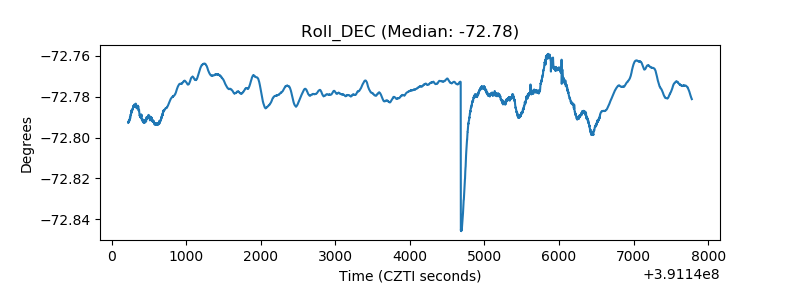 |
| _Roll_RA | 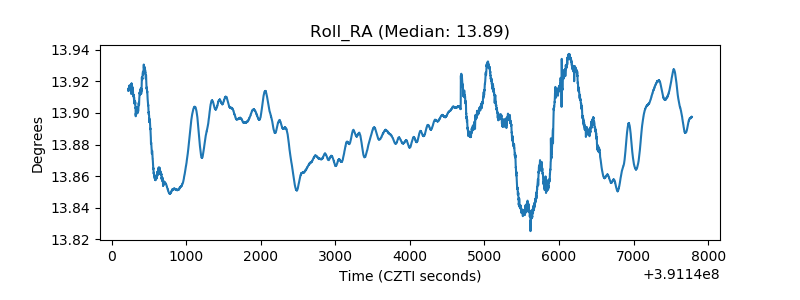 |
| Veto Counter | 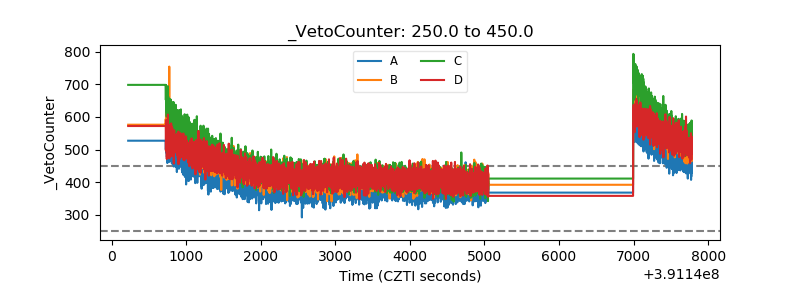 |