| Param | Original file | Final file |
|---|---|---|
| Filename | modeM0/AS1A11_050T19_9000005156_35979cztM0_level2.evt | modeM0/AS1A11_050T19_9000005156_35979cztM0_level2_quad_clean.evt |
| Size (bytes) | 870,621,120 | 81,336,960 |
| Size | 830.3 MB | 77.6 MB |
| Events in quadrant A | 2,599,177 | 667,251 |
| Events in quadrant B | 14,322,501 | 184,693 |
| Events in quadrant C | 3,726,087 | 630,327 |
| Events in quadrant D | 5,353,571 | 598,434 |
| Mode M0 | |||
|---|---|---|---|
| Quadrant | BADHDUFLAG | Total packets | Discarded packets |
| A | 0 | 11235 | 3 |
| B | 0 | 46246 | 2 |
| C | 0 | 14652 | 2 |
| D | 0 | 19592 | 2 |
| Mode SS | |||
|---|---|---|---|
| Quadrant | BADHDUFLAG | Total packets | Discarded packets |
| A | 0 | 110 | 0 |
| B | 0 | 110 | 0 |
| C | 0 | 110 | 0 |
| D | 0 | 110 | 0 |
| Mode M9 | |||
|---|---|---|---|
| Quadrant | BADHDUFLAG | Total packets | Discarded packets |
| A | 0 | 16 | 0 |
| B | 0 | 16 | 0 |
| C | 0 | 16 | 0 |
| D | 0 | 17 | 0 |
| Quadrant | Total seconds | Saturated seconds | Saturation percentage |
|---|---|---|---|
| A | 5420 | 12 | 0.221402% |
| B | 5420 | 5417 | 99.944649% |
| C | 5420 | 339 | 6.254613% |
| D | 5420 | 566 | 10.442804% |
Noise dominated data is calculated using 1-second bins in cleaned event files. If a bin has >2000 counts, and if more than 50% of those come from <1% of pixels, then it is considered to be noise-dominated and hence unusable.
| Quadrant | # 1 sec bins | Bins with >0 counts | Bins with >2000 counts | High rate bins dominated by noise | Noise dominated (total time) | Noise dominated (detector-on time) | Marked lightcurve |
|---|---|---|---|---|---|---|---|
| A | 6764 | 5421 | 1 | 1 | 0.01% | 0.02% | 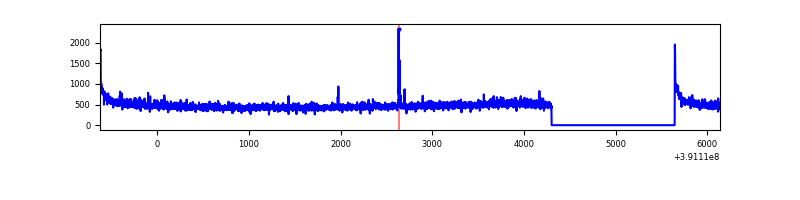 |
| B | 6763 | 5419 | 5307 | 5307 | 78.47% | 97.93% | 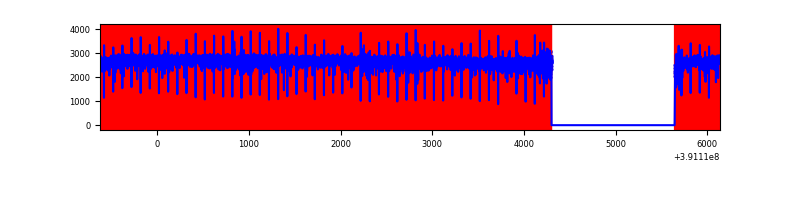 |
| C | 6764 | 5420 | 261 | 261 | 3.86% | 4.82% | 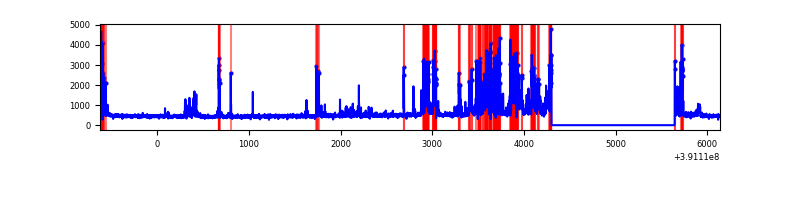 |
| D | 6764 | 5421 | 522 | 522 | 7.72% | 9.63% |  |
Top three noisy pixels from each quadrant. If the there are fewer than three noisy pixels in the level2.evt file, extra rows are filled as -1
| Pixel properties | Quadrant properties | ||||||
|---|---|---|---|---|---|---|---|
| Quadrant | DetID | PixID | Counts | Sigma | Mean | Median | Sigma |
| A | 10 | 83 | 170692 | 1371.76 | 612 | 599 | 124.0 |
| A | 15 | 169 | 48525 | 386.51 | 612 | 599 | 124.0 |
| A | 13 | 6 | 10214 | 77.54 | 612 | 599 | 124.0 |
| B | 5 | 31 | 6778573 | 166398.14 | 207 | 201 | 40.7 |
| B | 5 | 15 | 5136178 | 126079.98 | 207 | 201 | 40.7 |
| B | 5 | 14 | 960967 | 23585.26 | 207 | 201 | 40.7 |
| C | 9 | 187 | 1041997 | 7760.13 | 575 | 577 | 134.2 |
| C | 15 | 214 | 223406 | 1660.41 | 575 | 577 | 134.2 |
| C | 0 | 10 | 143866 | 1067.72 | 575 | 577 | 134.2 |
| D | 1 | 52 | 1377979 | 9735.95 | 573 | 555 | 141.5 |
| D | 12 | 17 | 1009951 | 7134.64 | 573 | 555 | 141.5 |
| D | 8 | 195 | 232851 | 1641.92 | 573 | 555 | 141.5 |
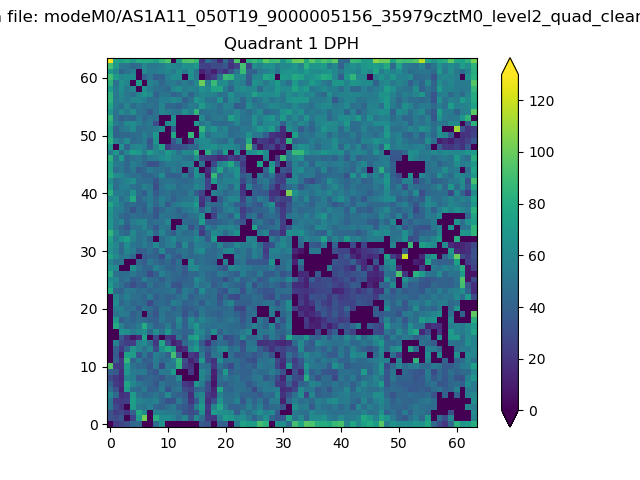
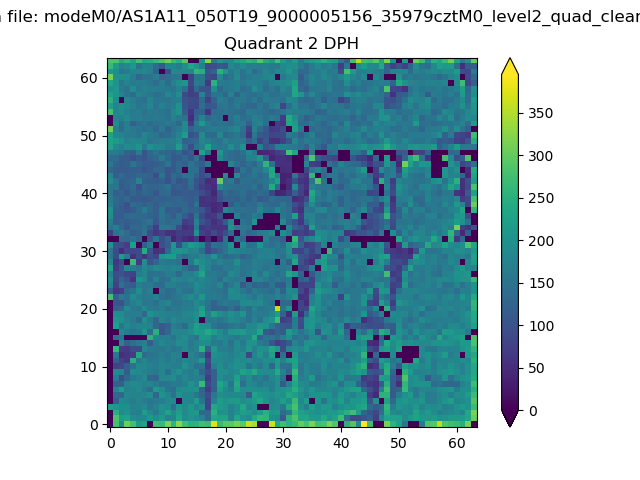
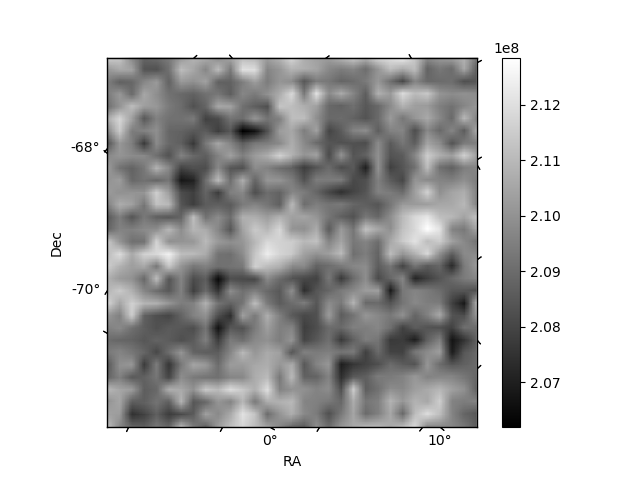
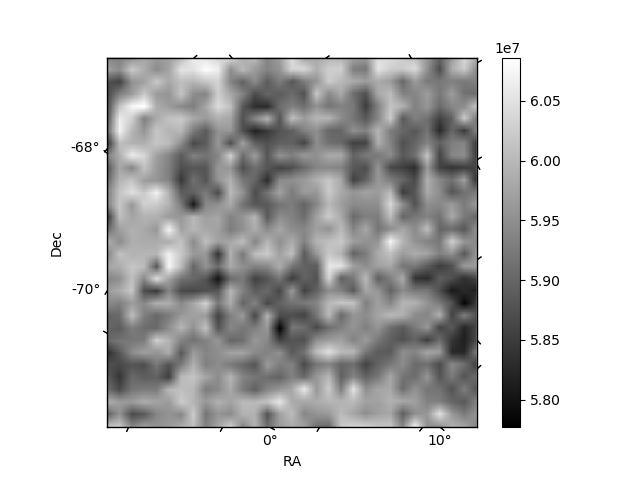
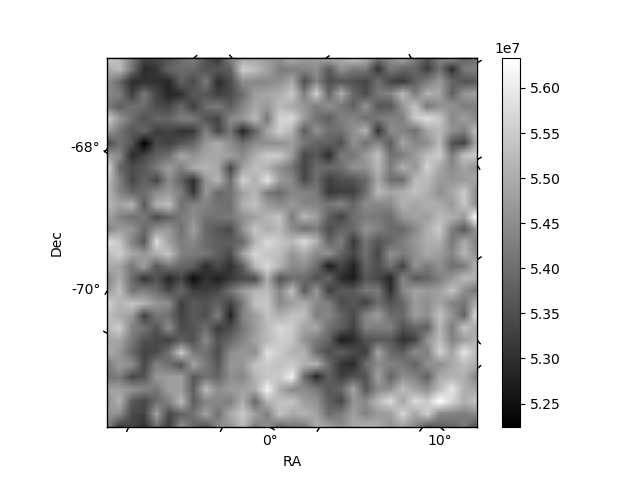
Histogram calculated using DETX and DETY for each event in the final _common_clean file
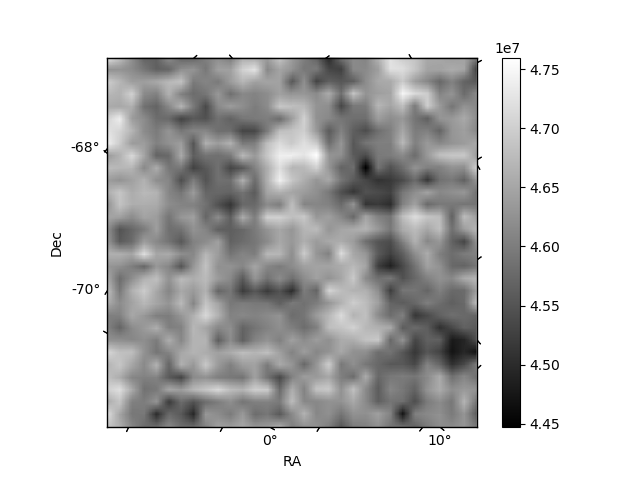
| Quadrant A | 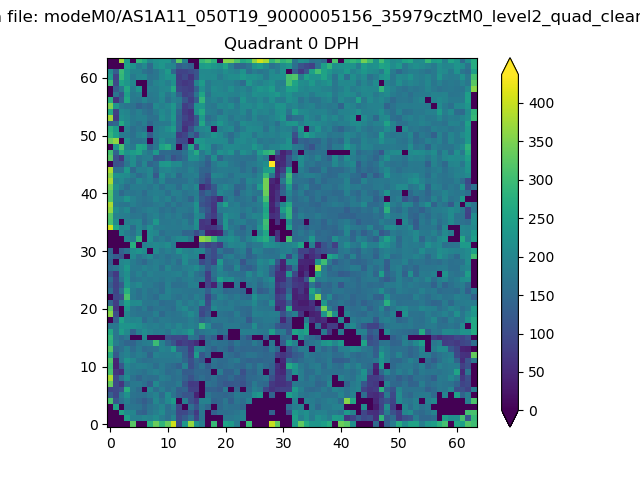 |
 |
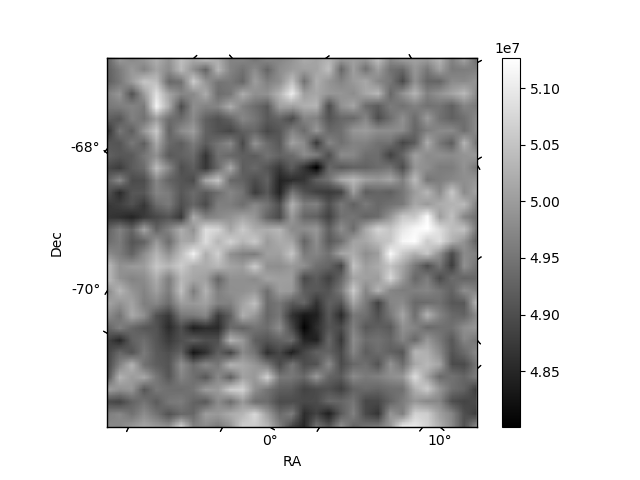
Quadrant B |
|---|---|---|---|
| Quadrant D | 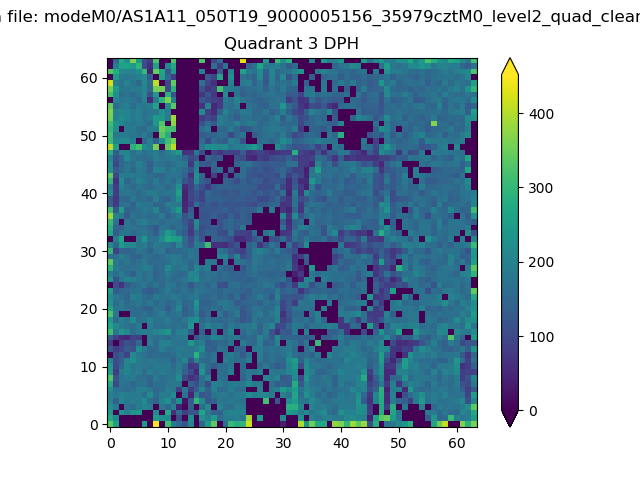 |
 |
Quadrant C |
| Plot type | Count rate plots | Images |
|---|---|---|
| Comparison with Poisson distribution Blue bars denote a histogram of data divided into 1 sec bins. Red curve is a Poisson curve with rate = median count rate of data. |
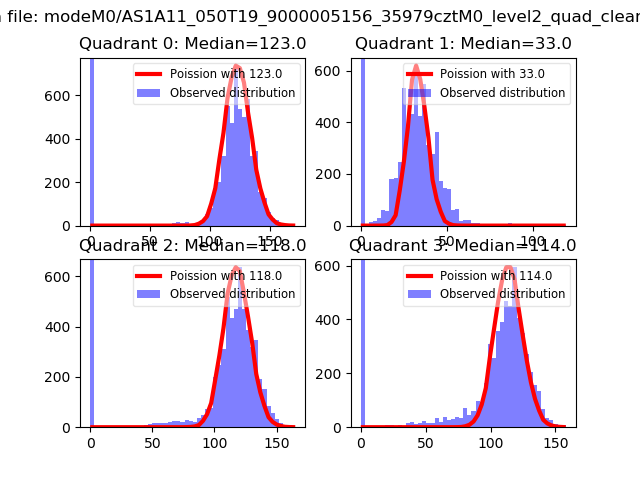 |
 |
| Quadrant-wise count rates Data is divided into 100 sec bins |
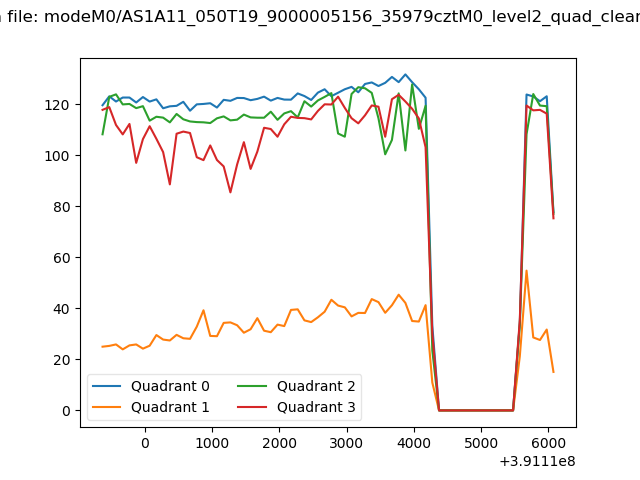 |
|
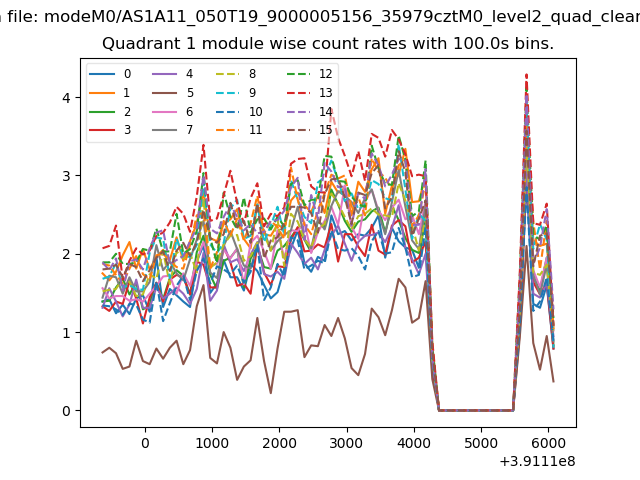
| Module-wise count rates for Quadrant A Data is divided into 100 sec bins |
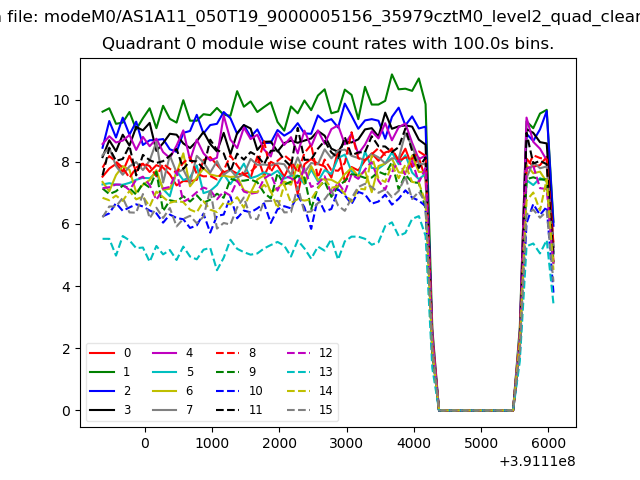 |
 |
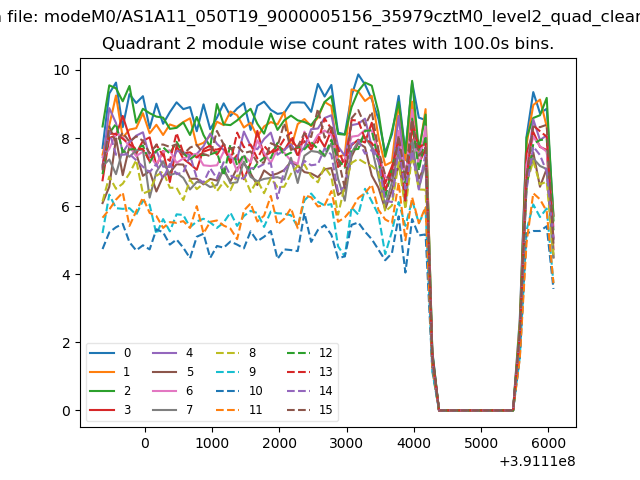
| Module-wise count rates for Quadrant B Data is divided into 100 sec bins |
 |
 |
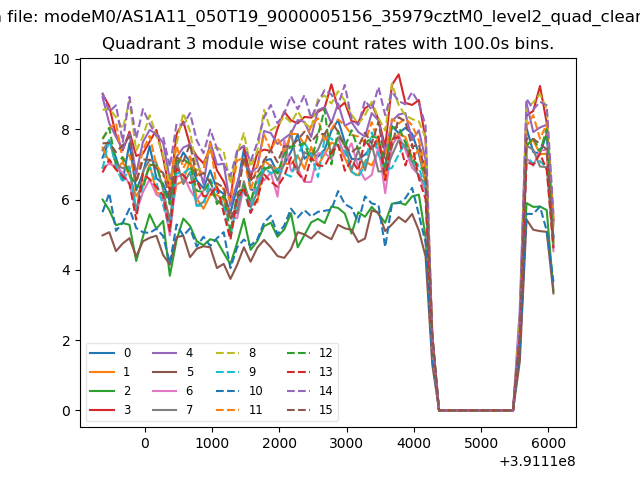
| Module-wise count rates for Quadrant C Data is divided into 100 sec bins |
 |
 |
| Module-wise count rates for Quadrant D Data is divided into 100 sec bins |
 |
 |
| Parameter | Plot |
|---|---|
| CZT HV Monitor | 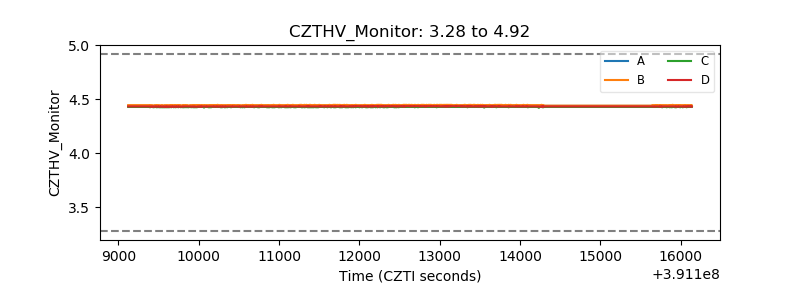 |
| D_VDD | 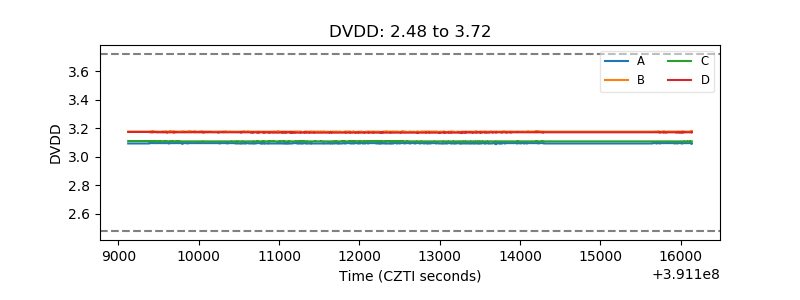 |
| Temperature 1 | 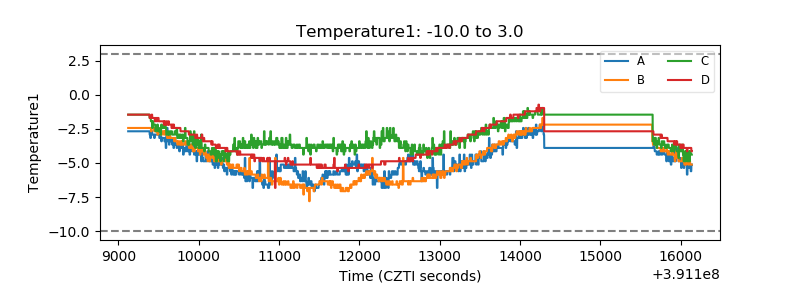 |
| Veto HV Monitor | 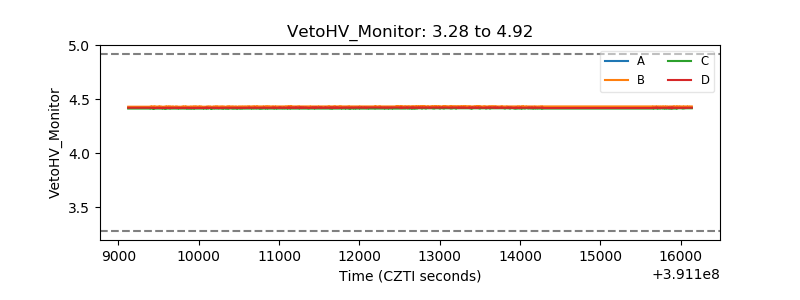 |
| Veto LLD | 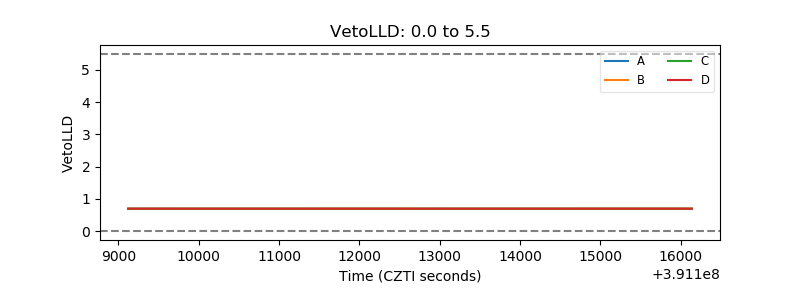 |
| Alpha Counter | 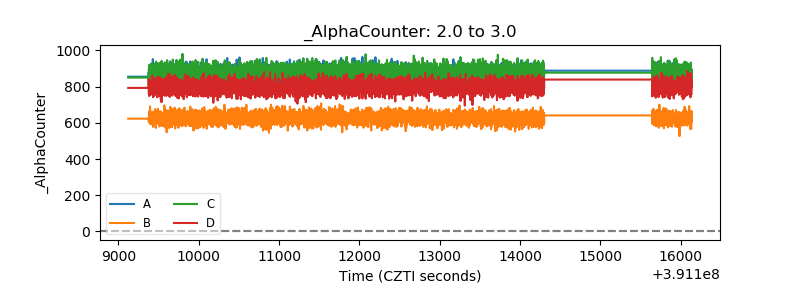 |
| _CPM_Rate | 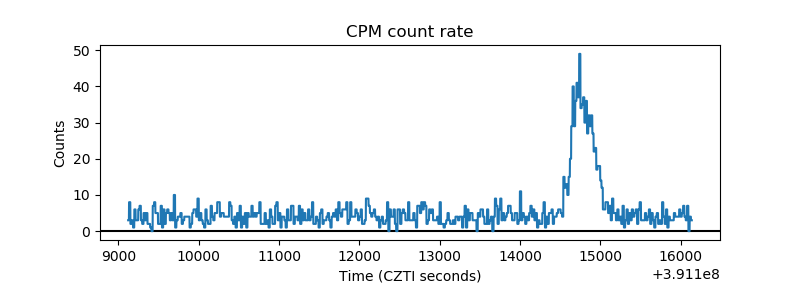 |
| CZT Counter | 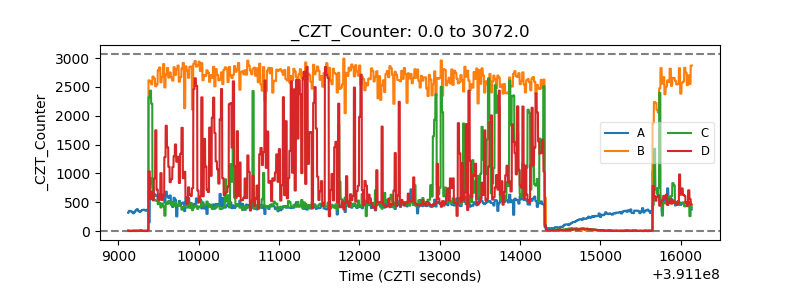 |
| +2.5 Volts monitor | 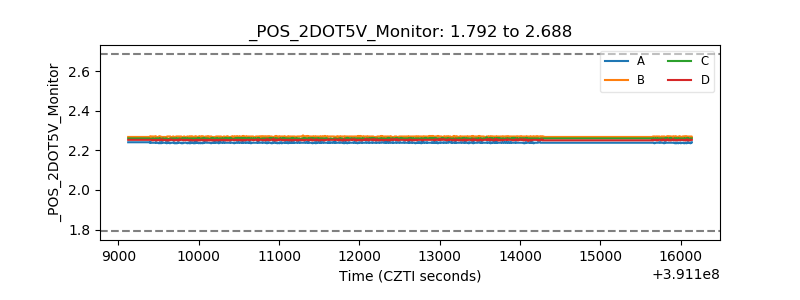 |
| +5 Volts monitor | 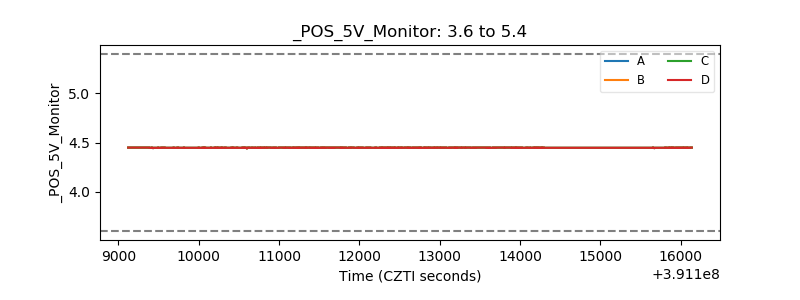 |
| _ROLL_ROT | 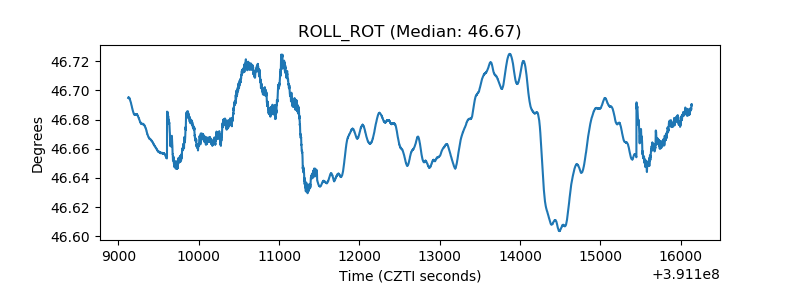 |
| _Roll_DEC | 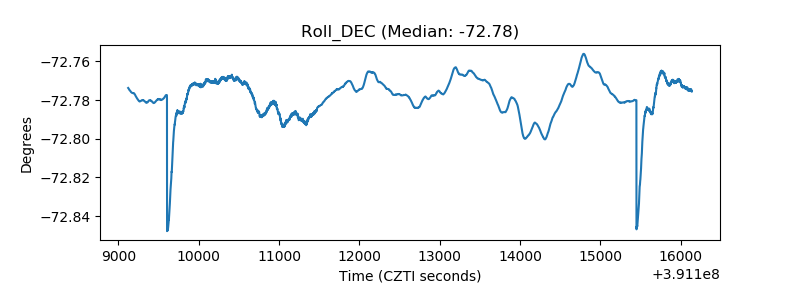 |
| _Roll_RA | 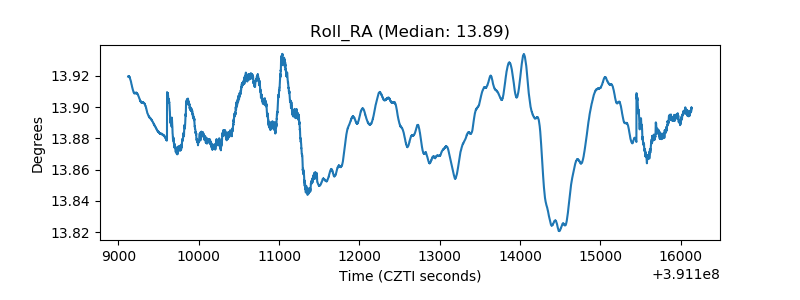 |
| Veto Counter | 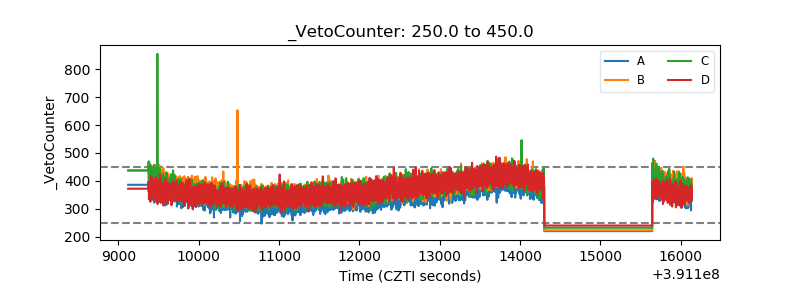 |