| Param | Original file | Final file |
|---|---|---|
| Filename | modeM0/AS1A11_050T19_9000005156_35975cztM0_level2.evt | modeM0/AS1A11_050T19_9000005156_35975cztM0_level2_quad_clean.evt |
| Size (bytes) | 848,488,320 | 78,618,240 |
| Size | 809.2 MB | 75.0 MB |
| Events in quadrant A | 2,433,791 | 654,072 |
| Events in quadrant B | 13,971,219 | 171,389 |
| Events in quadrant C | 4,921,093 | 574,485 |
| Events in quadrant D | 4,017,175 | 611,041 |
| Mode M0 | |||
|---|---|---|---|
| Quadrant | BADHDUFLAG | Total packets | Discarded packets |
| A | 0 | 10668 | 2 |
| B | 0 | 45082 | 1 |
| C | 0 | 18115 | 1 |
| D | 0 | 15390 | 1 |
| Mode SS | |||
|---|---|---|---|
| Quadrant | BADHDUFLAG | Total packets | Discarded packets |
| A | 0 | 106 | 0 |
| B | 0 | 106 | 0 |
| C | 0 | 106 | 0 |
| D | 0 | 106 | 0 |
| Mode M9 | |||
|---|---|---|---|
| Quadrant | BADHDUFLAG | Total packets | Discarded packets |
| A | 0 | 16 | 0 |
| B | 0 | 16 | 0 |
| C | 0 | 16 | 0 |
| D | 0 | 16 | 0 |
| Quadrant | Total seconds | Saturated seconds | Saturation percentage |
|---|---|---|---|
| A | 5241 | 4 | 0.076321% |
| B | 5241 | 5241 | 100.000000% |
| C | 5241 | 858 | 16.370922% |
| D | 5241 | 257 | 4.903644% |
Noise dominated data is calculated using 1-second bins in cleaned event files. If a bin has >2000 counts, and if more than 50% of those come from <1% of pixels, then it is considered to be noise-dominated and hence unusable.
| Quadrant | # 1 sec bins | Bins with >0 counts | Bins with >2000 counts | High rate bins dominated by noise | Noise dominated (total time) | Noise dominated (detector-on time) | Marked lightcurve |
|---|---|---|---|---|---|---|---|
| A | 6824 | 5242 | 0 | 0 | 0.00% | 0.00% | 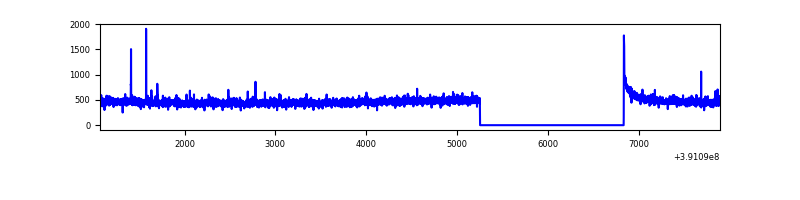 |
| B | 6823 | 5240 | 5171 | 5171 | 75.79% | 98.68% | 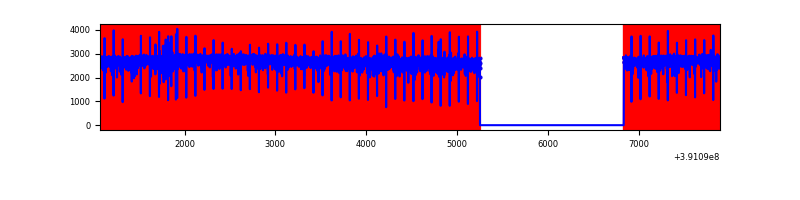 |
| C | 6824 | 5242 | 750 | 750 | 10.99% | 14.31% | 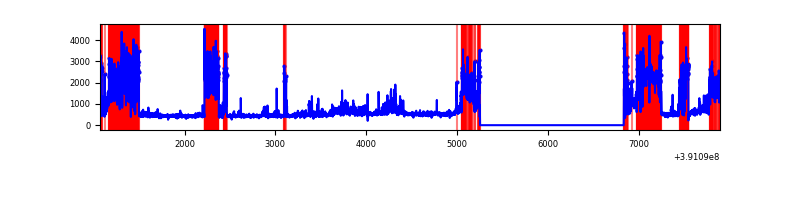 |
| D | 6824 | 5242 | 255 | 255 | 3.74% | 4.86% | 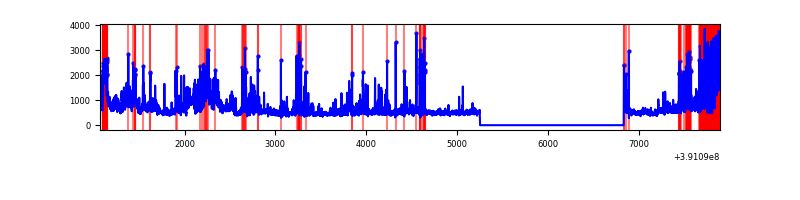 |
Top three noisy pixels from each quadrant. If the there are fewer than three noisy pixels in the level2.evt file, extra rows are filled as -1
| Pixel properties | Quadrant properties | ||||||
|---|---|---|---|---|---|---|---|
| Quadrant | DetID | PixID | Counts | Sigma | Mean | Median | Sigma |
| A | 10 | 83 | 130124 | 1087.96 | 586 | 576 | 119.1 |
| A | 15 | 169 | 19768 | 161.18 | 586 | 576 | 119.1 |
| A | 13 | 254 | 8306 | 64.92 | 586 | 576 | 119.1 |
| B | 5 | 31 | 5991626 | 163221.6 | 186 | 181 | 36.7 |
| B | 5 | 15 | 5172392 | 140903.66 | 186 | 181 | 36.7 |
| B | 5 | 14 | 1581203 | 43070.9 | 186 | 181 | 36.7 |
| C | 9 | 187 | 2621649 | 21972.39 | 514 | 518 | 119.3 |
| C | 15 | 214 | 195261 | 1632.49 | 514 | 518 | 119.3 |
| C | 0 | 10 | 88237 | 735.33 | 514 | 518 | 119.3 |
| D | 1 | 52 | 544531 | 3967.67 | 560 | 543 | 137.1 |
| D | 13 | 249 | 509386 | 3711.33 | 560 | 543 | 137.1 |
| D | 12 | 17 | 291485 | 2122.04 | 560 | 543 | 137.1 |
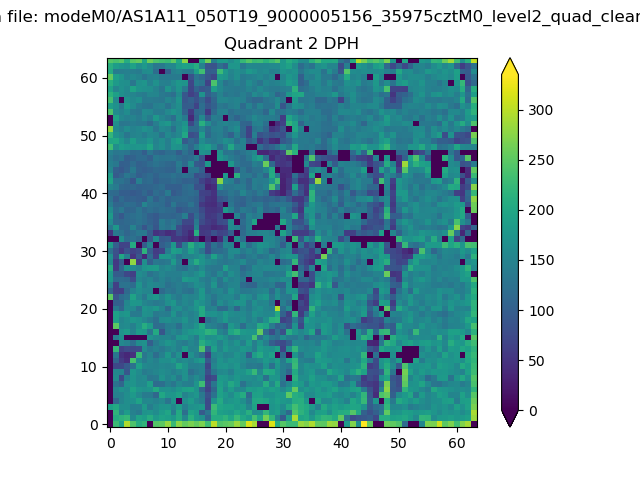
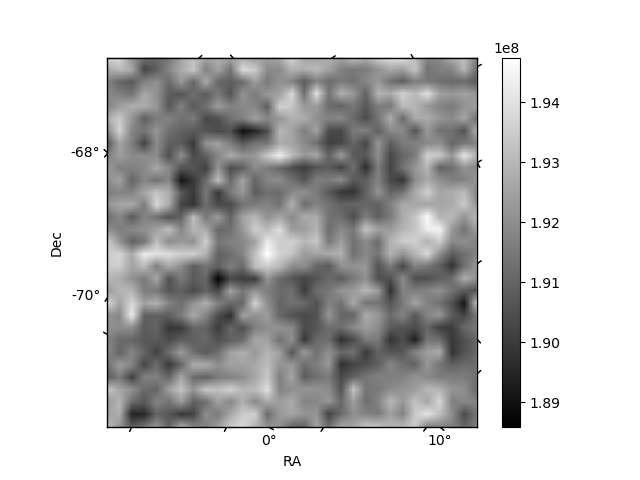
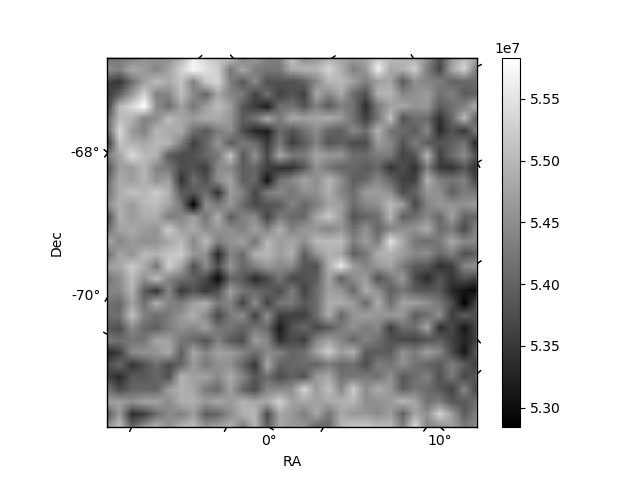
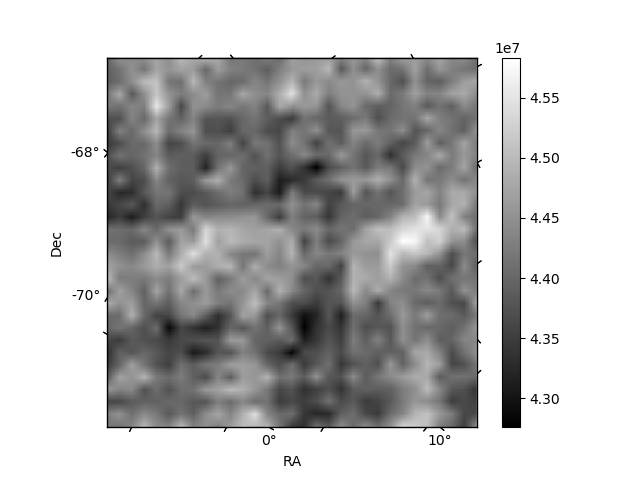
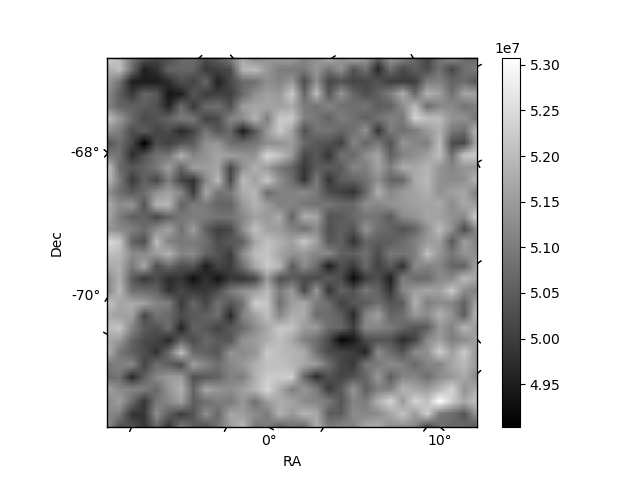
Histogram calculated using DETX and DETY for each event in the final _common_clean file
| Quadrant A | 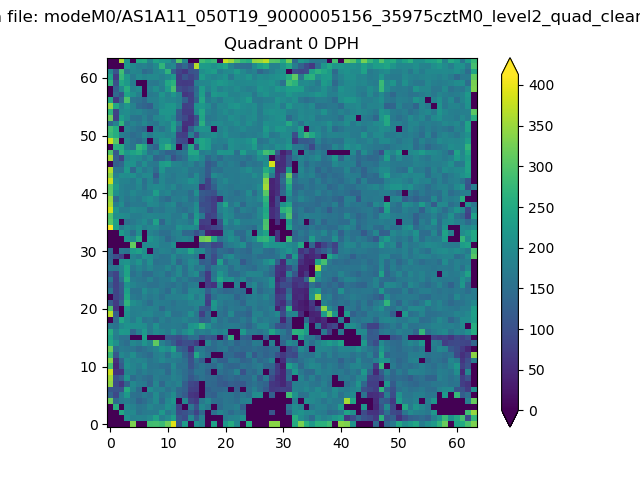 |
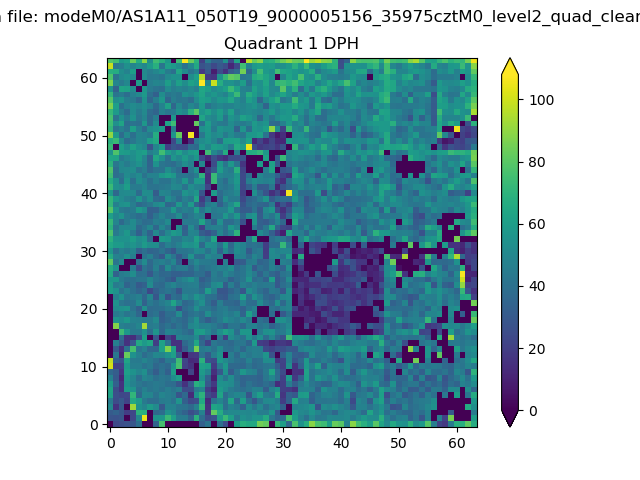 |
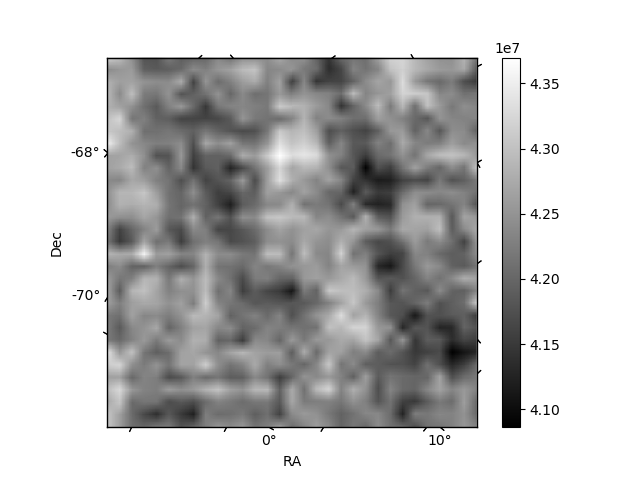
Quadrant B |
|---|---|---|---|
| Quadrant D | 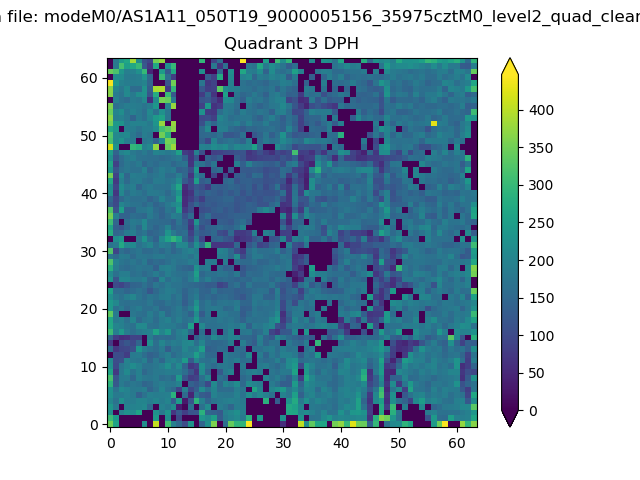 |
 |
Quadrant C |
| Plot type | Count rate plots | Images |
|---|---|---|
| Comparison with Poisson distribution Blue bars denote a histogram of data divided into 1 sec bins. Red curve is a Poisson curve with rate = median count rate of data. |
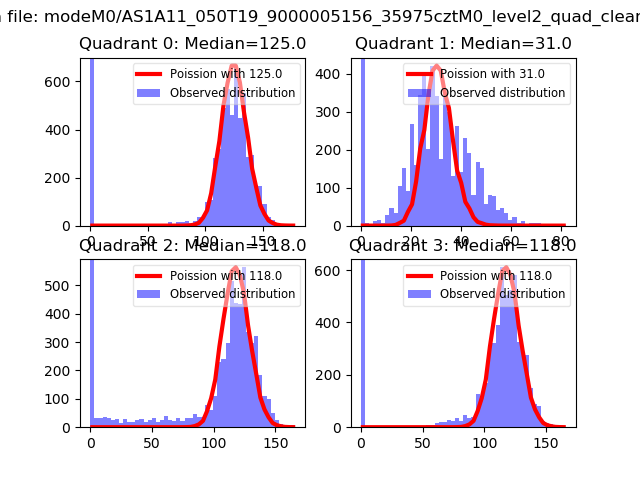 |
 |
| Quadrant-wise count rates Data is divided into 100 sec bins |
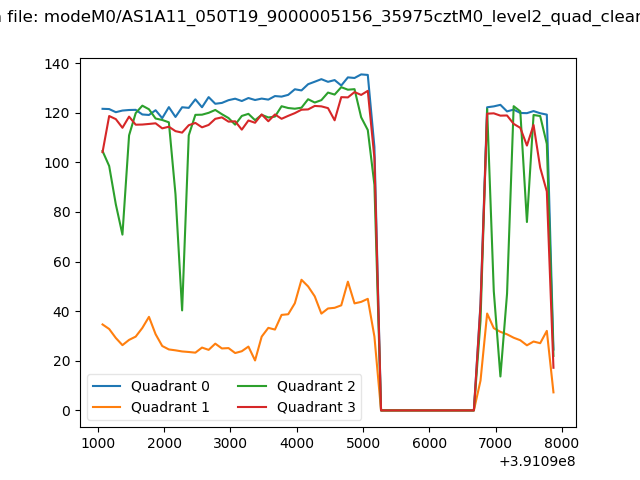 |
|
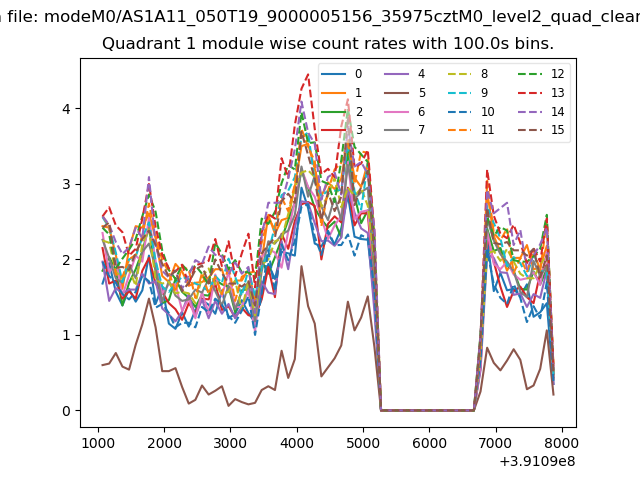
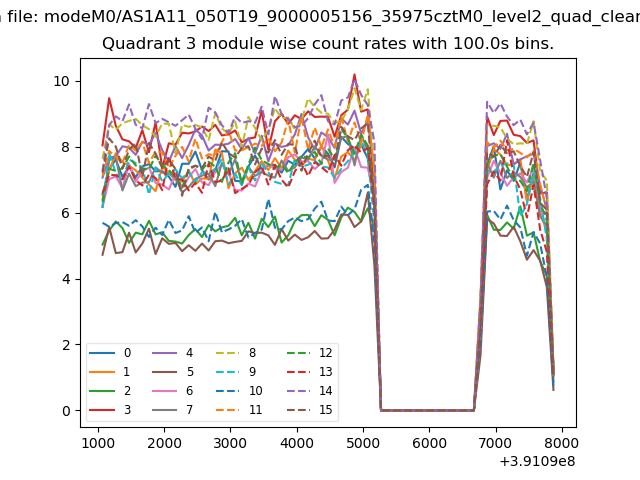
| Module-wise count rates for Quadrant A Data is divided into 100 sec bins |
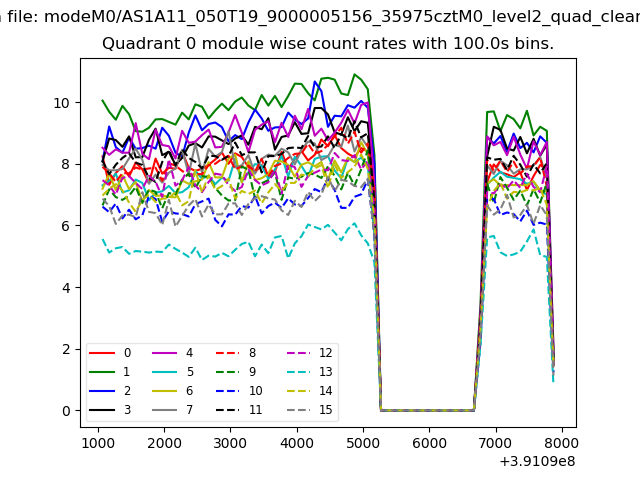 |
 |
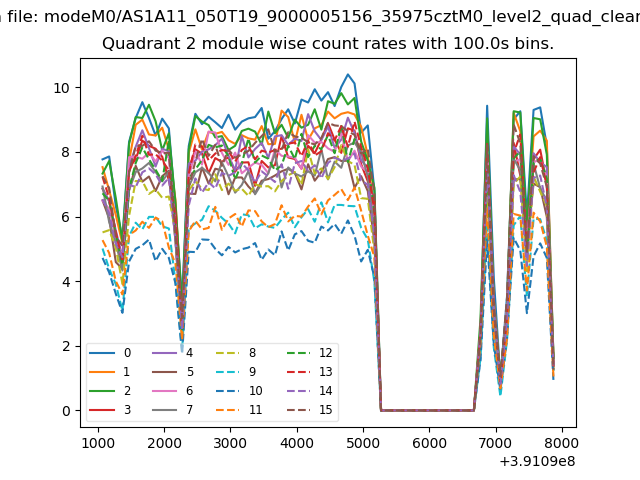
| Module-wise count rates for Quadrant B Data is divided into 100 sec bins |
 |
 |
| Module-wise count rates for Quadrant C Data is divided into 100 sec bins |
 |
 |
| Module-wise count rates for Quadrant D Data is divided into 100 sec bins |
 |
 |
| Parameter | Plot |
|---|---|
| CZT HV Monitor | 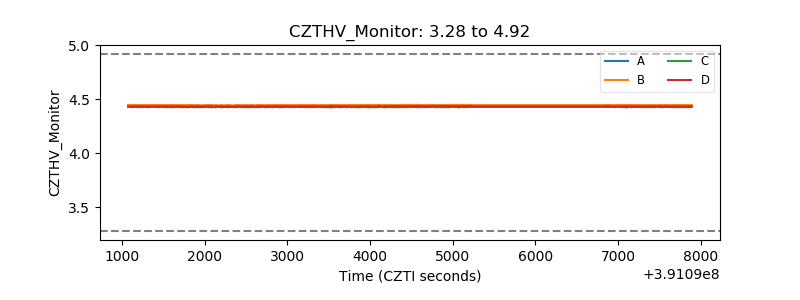 |
| D_VDD | 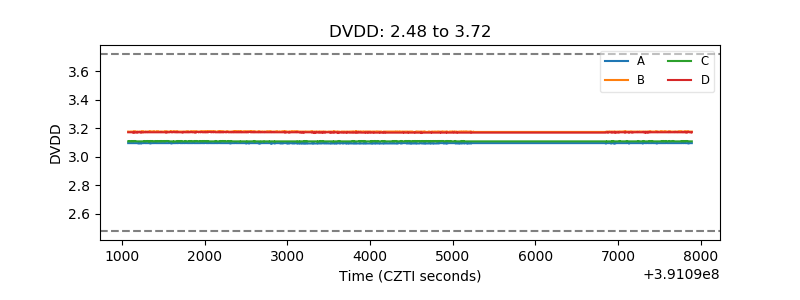 |
| Temperature 1 | 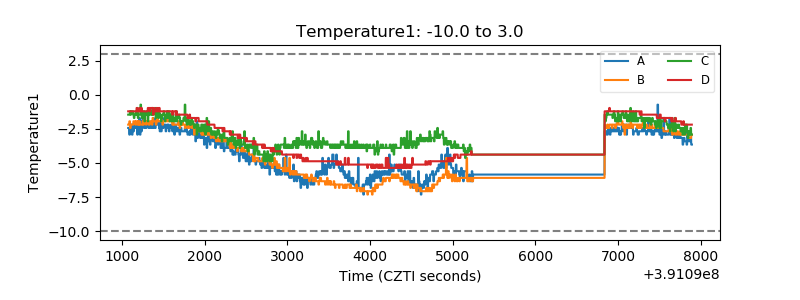 |
| Veto HV Monitor |  |
| Veto LLD | 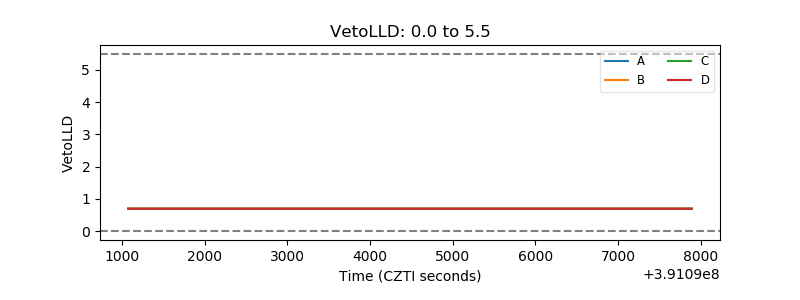 |
| Alpha Counter | 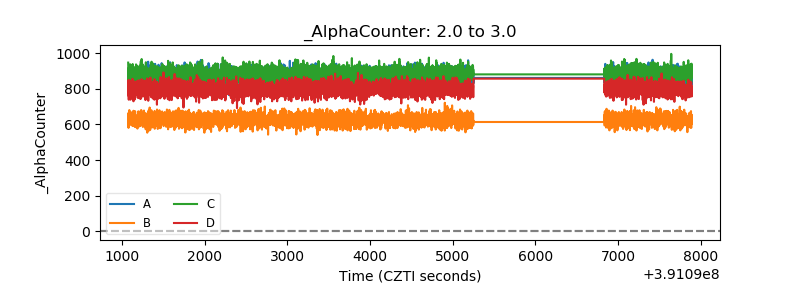 |
| _CPM_Rate | 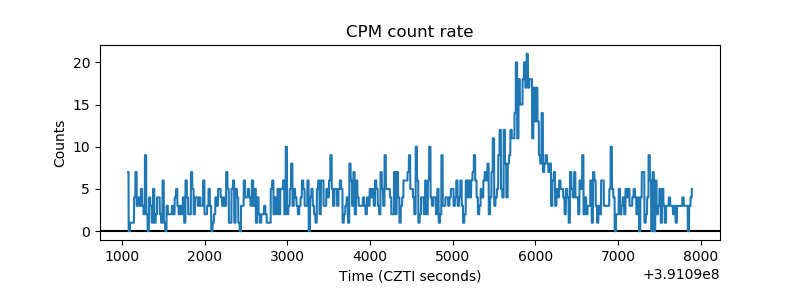 |
| CZT Counter | 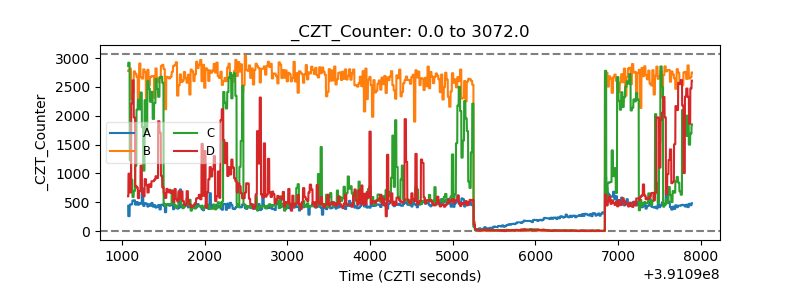 |
| +2.5 Volts monitor | 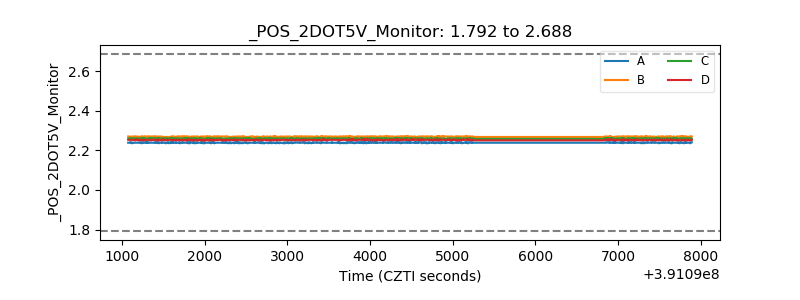 |
| +5 Volts monitor | 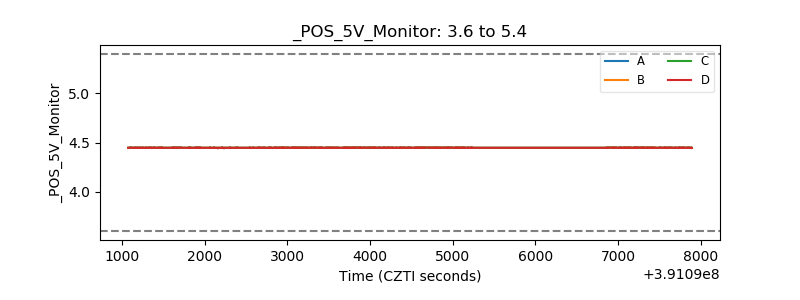 |
| _ROLL_ROT | 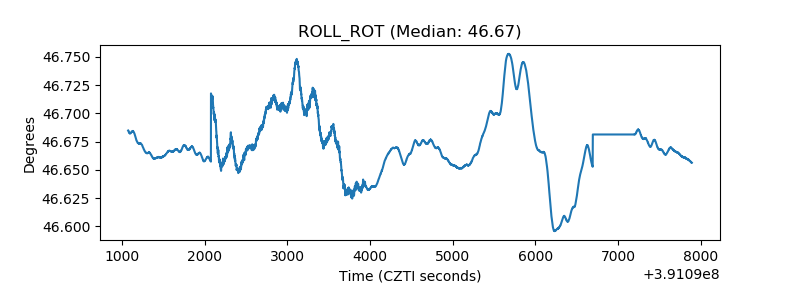 |
| _Roll_DEC | 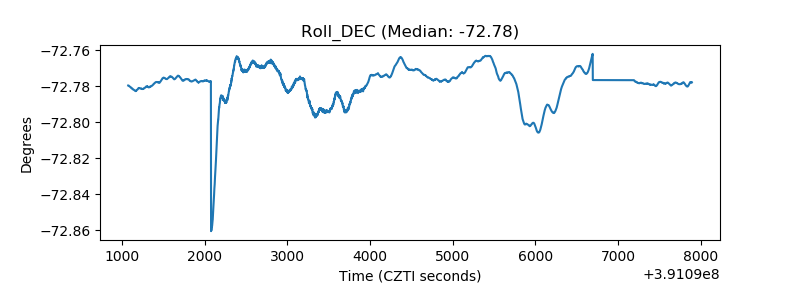 |
| _Roll_RA | 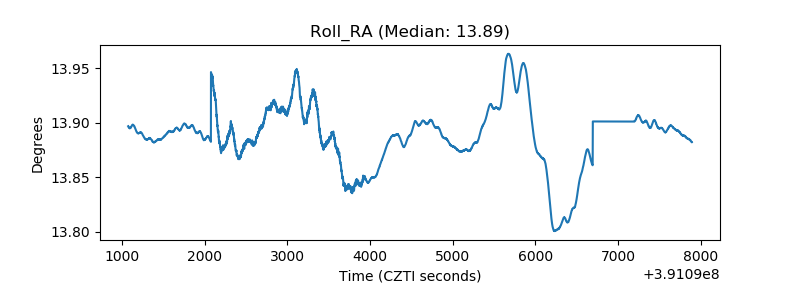 |
| Veto Counter | 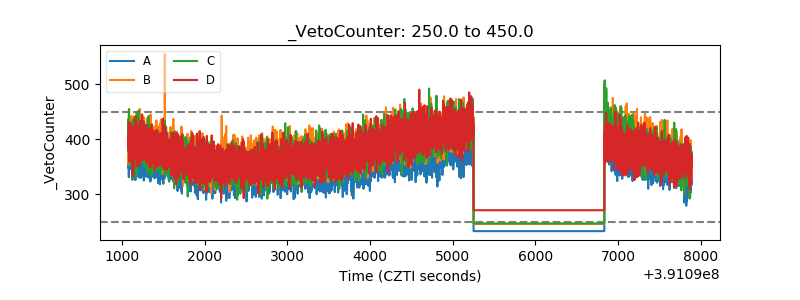 |