| Param | Original file | Final file |
|---|---|---|
| Filename | modeM0/AS1A11_050T19_9000005156_35974cztM0_level2.evt | modeM0/AS1A11_050T19_9000005156_35974cztM0_level2_quad_clean.evt |
| Size (bytes) | 980,982,720 | 82,350,720 |
| Size | 935.5 MB | 78.5 MB |
| Events in quadrant A | 2,549,790 | 684,616 |
| Events in quadrant B | 13,824,342 | 231,703 |
| Events in quadrant C | 6,791,256 | 584,725 |
| Events in quadrant D | 6,184,227 | 614,433 |
| Mode M0 | |||
|---|---|---|---|
| Quadrant | BADHDUFLAG | Total packets | Discarded packets |
| A | 0 | 10943 | 2 |
| B | 0 | 44733 | 1 |
| C | 0 | 23749 | 1 |
| D | 0 | 22195 | 1 |
| Mode SS | |||
|---|---|---|---|
| Quadrant | BADHDUFLAG | Total packets | Discarded packets |
| A | 0 | 110 | 0 |
| B | 0 | 110 | 0 |
| C | 0 | 110 | 0 |
| D | 0 | 110 | 0 |
| Mode M9 | |||
|---|---|---|---|
| Quadrant | BADHDUFLAG | Total packets | Discarded packets |
| A | 0 | 19 | 0 |
| B | 0 | 19 | 0 |
| C | 0 | 19 | 0 |
| D | 0 | 19 | 0 |
| Quadrant | Total seconds | Saturated seconds | Saturation percentage |
|---|---|---|---|
| A | 5353 | 6 | 0.112087% |
| B | 5353 | 5272 | 98.486830% |
| C | 5353 | 1352 | 25.256865% |
| D | 5353 | 665 | 12.422940% |
Noise dominated data is calculated using 1-second bins in cleaned event files. If a bin has >2000 counts, and if more than 50% of those come from <1% of pixels, then it is considered to be noise-dominated and hence unusable.
| Quadrant | # 1 sec bins | Bins with >0 counts | Bins with >2000 counts | High rate bins dominated by noise | Noise dominated (total time) | Noise dominated (detector-on time) | Marked lightcurve |
|---|---|---|---|---|---|---|---|
| A | 7295 | 5354 | 0 | 0 | 0.00% | 0.00% | 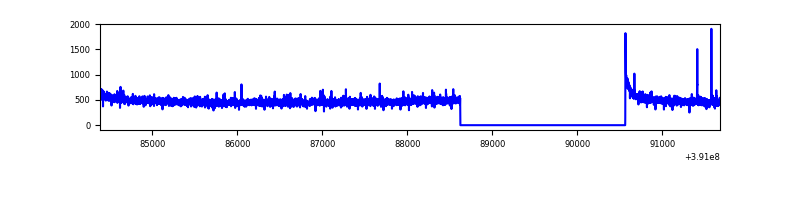 |
| B | 7294 | 5352 | 5077 | 5077 | 69.61% | 94.86% | 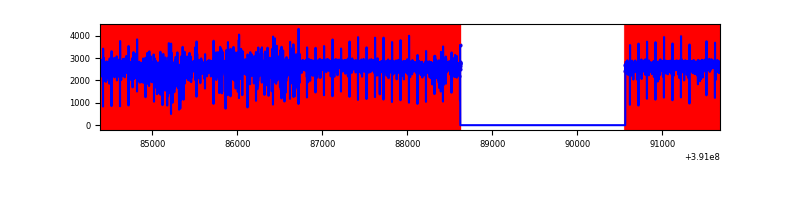 |
| C | 7295 | 5354 | 1229 | 1229 | 16.85% | 22.95% |  |
| D | 7295 | 5354 | 711 | 711 | 9.75% | 13.28% | 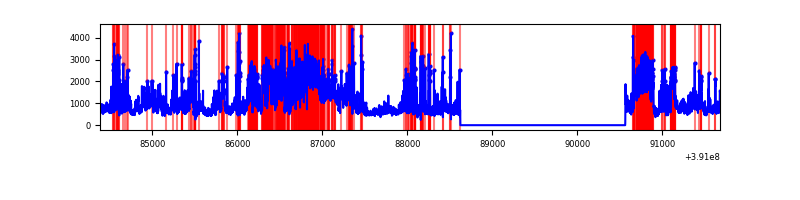 |
Top three noisy pixels from each quadrant. If the there are fewer than three noisy pixels in the level2.evt file, extra rows are filled as -1
| Pixel properties | Quadrant properties | ||||||
|---|---|---|---|---|---|---|---|
| Quadrant | DetID | PixID | Counts | Sigma | Mean | Median | Sigma |
| A | 10 | 83 | 146727 | 1188.27 | 610 | 598 | 123.0 |
| A | 15 | 169 | 29304 | 233.42 | 610 | 598 | 123.0 |
| A | 13 | 254 | 8741 | 66.21 | 610 | 598 | 123.0 |
| B | 5 | 31 | 6782272 | 142873.28 | 242 | 236 | 47.5 |
| B | 5 | 15 | 4589913 | 96688.11 | 242 | 236 | 47.5 |
| B | 5 | 14 | 861938 | 18152.98 | 242 | 236 | 47.5 |
| C | 9 | 187 | 4460633 | 37063.89 | 522 | 525 | 120.3 |
| C | 15 | 214 | 202280 | 1676.6 | 522 | 525 | 120.3 |
| C | 0 | 10 | 91894 | 759.28 | 522 | 525 | 120.3 |
| D | 1 | 52 | 2316814 | 16423.23 | 571 | 553 | 141.0 |
| D | 10 | 118 | 567957 | 4023.12 | 571 | 553 | 141.0 |
| D | 8 | 195 | 460551 | 3261.57 | 571 | 553 | 141.0 |
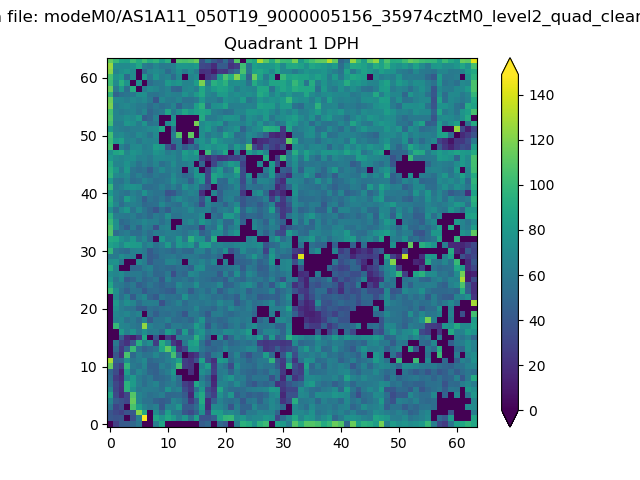
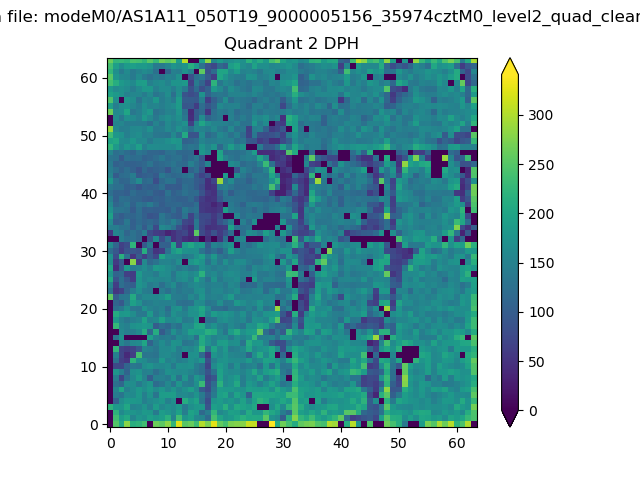
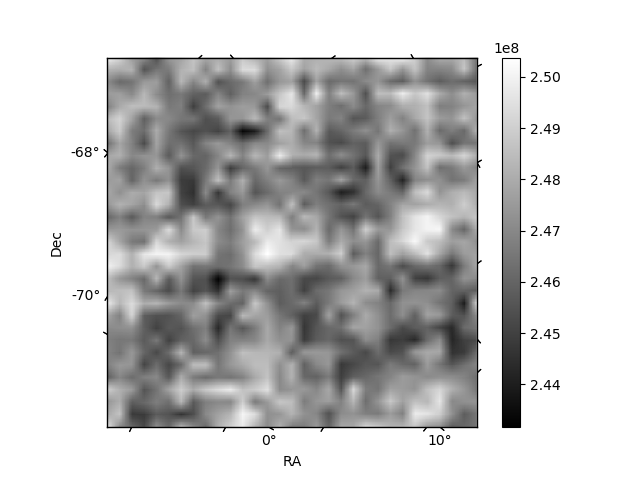
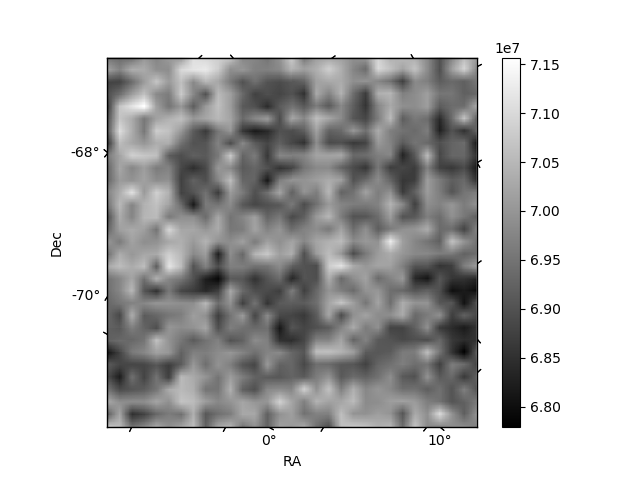
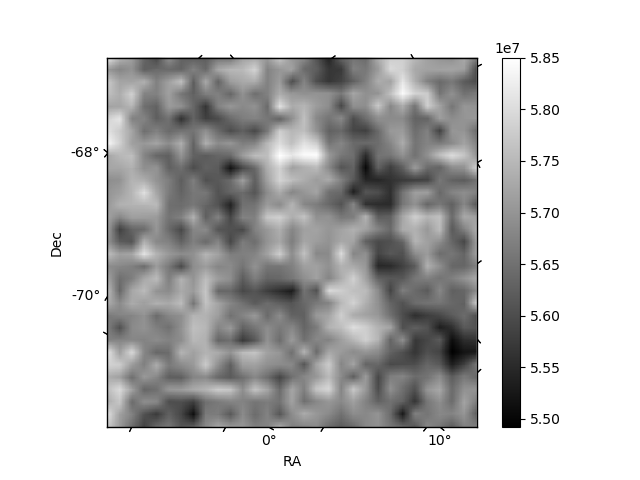
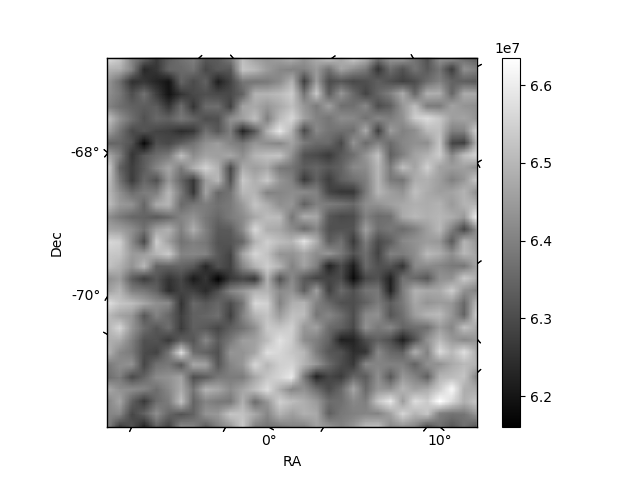
Histogram calculated using DETX and DETY for each event in the final _common_clean file
| Quadrant A | 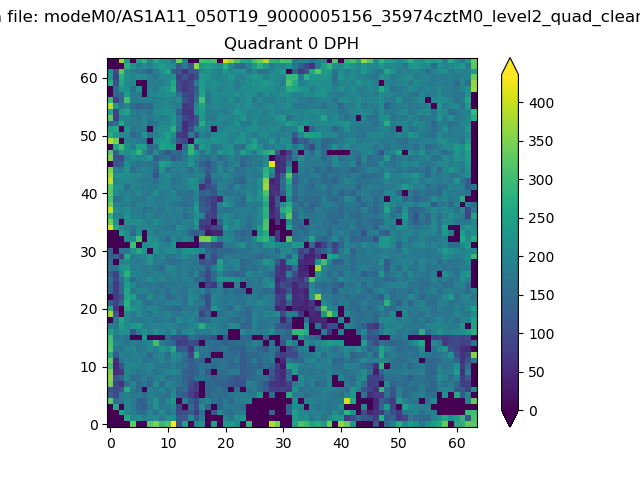 |
 |
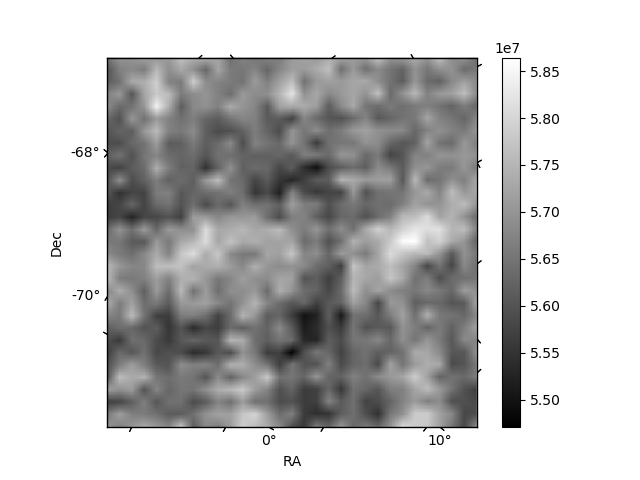
Quadrant B |
|---|---|---|---|
| Quadrant D | 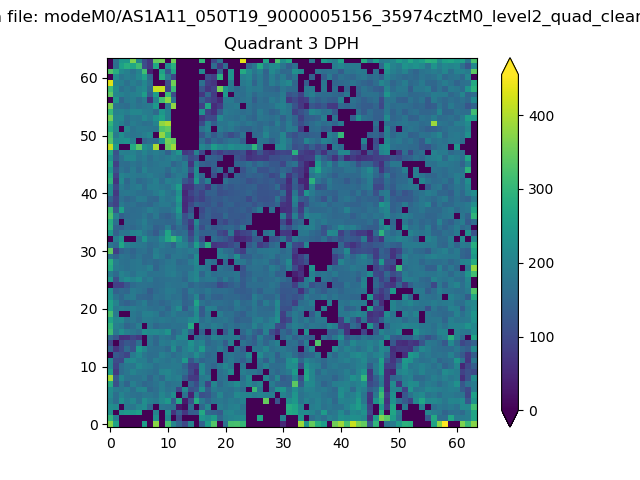 |
 |
Quadrant C |
| Plot type | Count rate plots | Images |
|---|---|---|
| Comparison with Poisson distribution Blue bars denote a histogram of data divided into 1 sec bins. Red curve is a Poisson curve with rate = median count rate of data. |
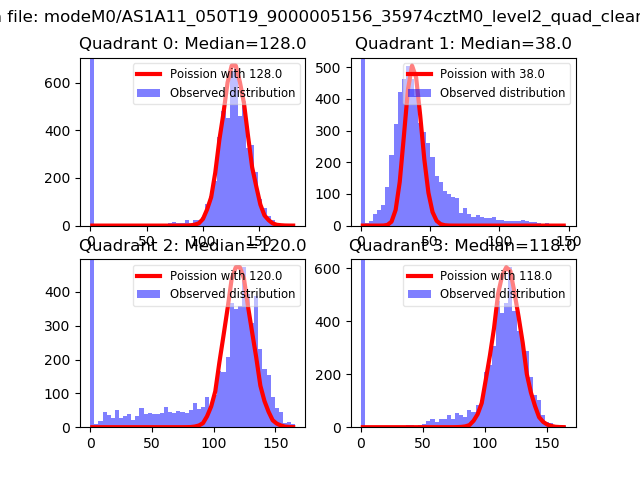 |
 |
| Quadrant-wise count rates Data is divided into 100 sec bins |
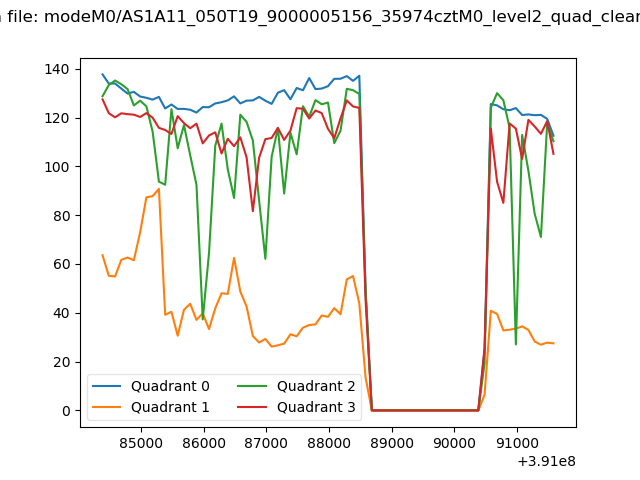 |
|
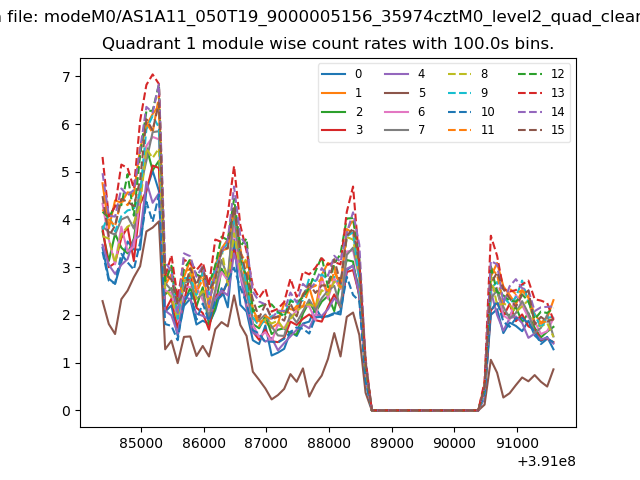
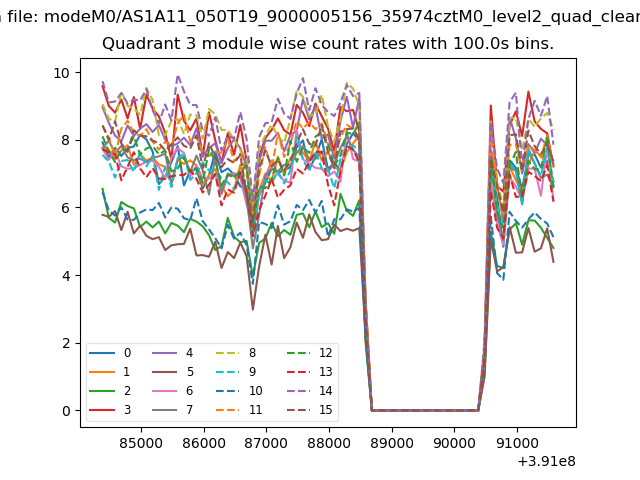
| Module-wise count rates for Quadrant A Data is divided into 100 sec bins |
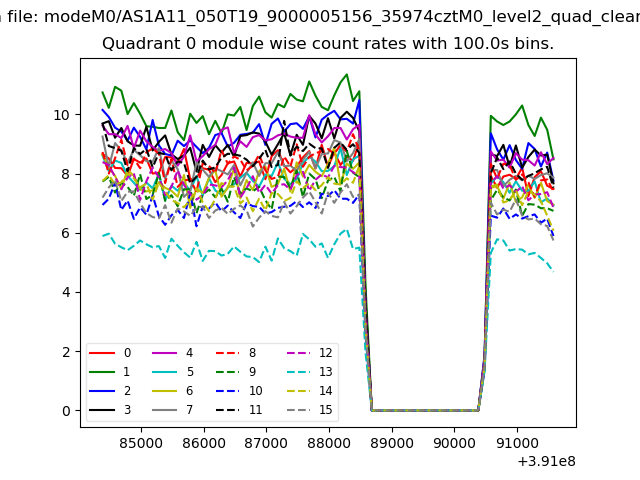 |
 |
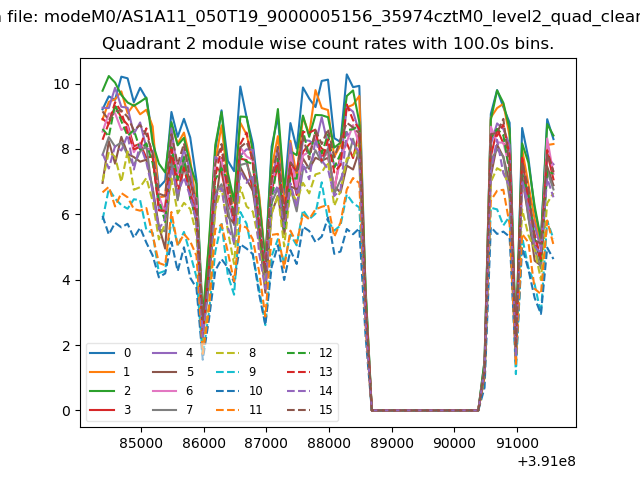
| Module-wise count rates for Quadrant B Data is divided into 100 sec bins |
 |
 |
| Module-wise count rates for Quadrant C Data is divided into 100 sec bins |
 |
 |
| Module-wise count rates for Quadrant D Data is divided into 100 sec bins |
 |
 |
| Parameter | Plot |
|---|---|
| CZT HV Monitor | 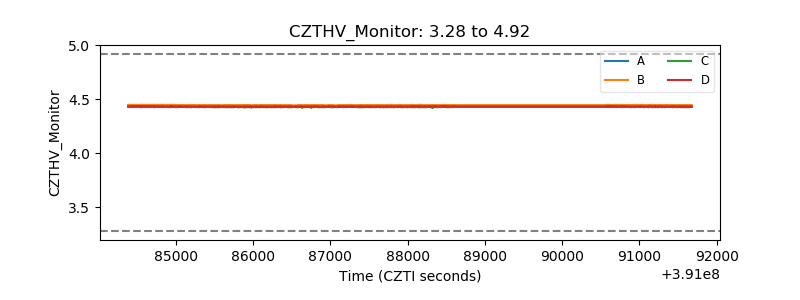 |
| D_VDD | 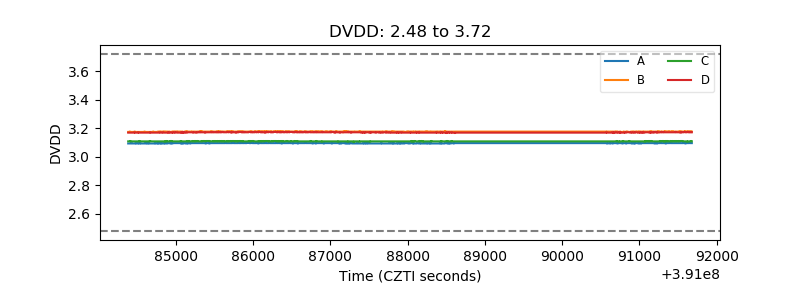 |
| Temperature 1 | 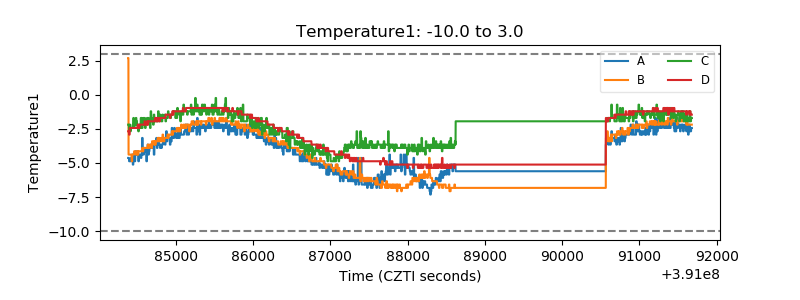 |
| Veto HV Monitor | 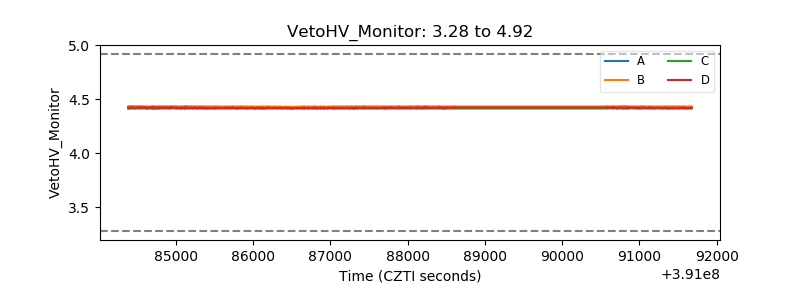 |
| Veto LLD |  |
| Alpha Counter | 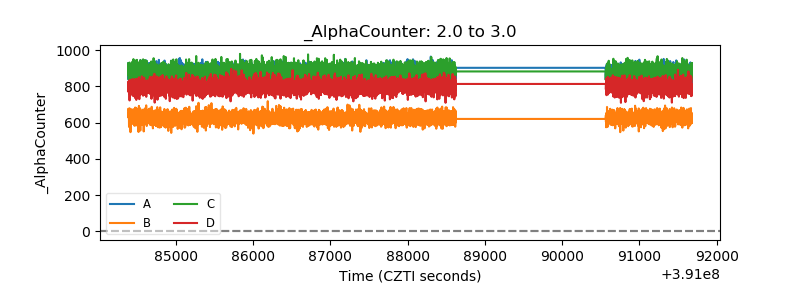 |
| _CPM_Rate | 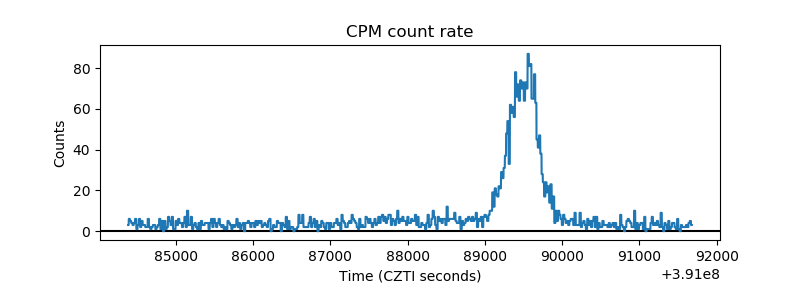 |
| CZT Counter | 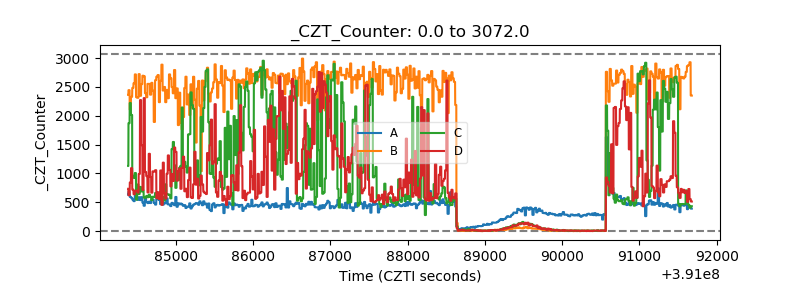 |
| +2.5 Volts monitor | 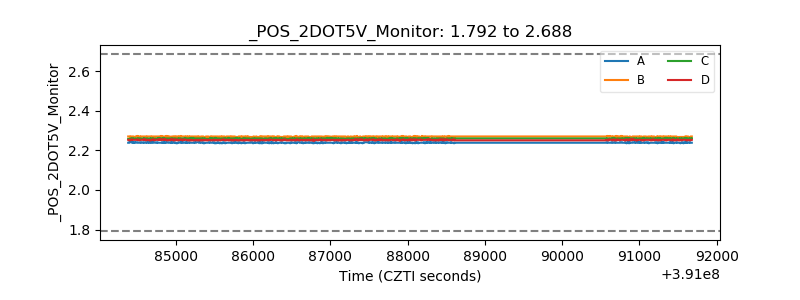 |
| +5 Volts monitor | 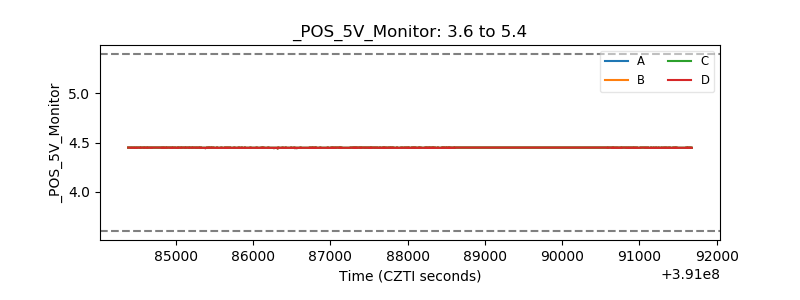 |
| _ROLL_ROT | 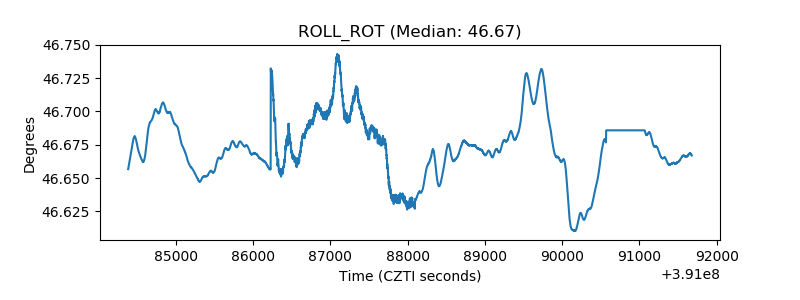 |
| _Roll_DEC | 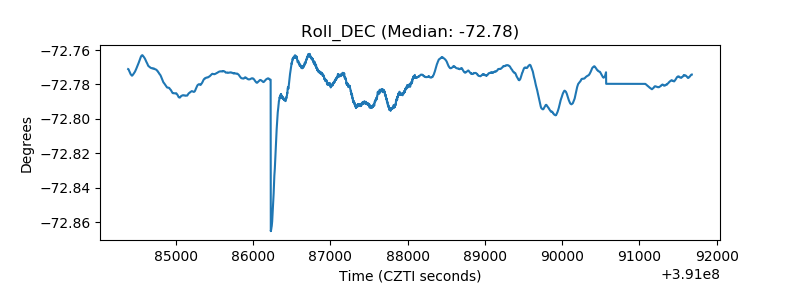 |
| _Roll_RA | 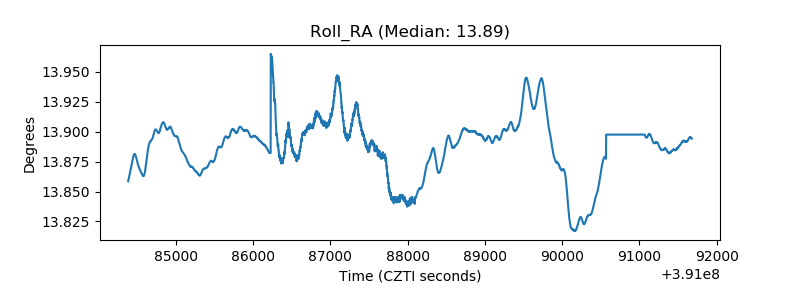 |
| Veto Counter | 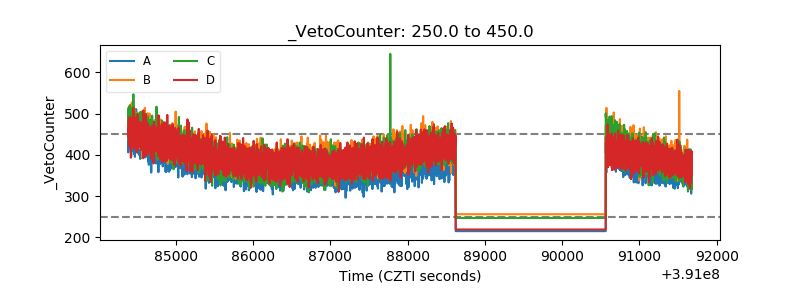 |