| Param | Original file | Final file |
|---|---|---|
| Filename | modeM0/AS1A11_050T19_9000005156_35973cztM0_level2.evt | modeM0/AS1A11_050T19_9000005156_35973cztM0_level2_quad_clean.evt |
| Size (bytes) | 763,799,040 | 90,633,600 |
| Size | 728.4 MB | 86.4 MB |
| Events in quadrant A | 2,488,135 | 691,690 |
| Events in quadrant B | 11,256,557 | 428,036 |
| Events in quadrant C | 4,771,263 | 634,515 |
| Events in quadrant D | 4,270,883 | 630,243 |
| Mode M0 | |||
|---|---|---|---|
| Quadrant | BADHDUFLAG | Total packets | Discarded packets |
| A | 0 | 10437 | 2 |
| B | 0 | 36942 | 1 |
| C | 0 | 17554 | 1 |
| D | 0 | 16190 | 1 |
| Mode SS | |||
|---|---|---|---|
| Quadrant | BADHDUFLAG | Total packets | Discarded packets |
| A | 0 | 104 | 0 |
| B | 0 | 104 | 0 |
| C | 0 | 104 | 0 |
| D | 0 | 104 | 0 |
| Mode M9 | |||
|---|---|---|---|
| Quadrant | BADHDUFLAG | Total packets | Discarded packets |
| A | 0 | 21 | 0 |
| B | 0 | 21 | 0 |
| C | 0 | 21 | 0 |
| D | 0 | 21 | 0 |
| Quadrant | Total seconds | Saturated seconds | Saturation percentage |
|---|---|---|---|
| A | 5110 | 9 | 0.176125% |
| B | 5110 | 4076 | 79.765166% |
| C | 5110 | 655 | 12.818004% |
| D | 5110 | 300 | 5.870841% |
Noise dominated data is calculated using 1-second bins in cleaned event files. If a bin has >2000 counts, and if more than 50% of those come from <1% of pixels, then it is considered to be noise-dominated and hence unusable.
| Quadrant | # 1 sec bins | Bins with >0 counts | Bins with >2000 counts | High rate bins dominated by noise | Noise dominated (total time) | Noise dominated (detector-on time) | Marked lightcurve |
|---|---|---|---|---|---|---|---|
| A | 7202 | 5111 | 0 | 0 | 0.00% | 0.00% | 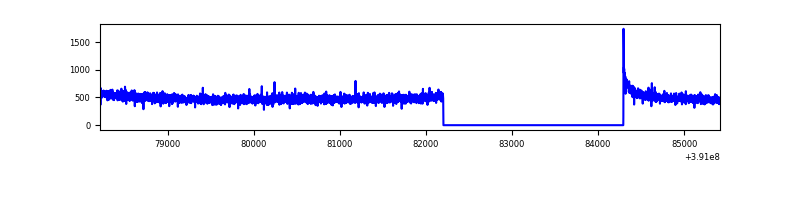 |
| B | 7201 | 5110 | 3523 | 3523 | 48.92% | 68.94% | 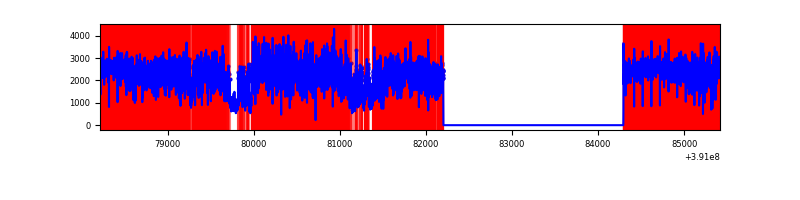 |
| C | 7201 | 5110 | 533 | 533 | 7.40% | 10.43% | 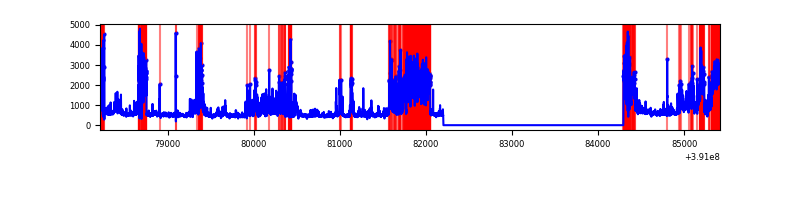 |
| D | 7202 | 5111 | 252 | 252 | 3.50% | 4.93% | 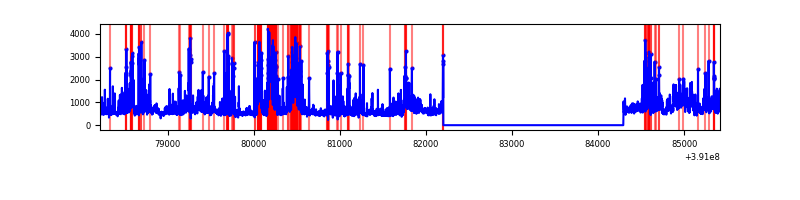 |
Top three noisy pixels from each quadrant. If the there are fewer than three noisy pixels in the level2.evt file, extra rows are filled as -1
| Pixel properties | Quadrant properties | ||||||
|---|---|---|---|---|---|---|---|
| Quadrant | DetID | PixID | Counts | Sigma | Mean | Median | Sigma |
| A | 10 | 83 | 132828 | 1093.98 | 604 | 593 | 120.9 |
| A | 15 | 169 | 11912 | 93.64 | 604 | 593 | 120.9 |
| A | 13 | 254 | 8195 | 62.89 | 604 | 593 | 120.9 |
| B | 5 | 31 | 6468847 | 82672.78 | 407 | 397 | 78.2 |
| B | 5 | 15 | 2092570 | 26739.91 | 407 | 397 | 78.2 |
| B | 5 | 172 | 438195 | 5595.46 | 407 | 397 | 78.2 |
| C | 9 | 187 | 2293047 | 18326.15 | 546 | 550 | 125.1 |
| C | 15 | 214 | 202072 | 1610.96 | 546 | 550 | 125.1 |
| C | 0 | 10 | 138969 | 1106.52 | 546 | 550 | 125.1 |
| D | 10 | 118 | 714656 | 5167.11 | 571 | 555 | 138.2 |
| D | 8 | 195 | 447914 | 3237.01 | 571 | 555 | 138.2 |
| D | 1 | 52 | 343171 | 2479.11 | 571 | 555 | 138.2 |
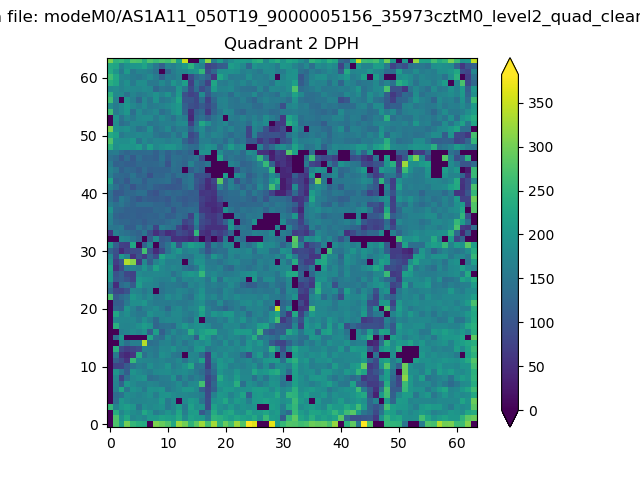
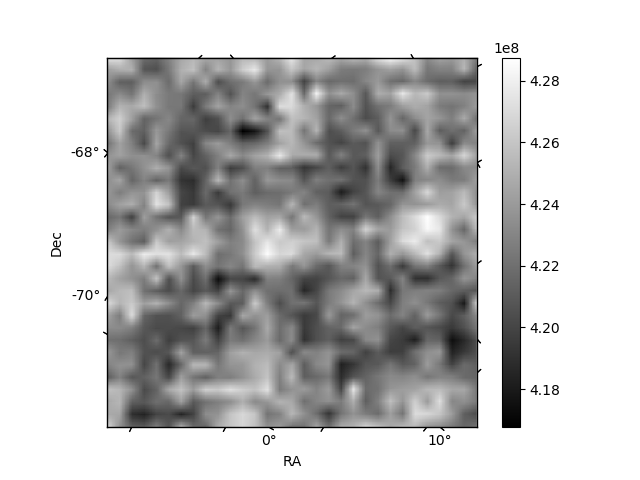
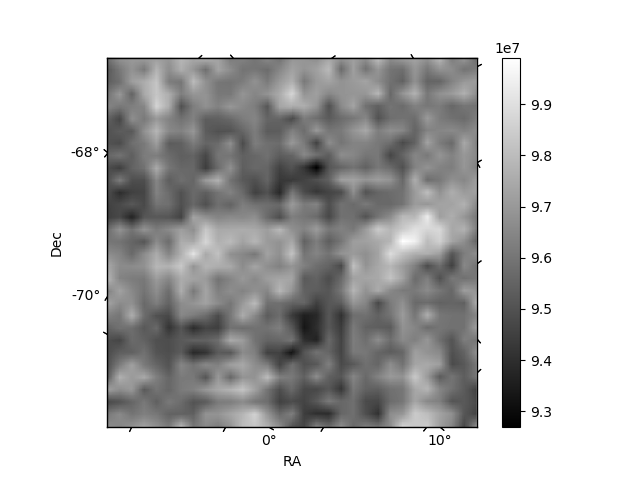
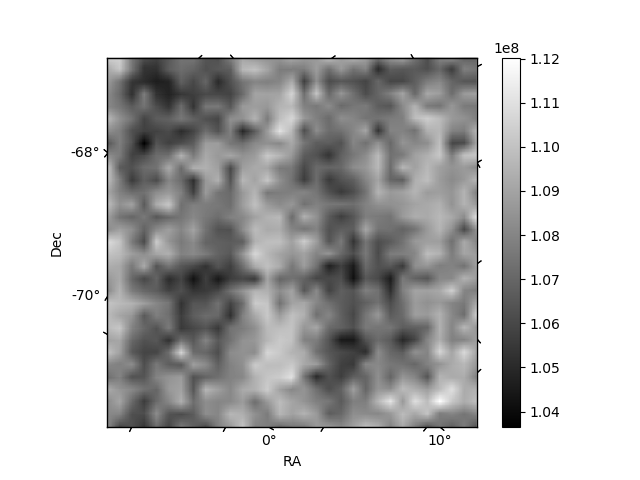
Histogram calculated using DETX and DETY for each event in the final _common_clean file
| Quadrant A | 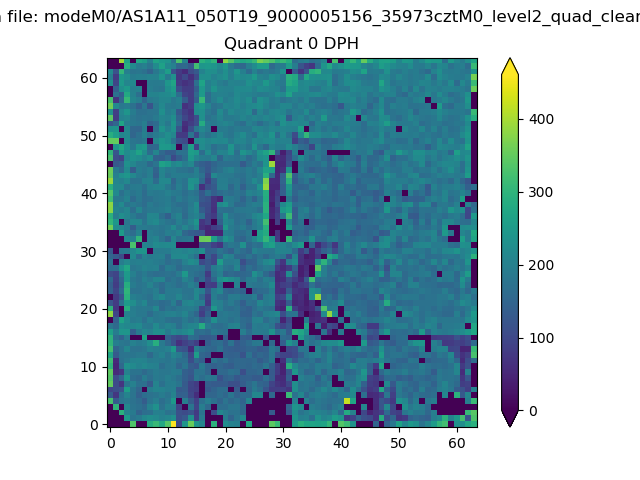 |
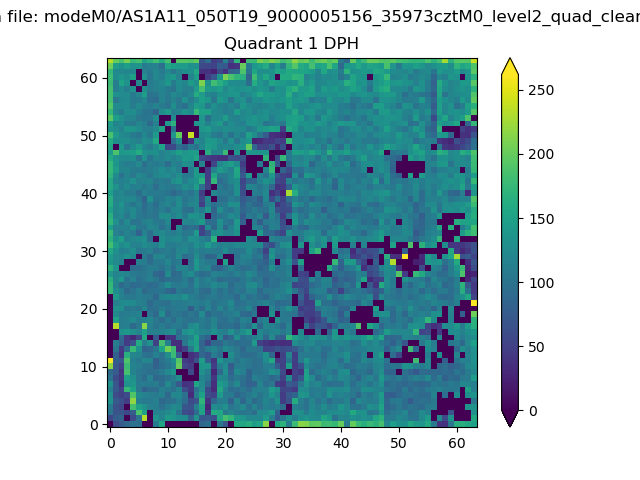 |
Quadrant B |
|---|---|---|---|
| Quadrant D | 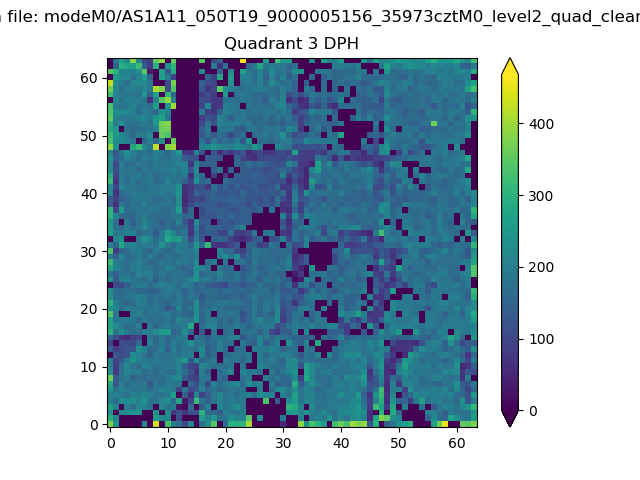 |
 |
Quadrant C |
| Plot type | Count rate plots | Images |
|---|---|---|
| Comparison with Poisson distribution Blue bars denote a histogram of data divided into 1 sec bins. Red curve is a Poisson curve with rate = median count rate of data. |
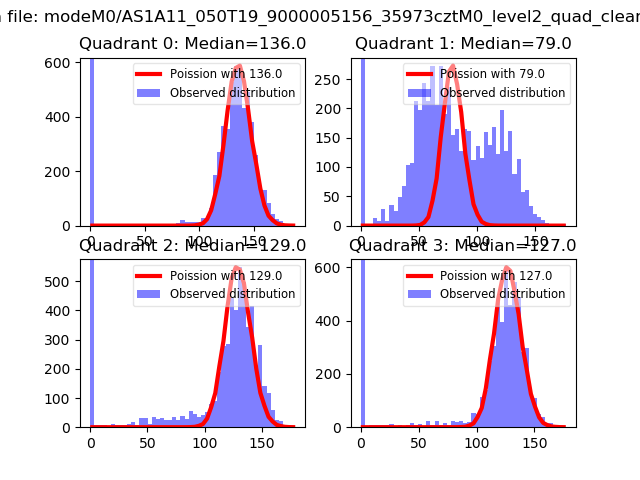 |
 |
| Quadrant-wise count rates Data is divided into 100 sec bins |
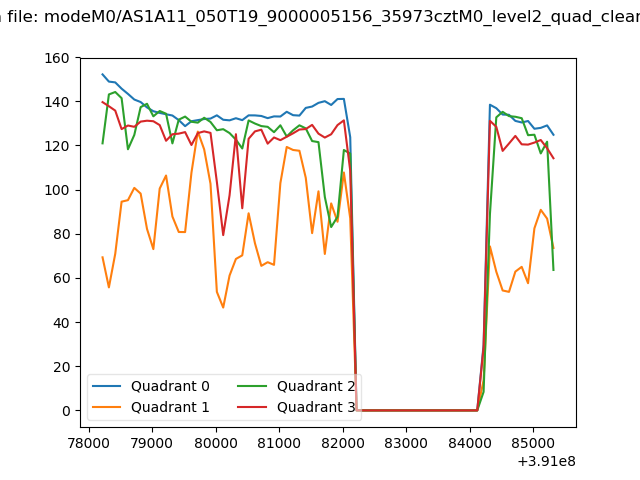 |
|
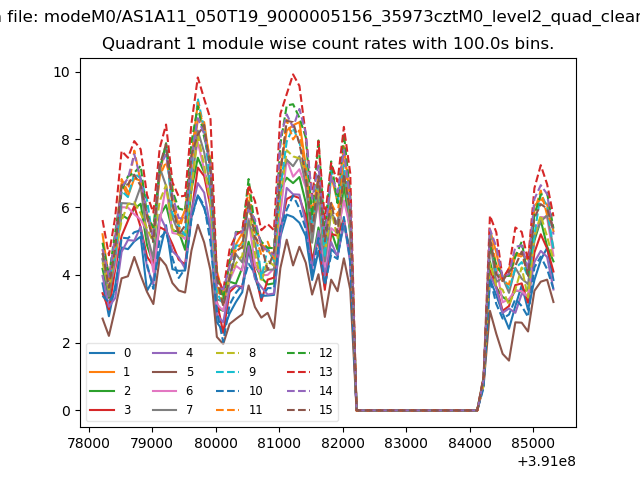
| Module-wise count rates for Quadrant A Data is divided into 100 sec bins |
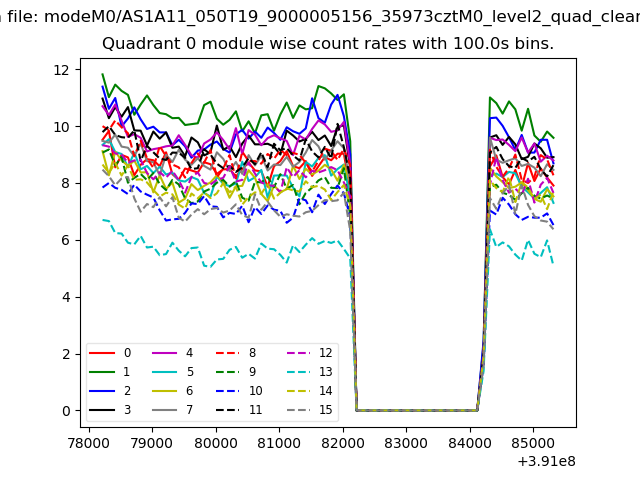 |
 |
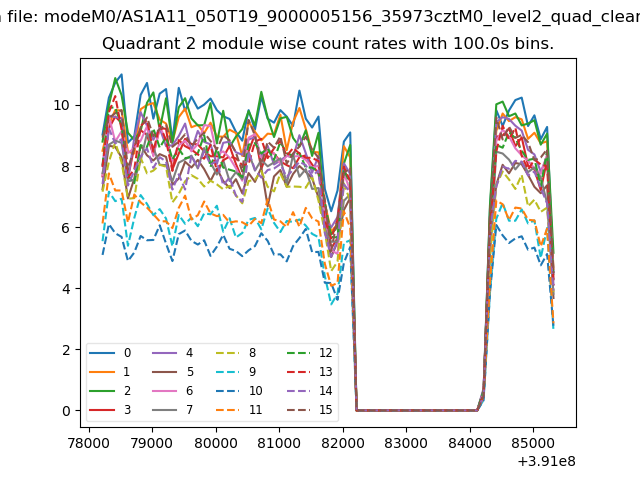
| Module-wise count rates for Quadrant B Data is divided into 100 sec bins |
 |
 |
| Module-wise count rates for Quadrant C Data is divided into 100 sec bins |
 |
 |
| Module-wise count rates for Quadrant D Data is divided into 100 sec bins |
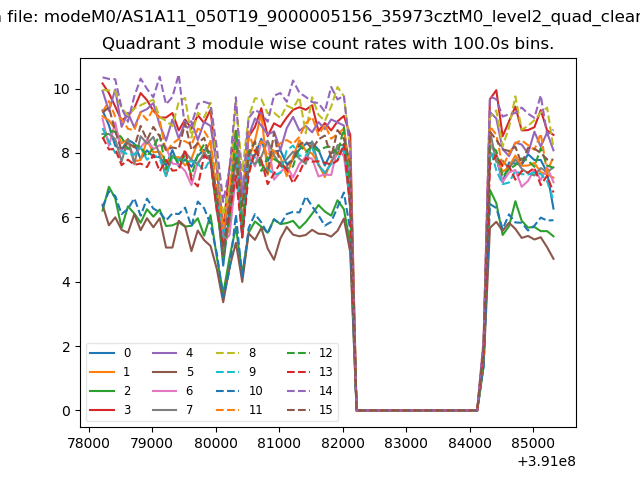 |
 |
| Parameter | Plot |
|---|---|
| CZT HV Monitor | 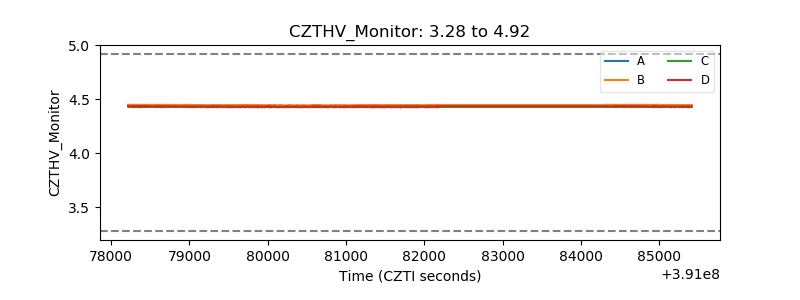 |
| D_VDD | 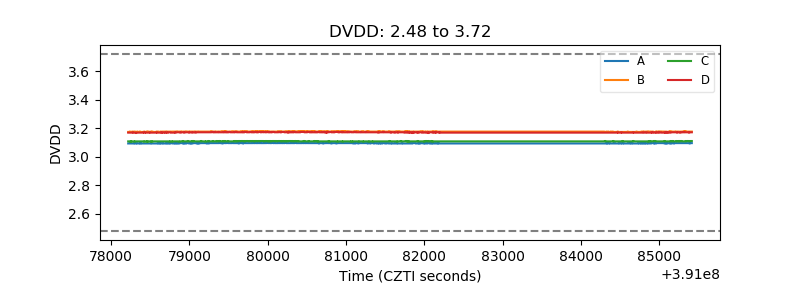 |
| Temperature 1 | 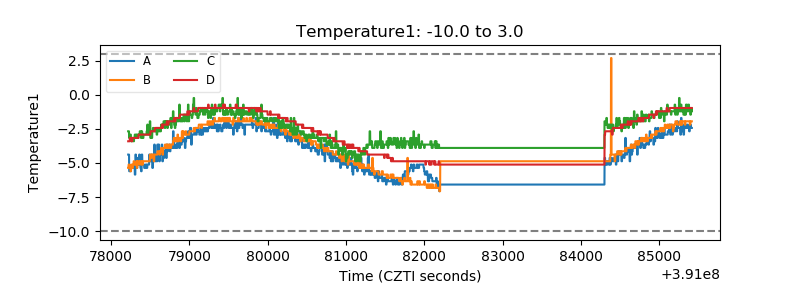 |
| Veto HV Monitor | 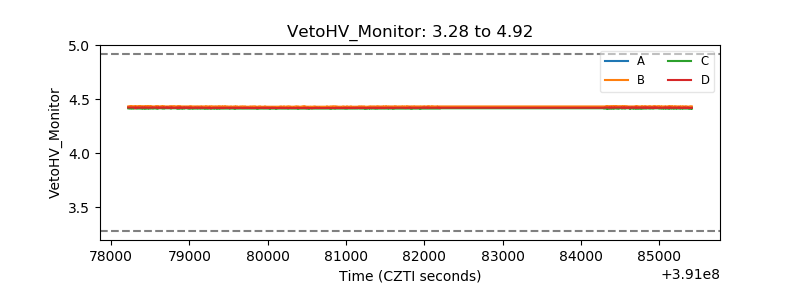 |
| Veto LLD | 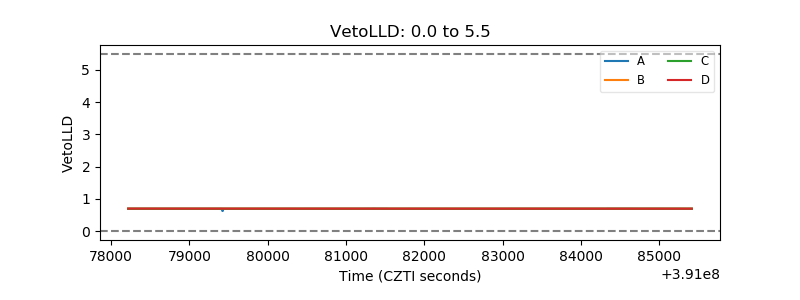 |
| Alpha Counter | 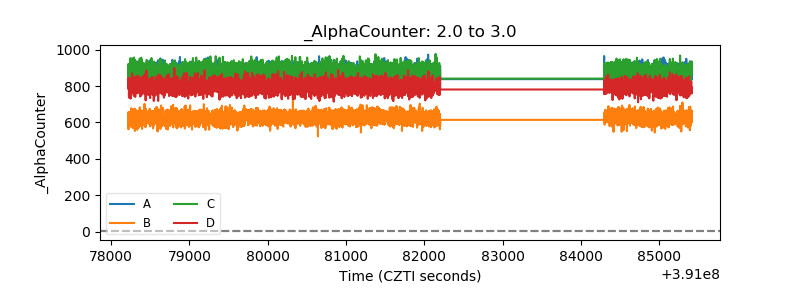 |
| _CPM_Rate | 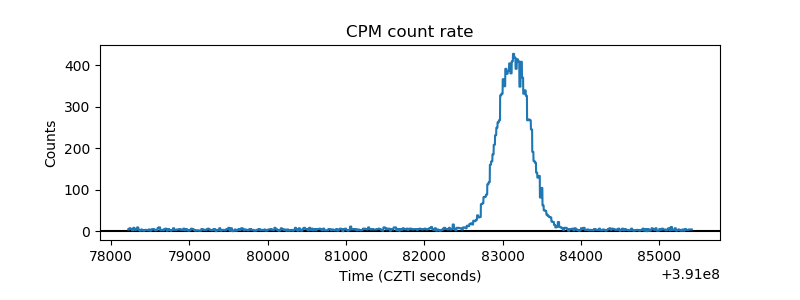 |
| CZT Counter | 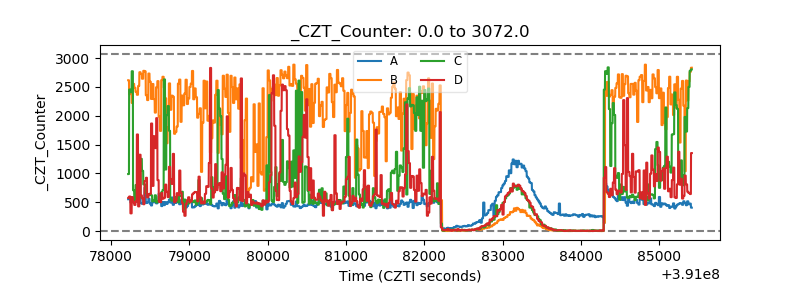 |
| +2.5 Volts monitor | 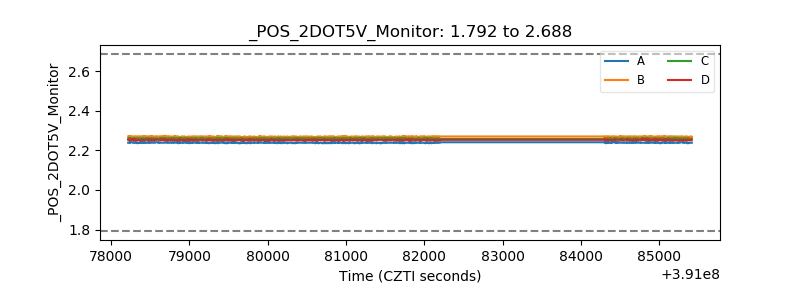 |
| +5 Volts monitor | 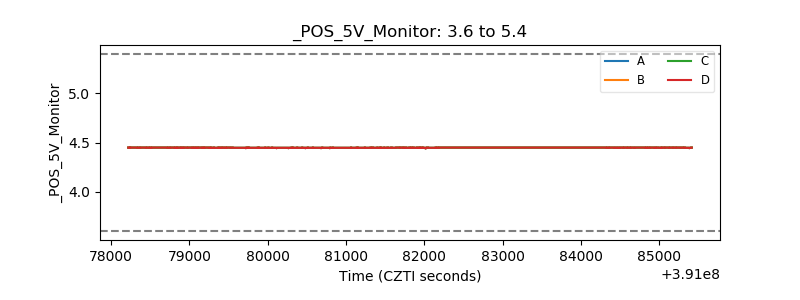 |
| _ROLL_ROT | 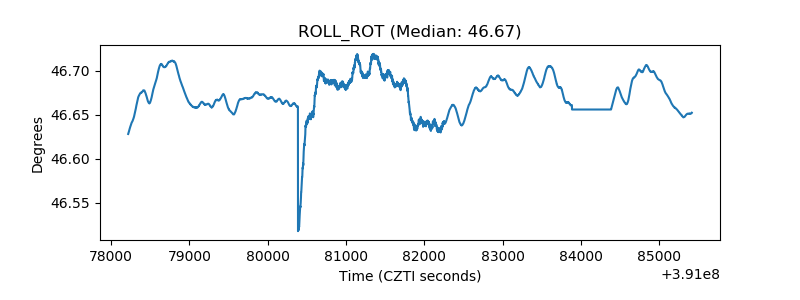 |
| _Roll_DEC | 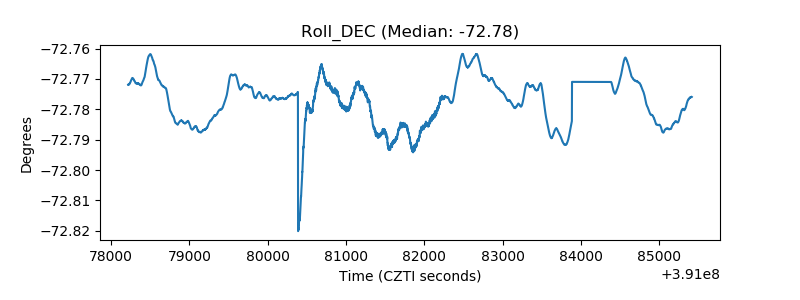 |
| _Roll_RA | 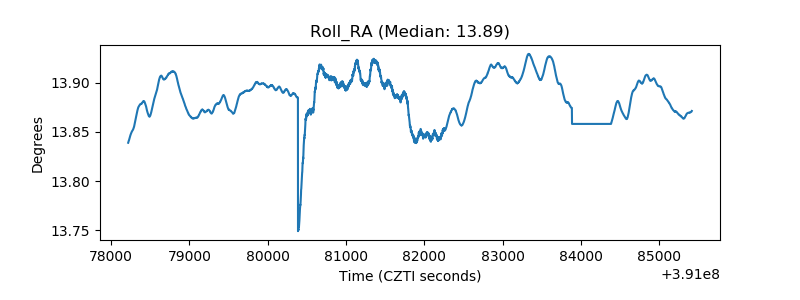 |
| Veto Counter | 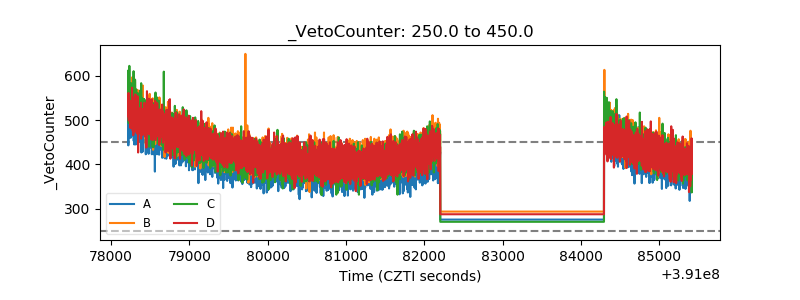 |