| Param | Original file | Final file |
|---|---|---|
| Filename | modeM0/AS1T05_009T09_9000005148_35968cztM0_level2.evt | modeM0/AS1T05_009T09_9000005148_35968cztM0_level2_quad_clean.evt |
| Size (bytes) | 417,254,400 | 45,797,760 |
| Size | 397.9 MB | 43.7 MB |
| Events in quadrant A | 1,275,642 | 352,510 |
| Events in quadrant B | 7,664,353 | 116,681 |
| Events in quadrant C | 1,866,102 | 361,643 |
| Events in quadrant D | 1,630,863 | 345,799 |
| Mode M0 | |||
|---|---|---|---|
| Quadrant | BADHDUFLAG | Total packets | Discarded packets |
| A | 0 | 5990 | 1 |
| B | 0 | 24802 | 1 |
| C | 0 | 7538 | 1 |
| D | 0 | 6935 | 1 |
| Mode SS | |||
|---|---|---|---|
| Quadrant | BADHDUFLAG | Total packets | Discarded packets |
| A | 0 | 58 | 0 |
| B | 0 | 58 | 0 |
| C | 0 | 58 | 0 |
| D | 0 | 58 | 0 |
| Mode M9 | |||
|---|---|---|---|
| Quadrant | BADHDUFLAG | Total packets | Discarded packets |
| A | 0 | 9 | 0 |
| B | 0 | 9 | 0 |
| C | 0 | 9 | 0 |
| D | 0 | 10 | 0 |
| Quadrant | Total seconds | Saturated seconds | Saturation percentage |
|---|---|---|---|
| A | 2924 | 4 | 0.136799% |
| B | 2924 | 2924 | 100.000000% |
| C | 2924 | 85 | 2.906977% |
| D | 2924 | 54 | 1.846785% |
Noise dominated data is calculated using 1-second bins in cleaned event files. If a bin has >2000 counts, and if more than 50% of those come from <1% of pixels, then it is considered to be noise-dominated and hence unusable.
| Quadrant | # 1 sec bins | Bins with >0 counts | Bins with >2000 counts | High rate bins dominated by noise | Noise dominated (total time) | Noise dominated (detector-on time) | Marked lightcurve |
|---|---|---|---|---|---|---|---|
| A | 2924 | 2924 | 0 | 0 | 0.00% | 0.00% | 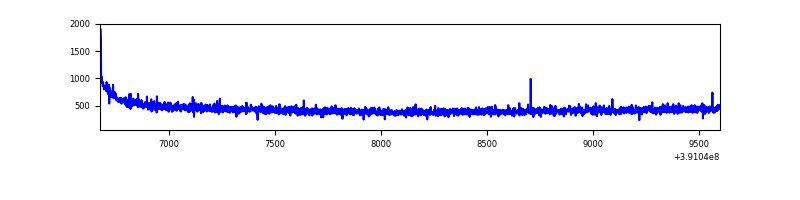 |
| B | 2923 | 2923 | 2885 | 2885 | 98.70% | 98.70% | 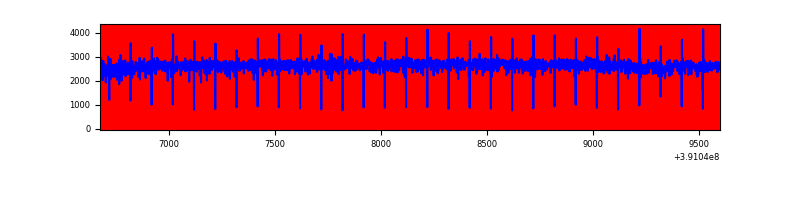 |
| C | 2924 | 2924 | 75 | 75 | 2.56% | 2.56% | 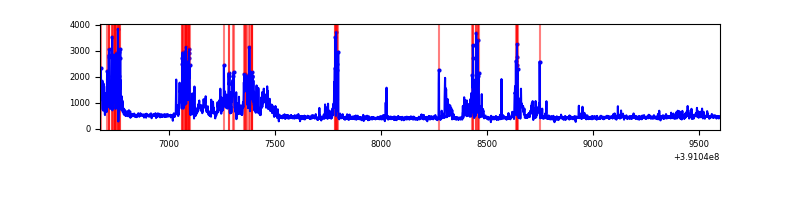 |
| D | 2924 | 2924 | 54 | 54 | 1.85% | 1.85% | 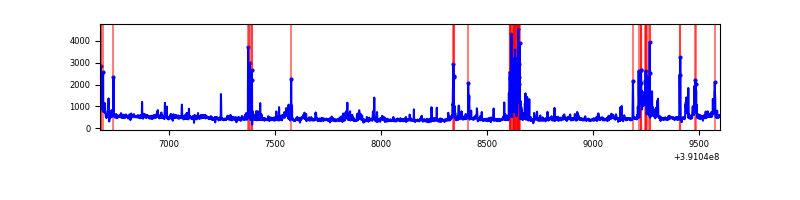 |
Top three noisy pixels from each quadrant. If the there are fewer than three noisy pixels in the level2.evt file, extra rows are filled as -1
| Pixel properties | Quadrant properties | ||||||
|---|---|---|---|---|---|---|---|
| Quadrant | DetID | PixID | Counts | Sigma | Mean | Median | Sigma |
| A | 10 | 83 | 83809 | 1319.99 | 306 | 300 | 63.3 |
| A | 13 | 254 | 4612 | 68.16 | 306 | 300 | 63.3 |
| A | 13 | 6 | 4014 | 58.71 | 306 | 300 | 63.3 |
| B | 5 | 31 | 2650702 | 109734.77 | 116 | 114 | 24.2 |
| B | 5 | 15 | 2556308 | 105826.84 | 116 | 114 | 24.2 |
| B | 5 | 14 | 1467762 | 60760.86 | 116 | 114 | 24.2 |
| C | 9 | 187 | 458933 | 6452.18 | 298 | 300 | 71.1 |
| C | 15 | 214 | 120461 | 1690.46 | 298 | 300 | 71.1 |
| C | 0 | 10 | 101056 | 1417.46 | 298 | 300 | 71.1 |
| D | 7 | 223 | 271582 | 3713.9 | 296 | 286 | 73.0 |
| D | 8 | 195 | 76799 | 1047.42 | 296 | 286 | 73.0 |
| D | 13 | 249 | 32700 | 443.73 | 296 | 286 | 73.0 |
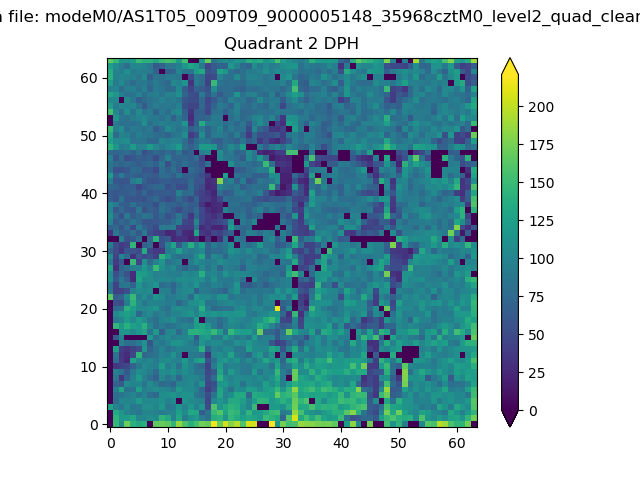
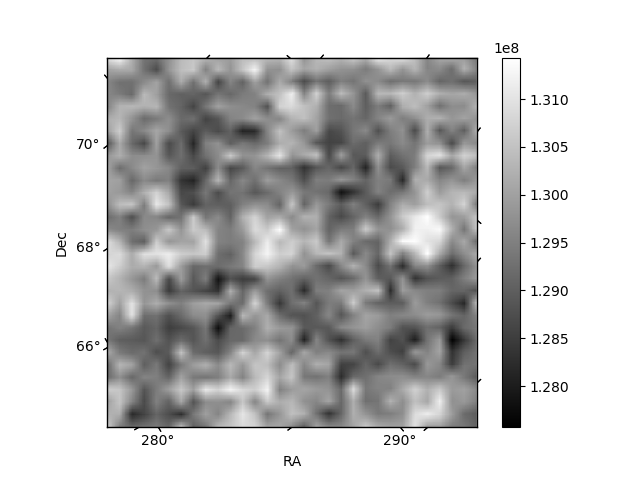
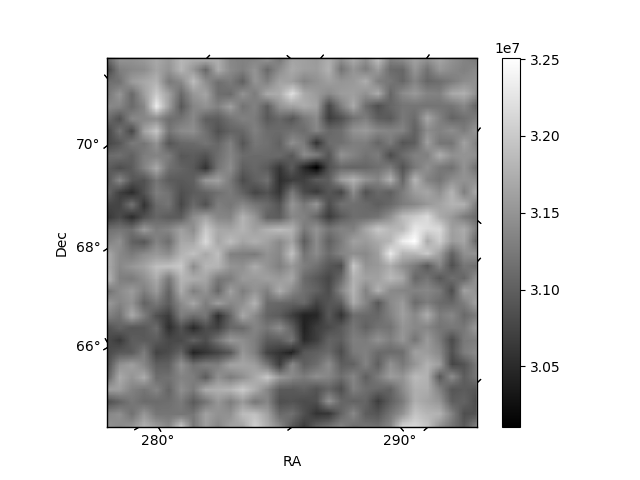
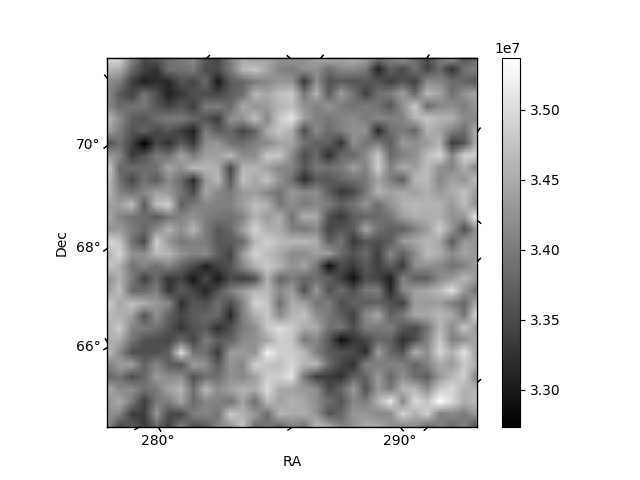
Histogram calculated using DETX and DETY for each event in the final _common_clean file
| Quadrant A | 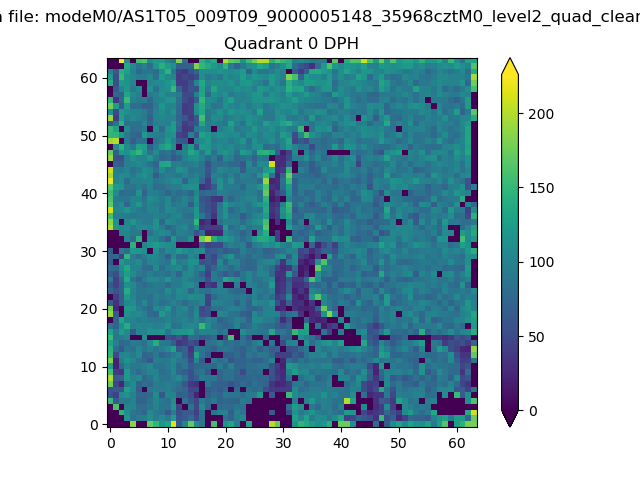 |
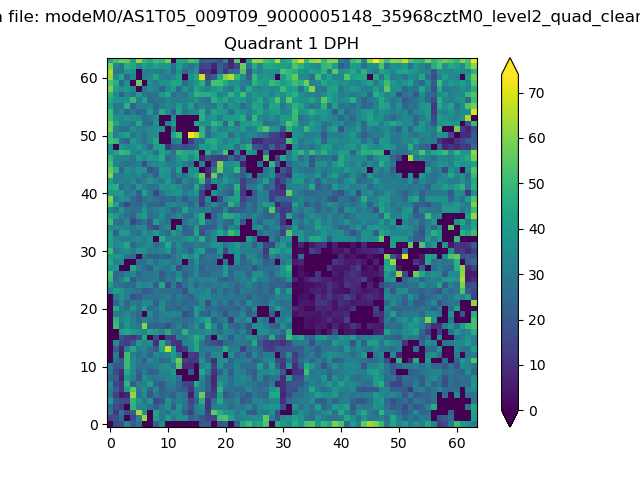 |
Quadrant B |
|---|---|---|---|
| Quadrant D | 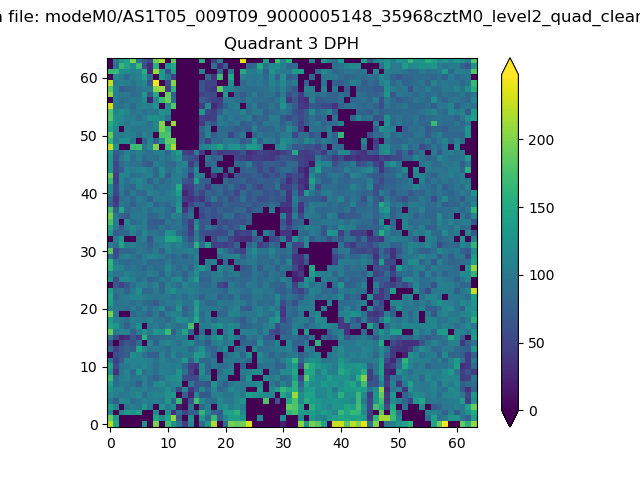 |
 |
Quadrant C |
| Plot type | Count rate plots | Images |
|---|---|---|
| Comparison with Poisson distribution Blue bars denote a histogram of data divided into 1 sec bins. Red curve is a Poisson curve with rate = median count rate of data. |
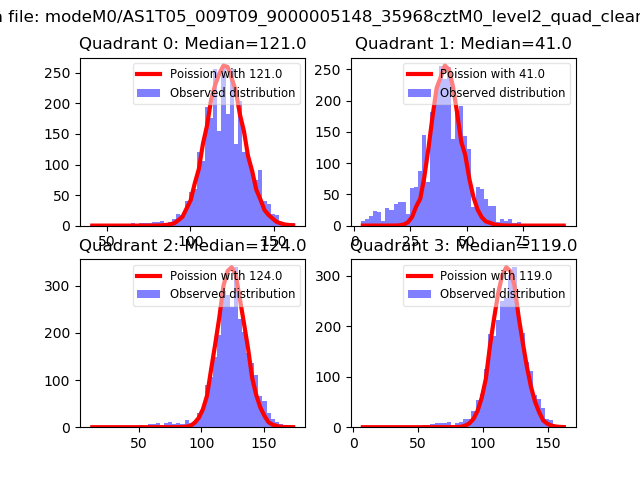 |
 |
| Quadrant-wise count rates Data is divided into 100 sec bins |
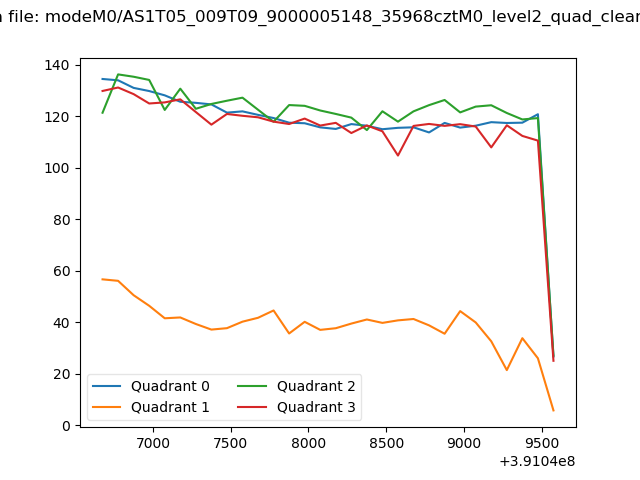 |
|
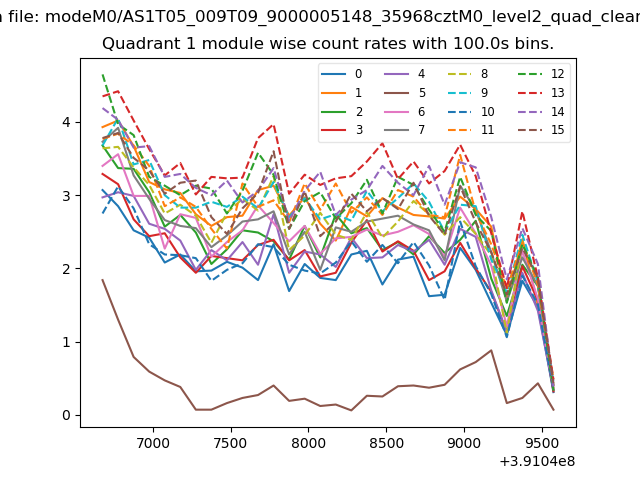
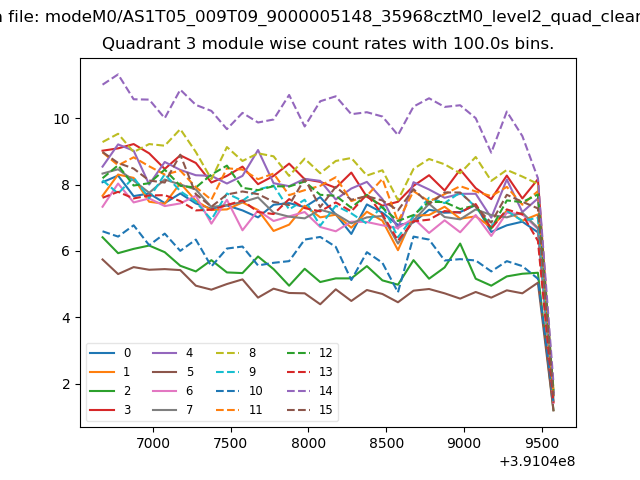
| Module-wise count rates for Quadrant A Data is divided into 100 sec bins |
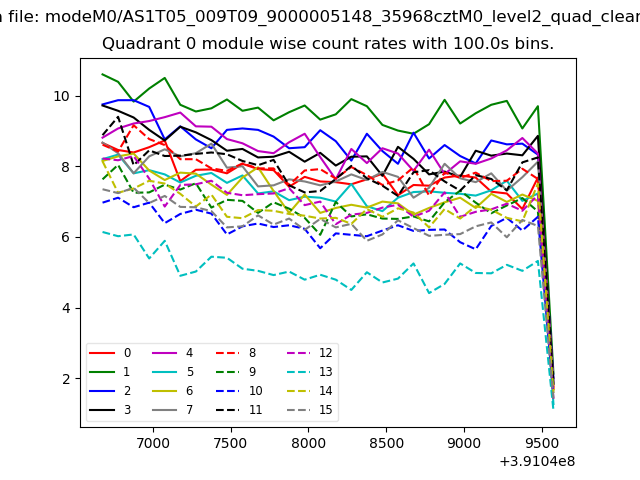 |
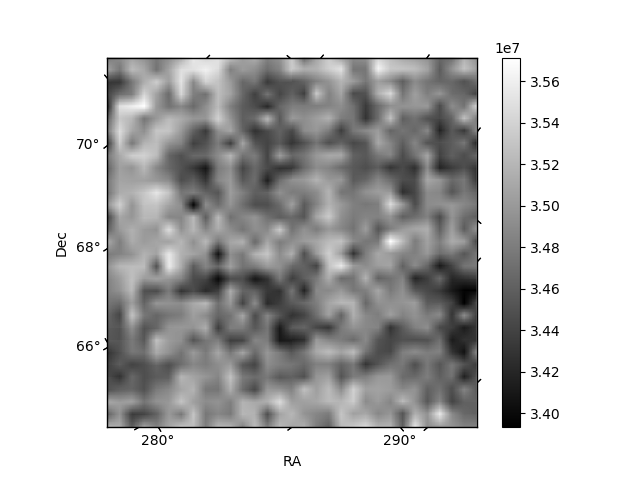 |
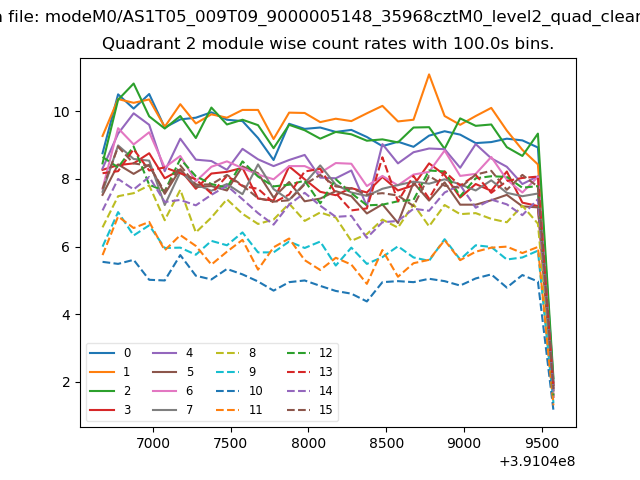
| Module-wise count rates for Quadrant B Data is divided into 100 sec bins |
 |
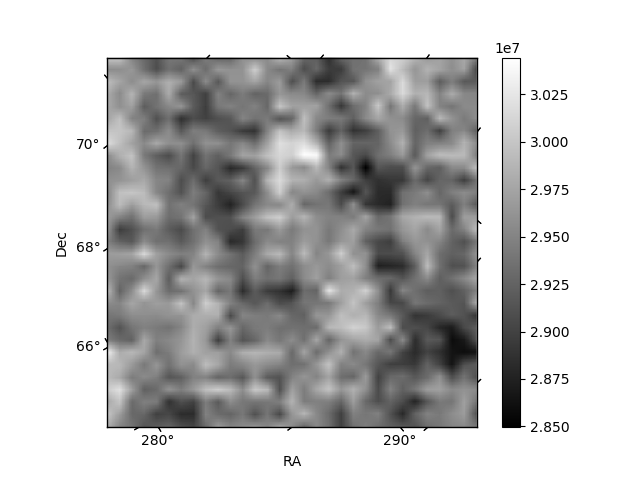 |
| Module-wise count rates for Quadrant C Data is divided into 100 sec bins |
 |
 |
| Module-wise count rates for Quadrant D Data is divided into 100 sec bins |
 |
 |
| Parameter | Plot |
|---|---|
| CZT HV Monitor |  |
| D_VDD | 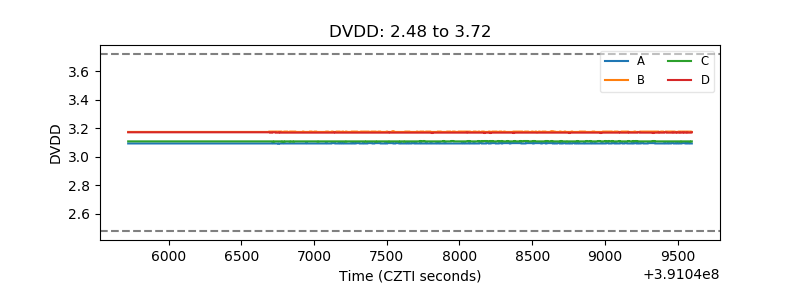 |
| Temperature 1 | 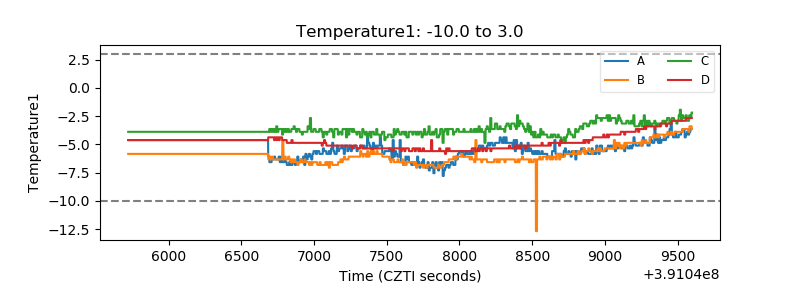 |
| Veto HV Monitor | 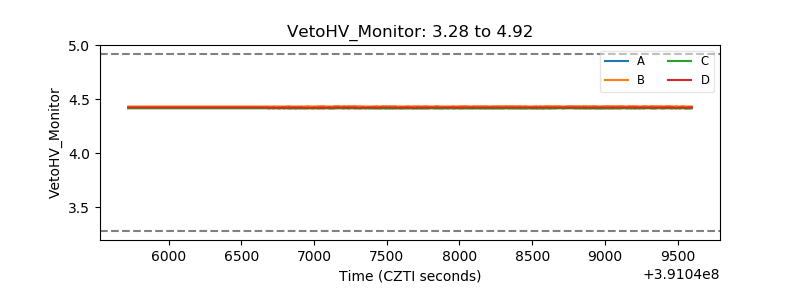 |
| Veto LLD | 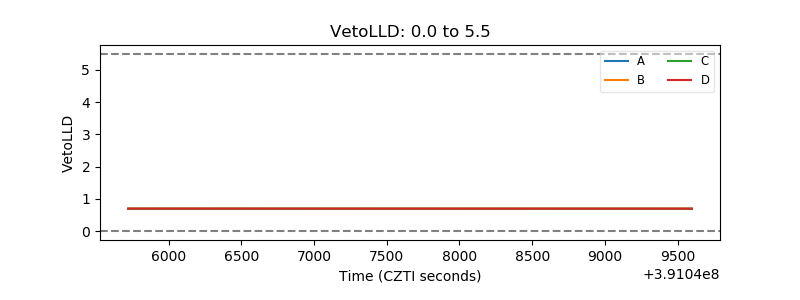 |
| Alpha Counter | 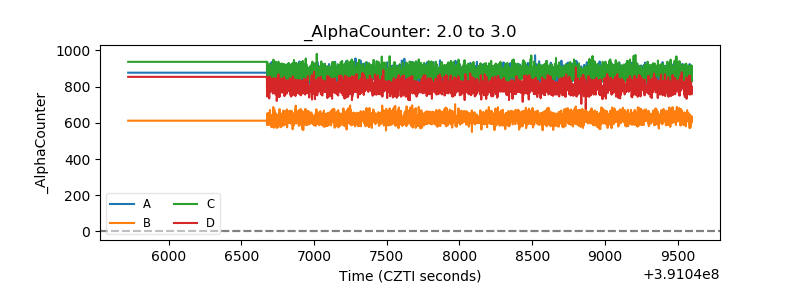 |
| _CPM_Rate | 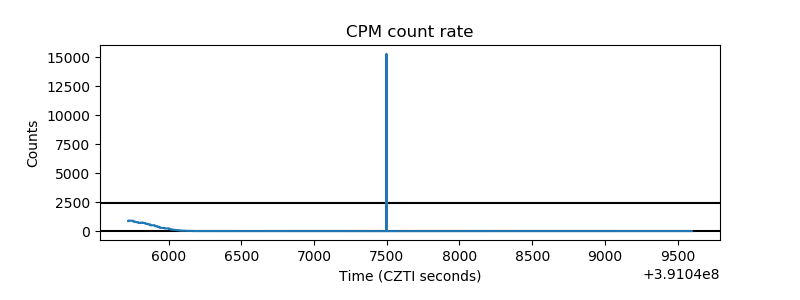 |
| CZT Counter | 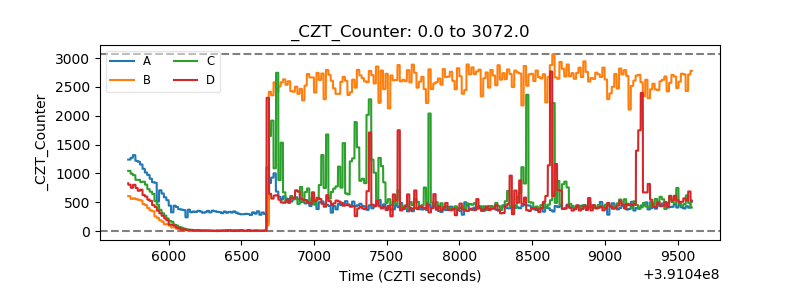 |
| +2.5 Volts monitor | 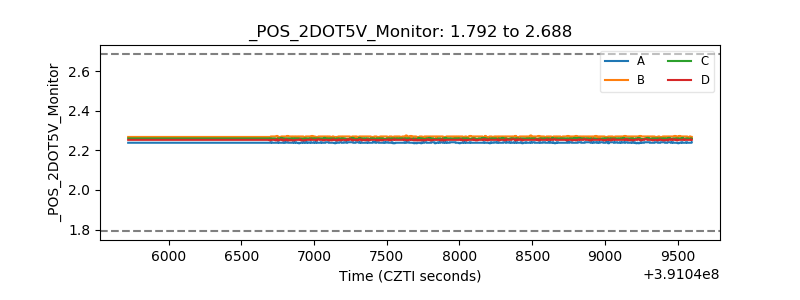 |
| +5 Volts monitor | 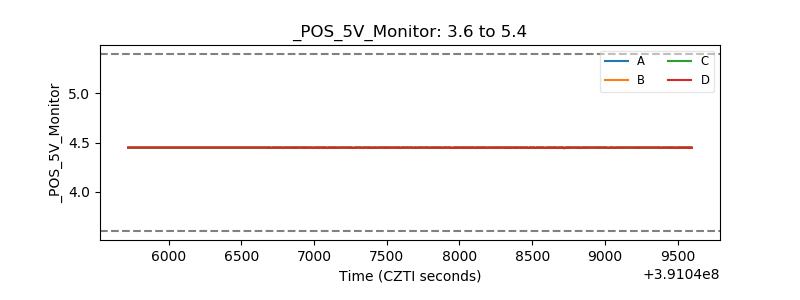 |
| _ROLL_ROT | 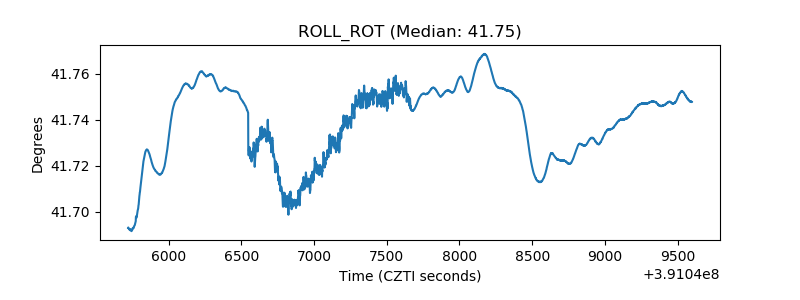 |
| _Roll_DEC | 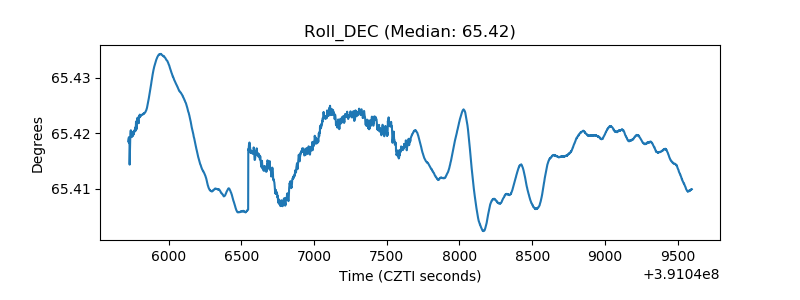 |
| _Roll_RA | 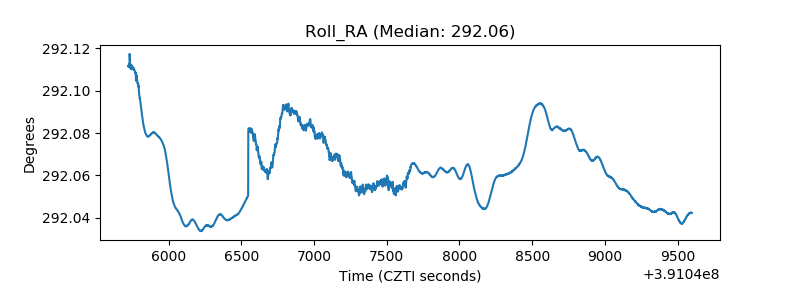 |
| Veto Counter | 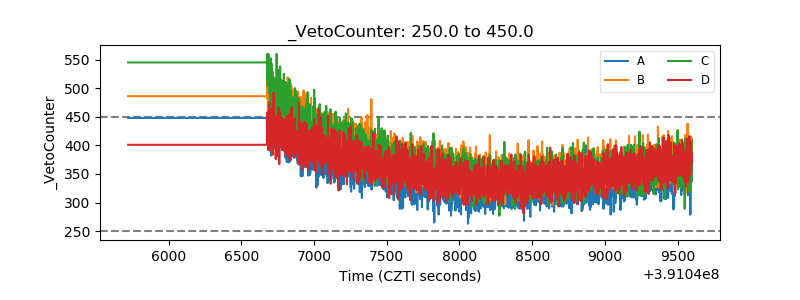 |