| Param | Original file | Final file |
|---|---|---|
| Filename | modeM0/AS1A11_080T01_9000005146_35966cztM0_level2.evt | modeM0/AS1A11_080T01_9000005146_35966cztM0_level2_quad_clean.evt |
| Size (bytes) | 2,245,374,720 | 232,436,160 |
| Size | 2.1 GB | 221.7 MB |
| Events in quadrant A | 8,169,639 | 1,752,875 |
| Events in quadrant B | 34,216,009 | 993,999 |
| Events in quadrant C | 14,179,992 | 1,596,850 |
| Events in quadrant D | 10,391,385 | 1,617,981 |
| Mode M9 | |||
|---|---|---|---|
| Quadrant | BADHDUFLAG | Total packets | Discarded packets |
| A | 0 | 56 | 0 |
| B | 0 | 56 | 0 |
| C | 0 | 56 | 0 |
| D | 0 | 56 | 0 |
| Mode SS | |||
|---|---|---|---|
| Quadrant | BADHDUFLAG | Total packets | Discarded packets |
| A | 0 | 316 | 0 |
| B | 0 | 316 | 0 |
| C | 0 | 316 | 0 |
| D | 0 | 316 | 0 |
| Mode M0 | |||
|---|---|---|---|
| Quadrant | BADHDUFLAG | Total packets | Discarded packets |
| A | 0 | 34109 | 4 |
| B | 0 | 112275 | 4 |
| C | 0 | 51901 | 4 |
| D | 0 | 41163 | 4 |
| Quadrant | Total seconds | Saturated seconds | Saturation percentage |
|---|---|---|---|
| A | 15570 | 49 | 0.314708% |
| B | 15570 | 12243 | 78.631985% |
| C | 15570 | 2278 | 14.630700% |
| D | 15570 | 466 | 2.992935% |
Noise dominated data is calculated using 1-second bins in cleaned event files. If a bin has >2000 counts, and if more than 50% of those come from <1% of pixels, then it is considered to be noise-dominated and hence unusable.
| Quadrant | # 1 sec bins | Bins with >0 counts | Bins with >2000 counts | High rate bins dominated by noise | Noise dominated (total time) | Noise dominated (detector-on time) | Marked lightcurve |
|---|---|---|---|---|---|---|---|
| A | 21060 | 15574 | 24 | 24 | 0.11% | 0.15% | 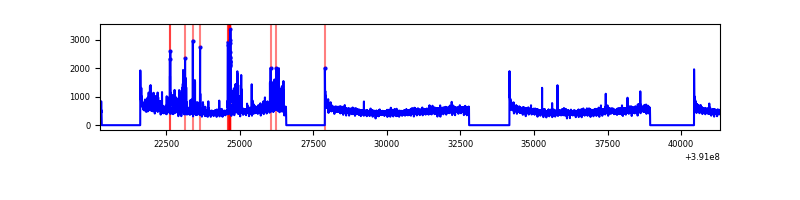 |
| B | 21059 | 15571 | 11588 | 11588 | 55.03% | 74.42% | 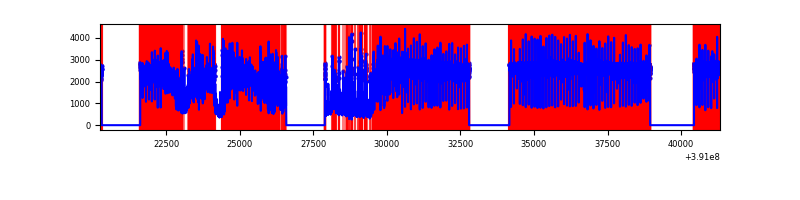 |
| C | 21060 | 15573 | 1925 | 1925 | 9.14% | 12.36% | 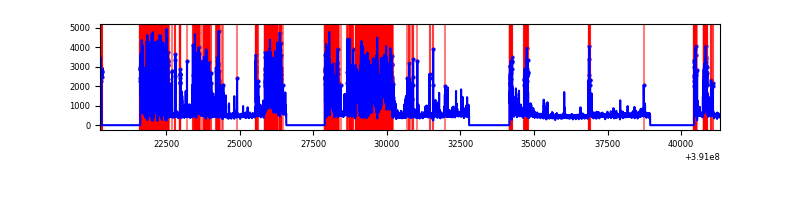 |
| D | 21060 | 15574 | 439 | 439 | 2.08% | 2.82% | 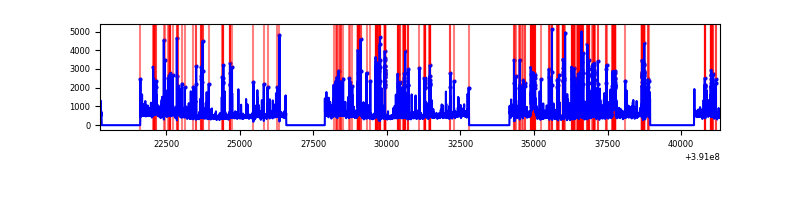 |
Top three noisy pixels from each quadrant. If the there are fewer than three noisy pixels in the level2.evt file, extra rows are filled as -1
| Pixel properties | Quadrant properties | ||||||
|---|---|---|---|---|---|---|---|
| Quadrant | DetID | PixID | Counts | Sigma | Mean | Median | Sigma |
| A | 15 | 169 | 546478 | 1435.61 | 1856 | 1819 | 379.4 |
| A | 10 | 83 | 398972 | 1046.81 | 1856 | 1819 | 379.4 |
| A | 13 | 6 | 28221 | 69.59 | 1856 | 1819 | 379.4 |
| B | 5 | 31 | 9205027 | 44462.11 | 1072 | 1049 | 207.0 |
| B | 5 | 15 | 9096193 | 43936.36 | 1072 | 1049 | 207.0 |
| B | 5 | 14 | 7752824 | 37446.88 | 1072 | 1049 | 207.0 |
| C | 9 | 187 | 4014712 | 10243.76 | 1674 | 1696 | 391.8 |
| C | 0 | 207 | 2618818 | 6680.56 | 1674 | 1696 | 391.8 |
| C | 15 | 214 | 604653 | 1539.13 | 1674 | 1696 | 391.8 |
| D | 12 | 17 | 840427 | 1907.47 | 1783 | 1740 | 439.7 |
| D | 13 | 249 | 550753 | 1248.65 | 1783 | 1740 | 439.7 |
| D | 2 | 250 | 404125 | 915.16 | 1783 | 1740 | 439.7 |
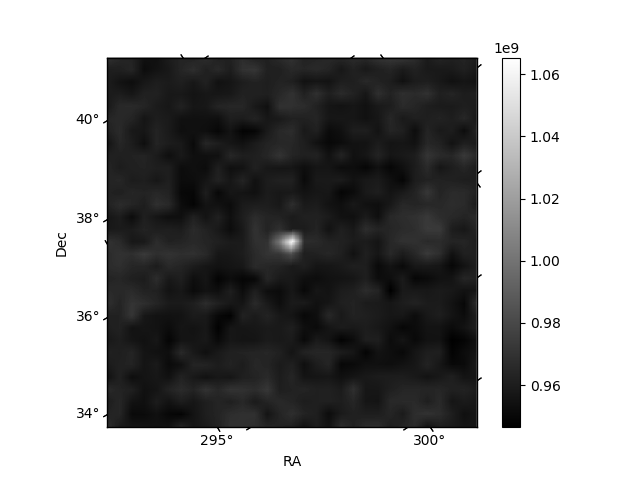
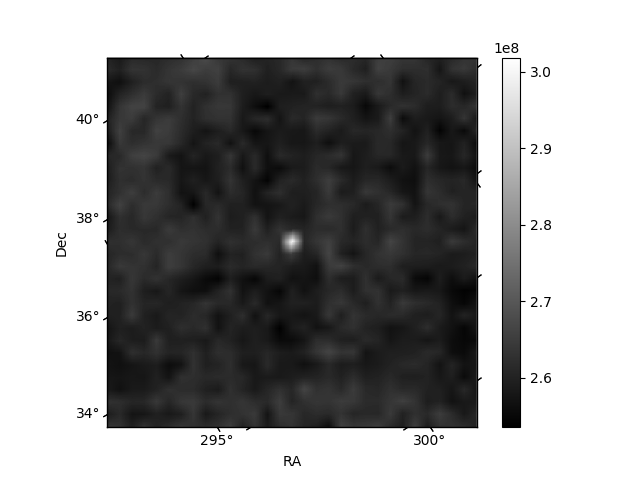
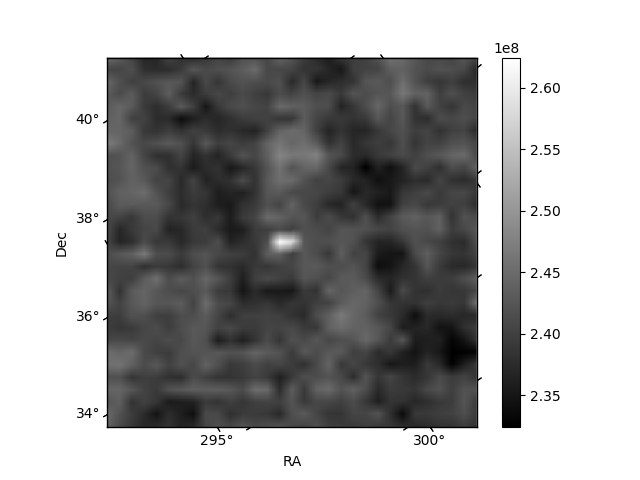
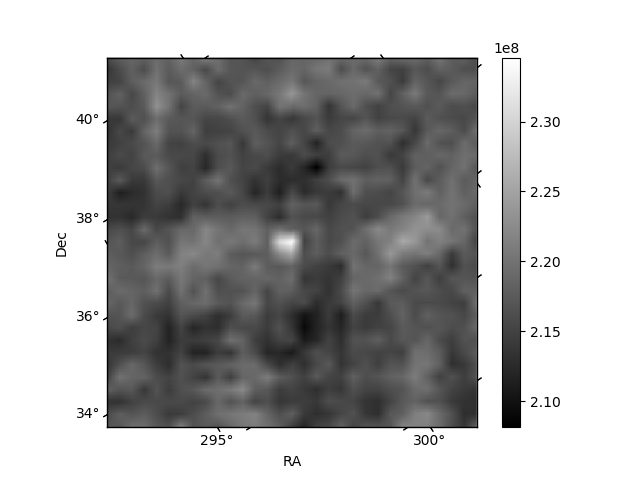
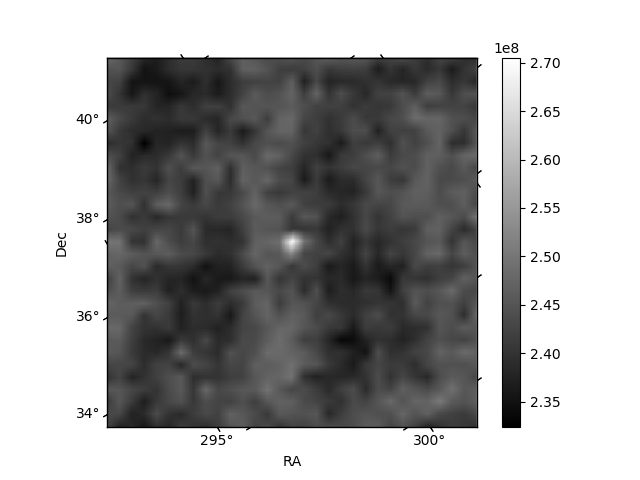
Histogram calculated using DETX and DETY for each event in the final _common_clean file
| Quadrant A | 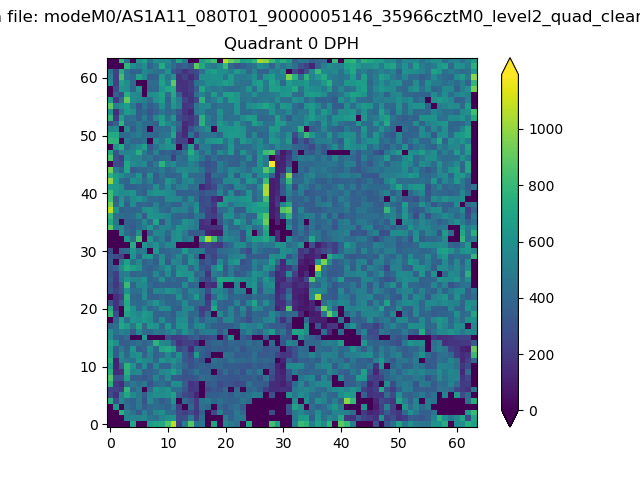 |
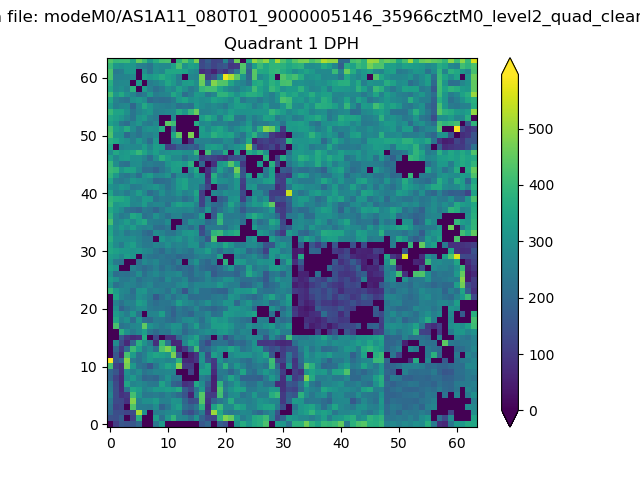 |
Quadrant B |
|---|---|---|---|
| Quadrant D | 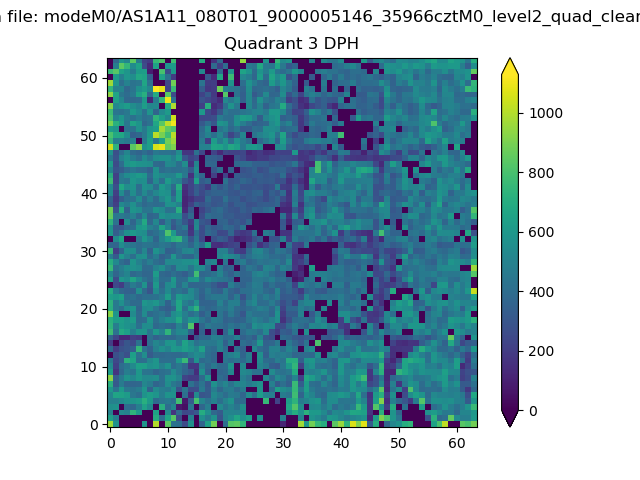 |
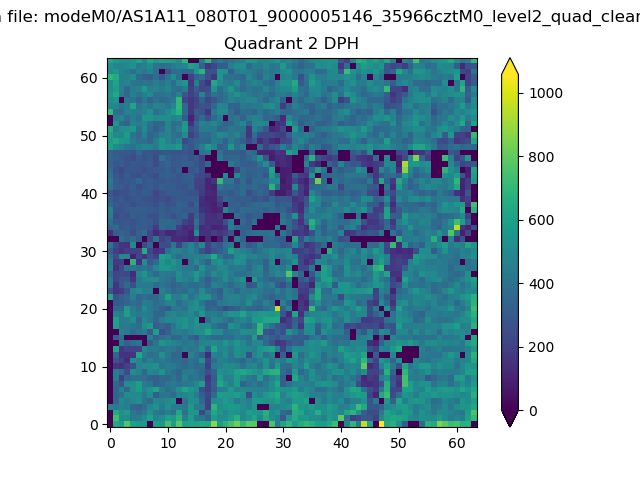 |
Quadrant C |
| Plot type | Count rate plots | Images |
|---|---|---|
| Comparison with Poisson distribution Blue bars denote a histogram of data divided into 1 sec bins. Red curve is a Poisson curve with rate = median count rate of data. |
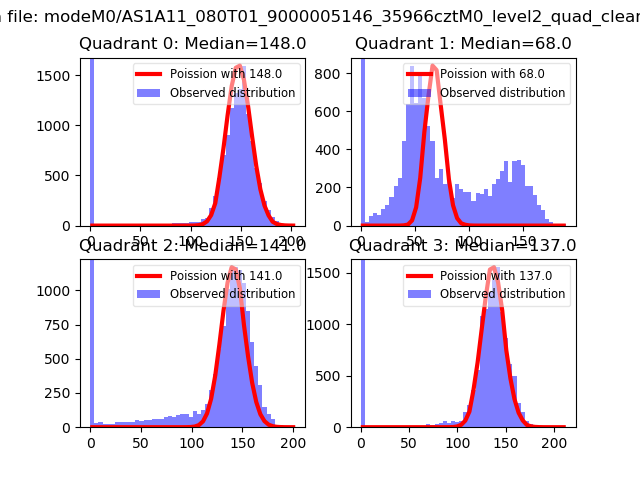 |
 |
| Quadrant-wise count rates Data is divided into 100 sec bins |
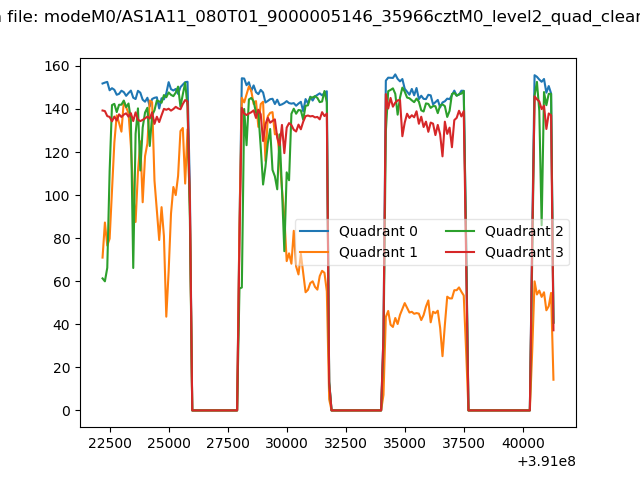 |
|
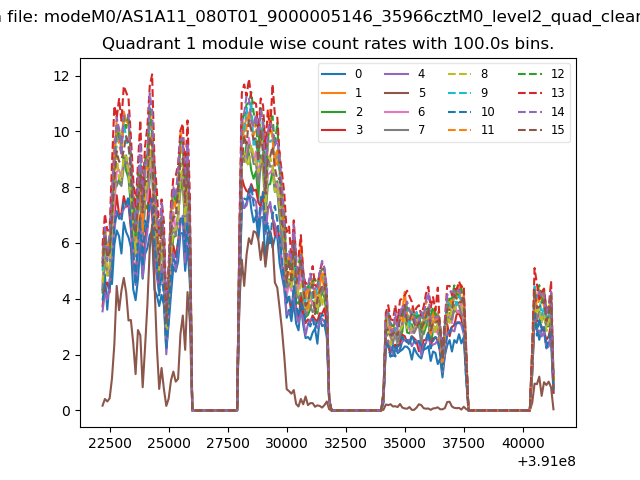
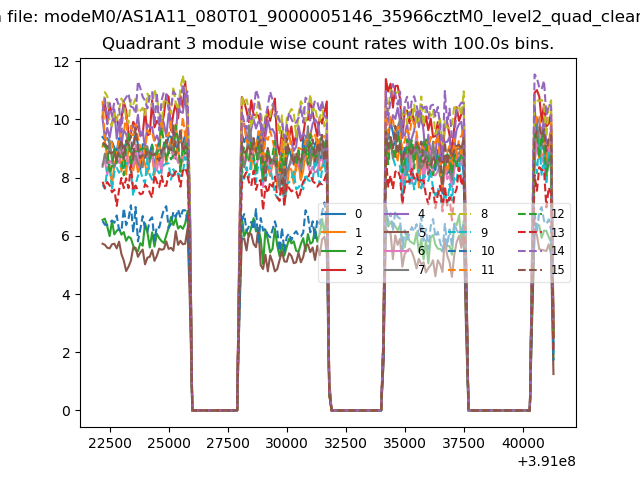
| Module-wise count rates for Quadrant A Data is divided into 100 sec bins |
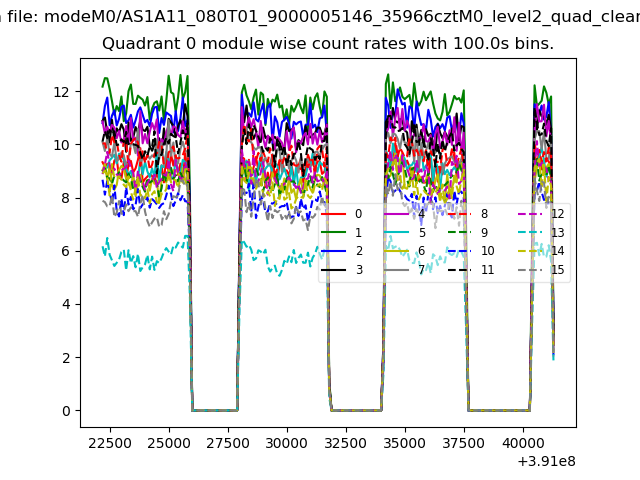 |
 |
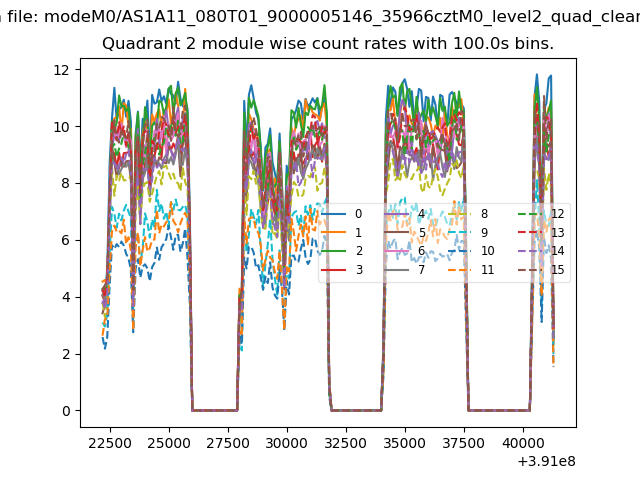
| Module-wise count rates for Quadrant B Data is divided into 100 sec bins |
 |
 |
| Module-wise count rates for Quadrant C Data is divided into 100 sec bins |
 |
 |
| Module-wise count rates for Quadrant D Data is divided into 100 sec bins |
 |
 |
| Parameter | Plot |
|---|---|
| CZT HV Monitor | 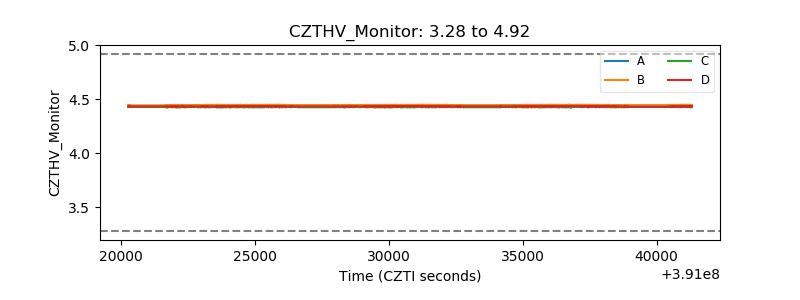 |
| D_VDD | 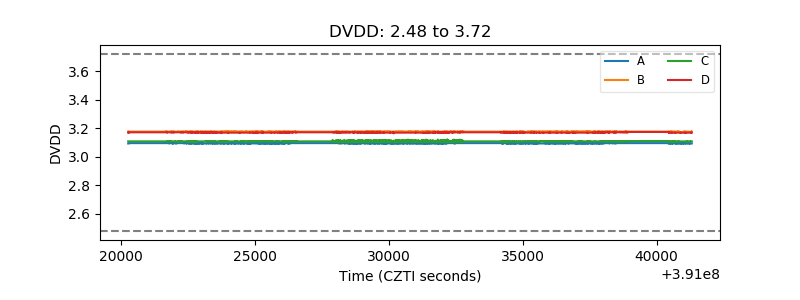 |
| Temperature 1 | 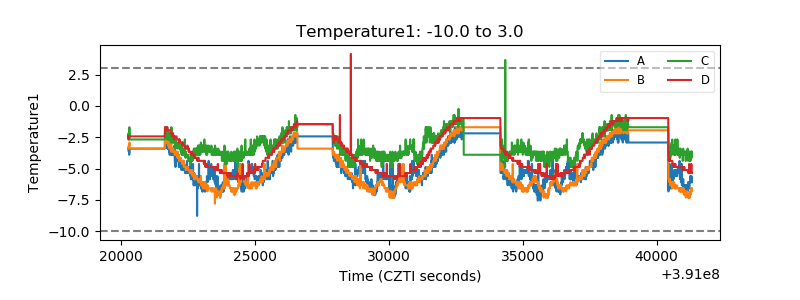 |
| Veto HV Monitor | 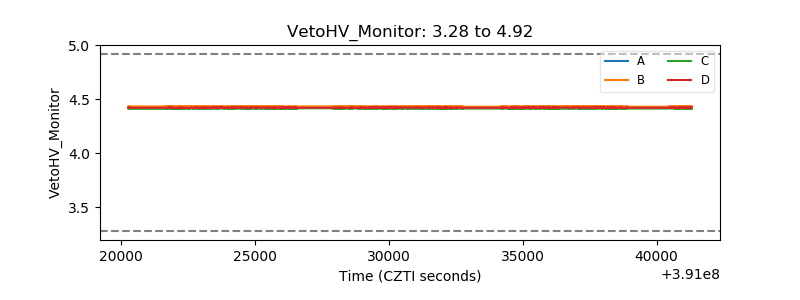 |
| Veto LLD | 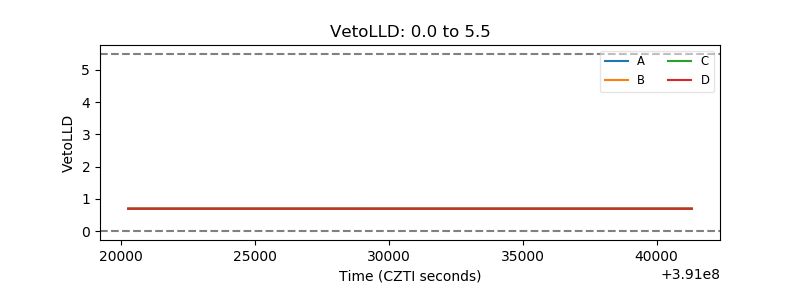 |
| Alpha Counter | 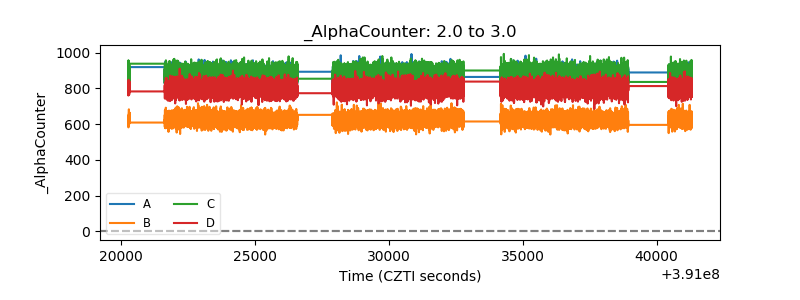 |
| _CPM_Rate | 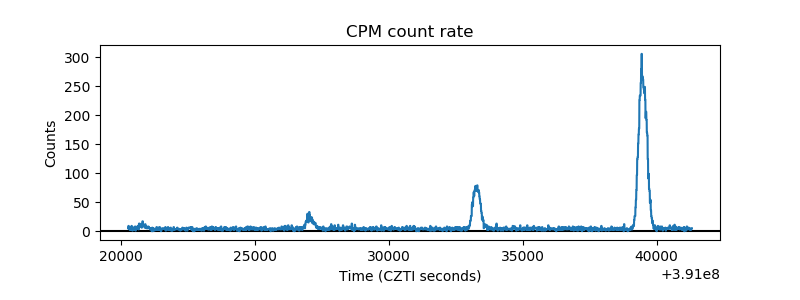 |
| CZT Counter | 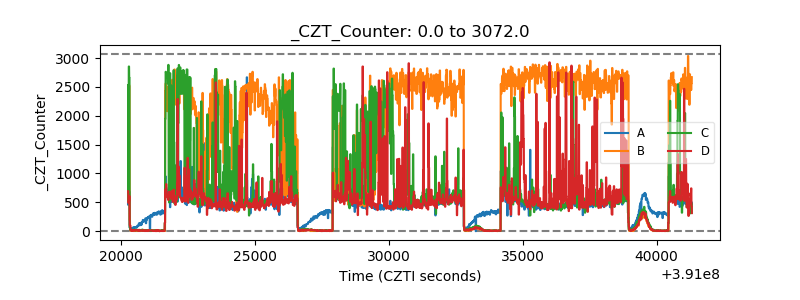 |
| +2.5 Volts monitor | 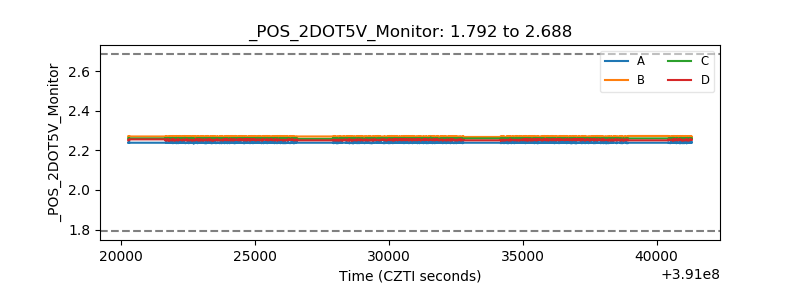 |
| +5 Volts monitor | 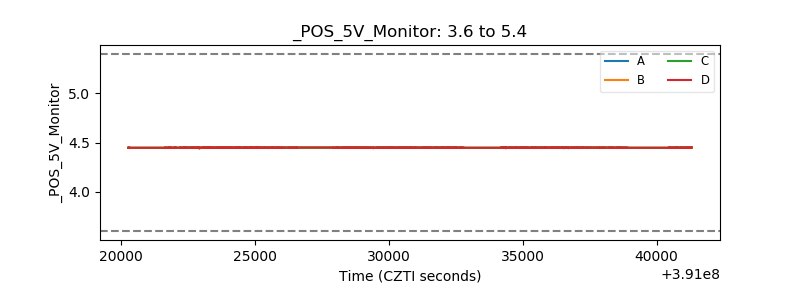 |
| _ROLL_ROT | 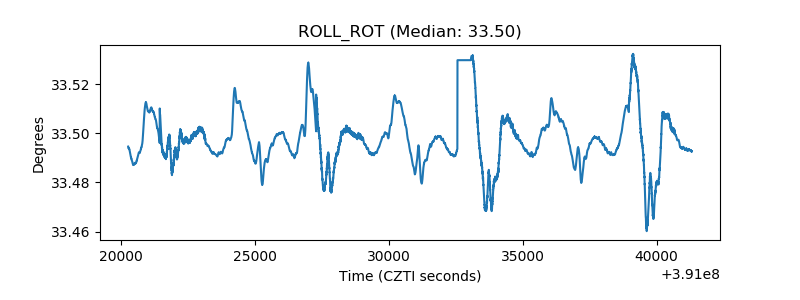 |
| _Roll_DEC | 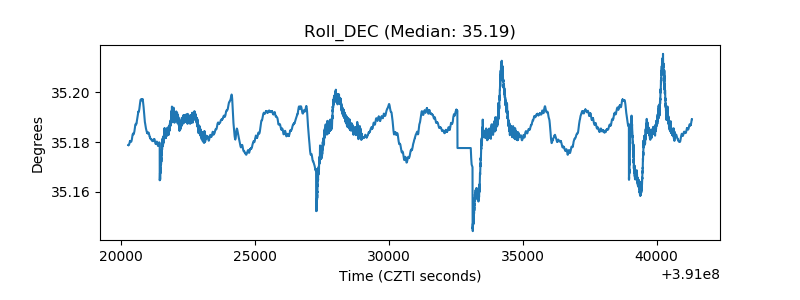 |
| _Roll_RA | 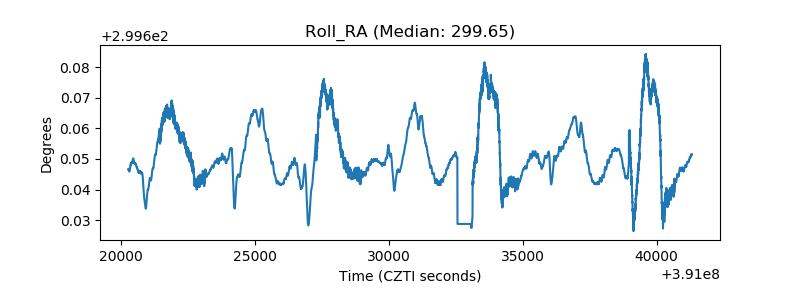 |
| Veto Counter | 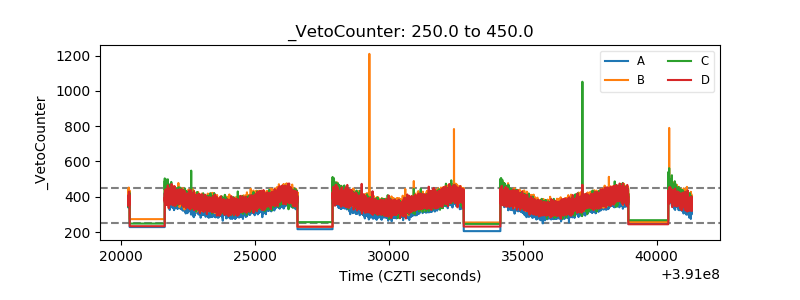 |