| Param | Original file | Final file |
|---|---|---|
| Filename | modeM0/AS1A11_080T01_9000005146_35962cztM0_level2.evt | modeM0/AS1A11_080T01_9000005146_35962cztM0_level2_quad_clean.evt |
| Size (bytes) | 1,063,108,800 | 80,305,920 |
| Size | 1013.9 MB | 76.6 MB |
| Events in quadrant A | 4,112,326 | 645,214 |
| Events in quadrant B | 15,202,634 | 262,255 |
| Events in quadrant C | 8,496,481 | 494,993 |
| Events in quadrant D | 3,977,239 | 602,975 |
| Mode M9 | |||
|---|---|---|---|
| Quadrant | BADHDUFLAG | Total packets | Discarded packets |
| A | 0 | 29 | 0 |
| B | 0 | 29 | 0 |
| C | 0 | 29 | 0 |
| D | 0 | 29 | 0 |
| Mode SS | |||
|---|---|---|---|
| Quadrant | BADHDUFLAG | Total packets | Discarded packets |
| A | 0 | 122 | 0 |
| B | 0 | 122 | 0 |
| C | 0 | 122 | 0 |
| D | 0 | 122 | 0 |
| Mode M0 | |||
|---|---|---|---|
| Quadrant | BADHDUFLAG | Total packets | Discarded packets |
| A | 0 | 16086 | 3 |
| B | 0 | 49308 | 2 |
| C | 0 | 29222 | 2 |
| D | 0 | 15719 | 2 |
| Quadrant | Total seconds | Saturated seconds | Saturation percentage |
|---|---|---|---|
| A | 6077 | 99 | 1.629093% |
| B | 6077 | 6041 | 99.407602% |
| C | 6077 | 2236 | 36.794471% |
| D | 6077 | 160 | 2.632878% |
Noise dominated data is calculated using 1-second bins in cleaned event files. If a bin has >2000 counts, and if more than 50% of those come from <1% of pixels, then it is considered to be noise-dominated and hence unusable.
| Quadrant | # 1 sec bins | Bins with >0 counts | Bins with >2000 counts | High rate bins dominated by noise | Noise dominated (total time) | Noise dominated (detector-on time) | Marked lightcurve |
|---|---|---|---|---|---|---|---|
| A | 8851 | 6079 | 56 | 56 | 0.63% | 0.92% | 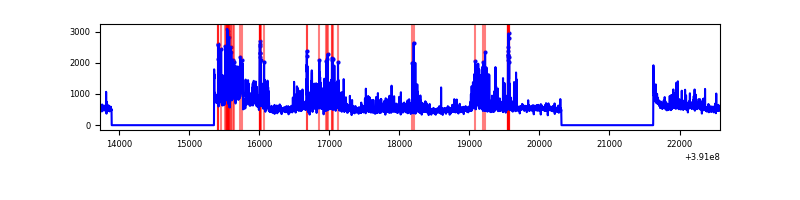 |
| B | 8851 | 6078 | 5839 | 5839 | 65.97% | 96.07% | 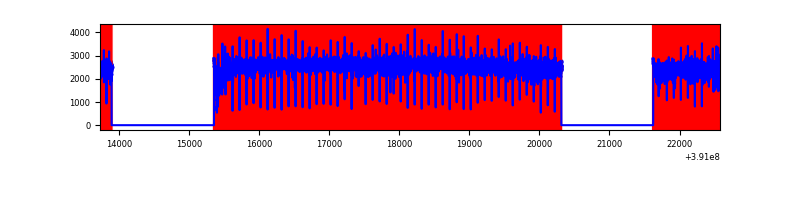 |
| C | 8851 | 6078 | 1935 | 1935 | 21.86% | 31.84% | 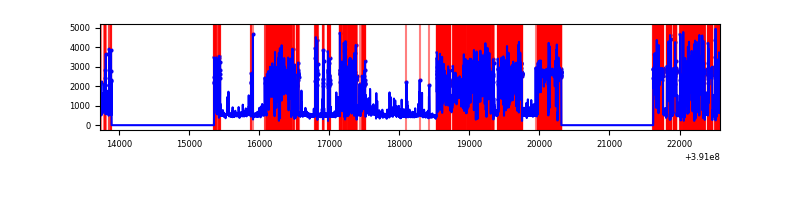 |
| D | 8851 | 6079 | 128 | 128 | 1.45% | 2.11% | 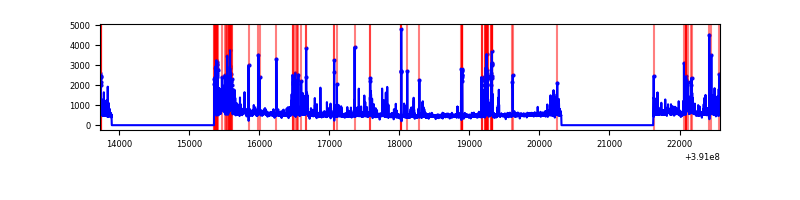 |
Top three noisy pixels from each quadrant. If the there are fewer than three noisy pixels in the level2.evt file, extra rows are filled as -1
| Pixel properties | Quadrant properties | ||||||
|---|---|---|---|---|---|---|---|
| Quadrant | DetID | PixID | Counts | Sigma | Mean | Median | Sigma |
| A | 15 | 169 | 1080935 | 7150.05 | 734 | 721 | 151.1 |
| A | 10 | 83 | 181338 | 1195.52 | 734 | 721 | 151.1 |
| A | 13 | 254 | 9401 | 57.45 | 734 | 721 | 151.1 |
| B | 5 | 31 | 4288757 | 63528.43 | 339 | 331 | 67.5 |
| B | 5 | 15 | 4275871 | 63337.54 | 339 | 331 | 67.5 |
| B | 5 | 14 | 4254945 | 63027.54 | 339 | 331 | 67.5 |
| C | 9 | 187 | 3519846 | 26963.35 | 557 | 563 | 130.5 |
| C | 0 | 207 | 2452520 | 18785.92 | 557 | 563 | 130.5 |
| C | 15 | 214 | 203928 | 1558.1 | 557 | 563 | 130.5 |
| D | 8 | 195 | 340543 | 1954.21 | 707 | 688 | 173.9 |
| D | 2 | 249 | 163575 | 936.62 | 707 | 688 | 173.9 |
| D | 7 | 223 | 146592 | 838.97 | 707 | 688 | 173.9 |
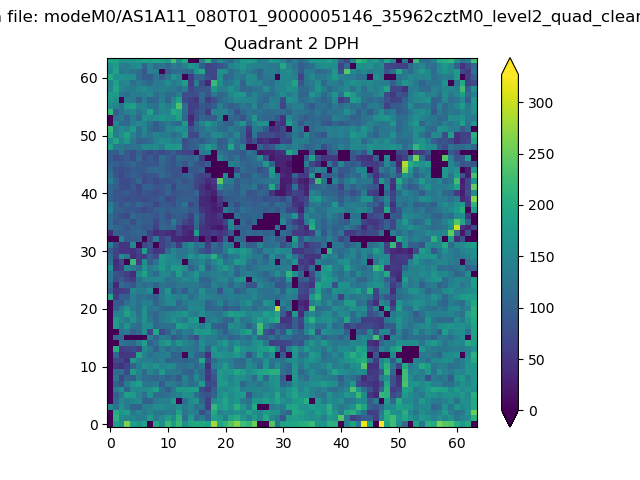
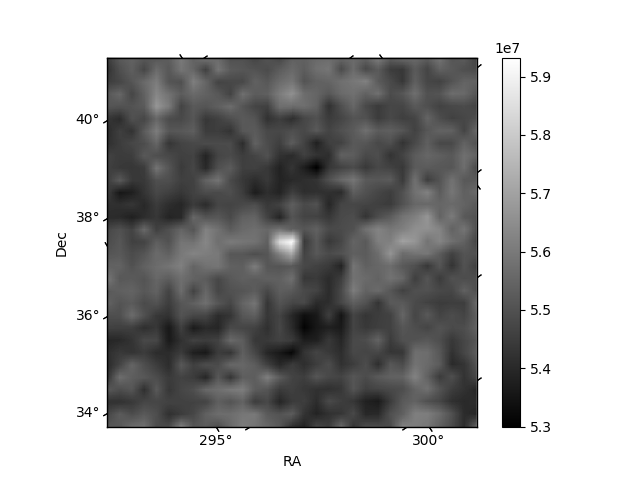
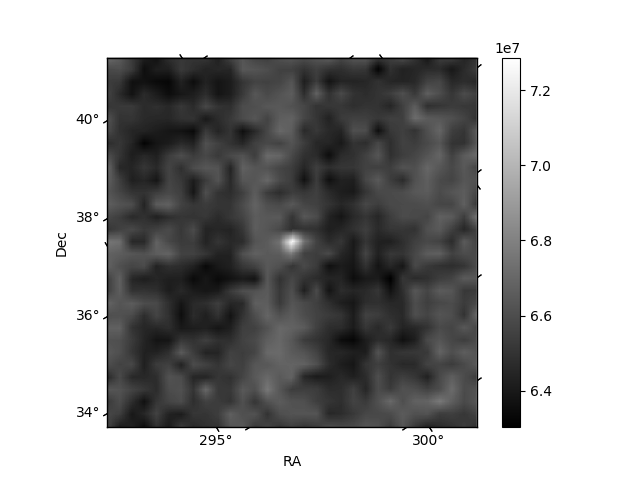
Histogram calculated using DETX and DETY for each event in the final _common_clean file
| Quadrant A | 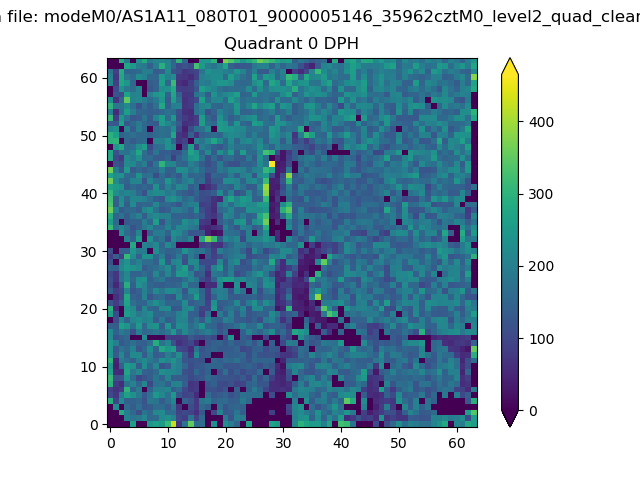 |
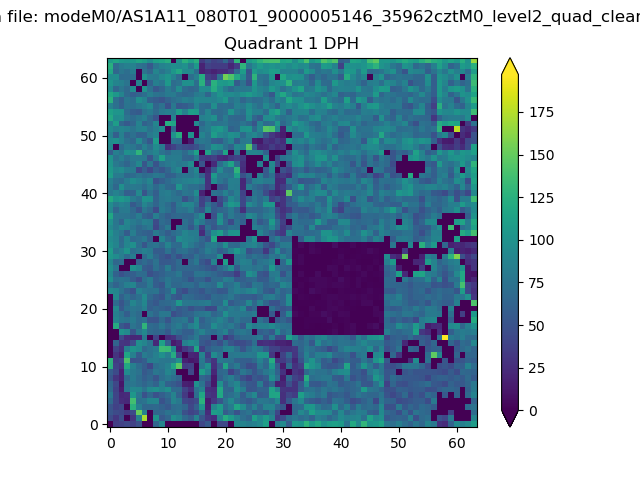 |
Quadrant B |
|---|---|---|---|
| Quadrant D | 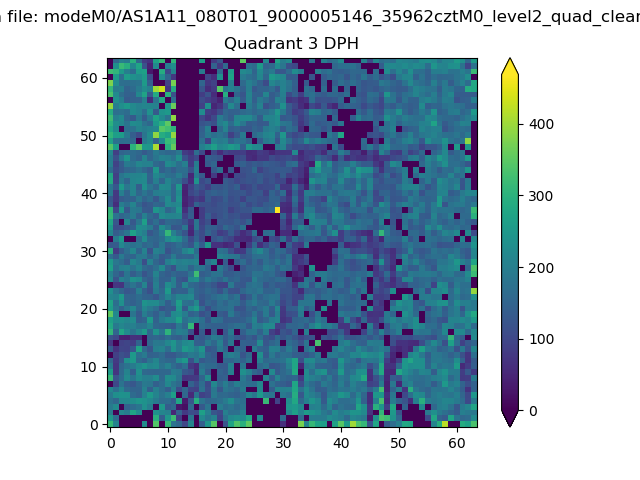 |
 |
Quadrant C |
| Plot type | Count rate plots | Images |
|---|---|---|
| Comparison with Poisson distribution Blue bars denote a histogram of data divided into 1 sec bins. Red curve is a Poisson curve with rate = median count rate of data. |
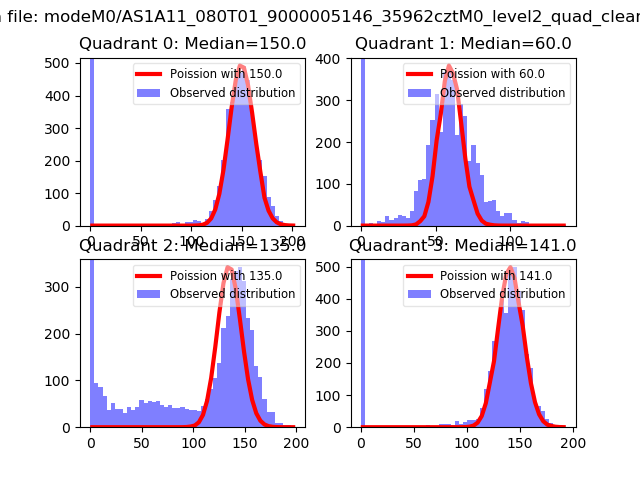 |
 |
| Quadrant-wise count rates Data is divided into 100 sec bins |
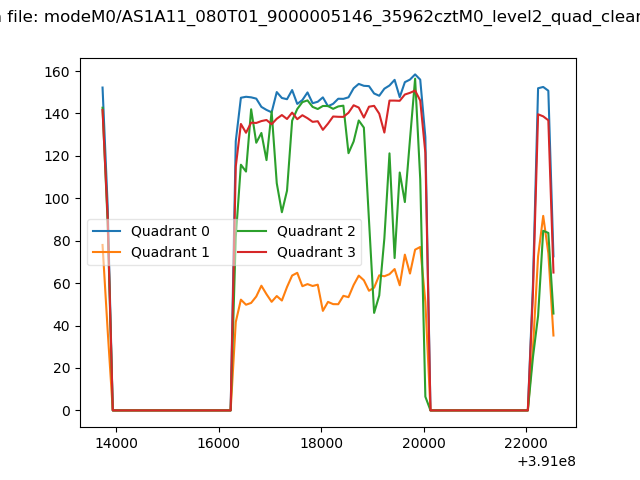 |
|
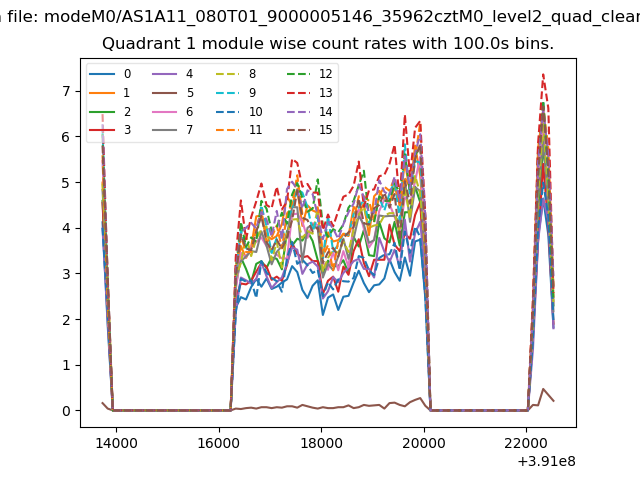
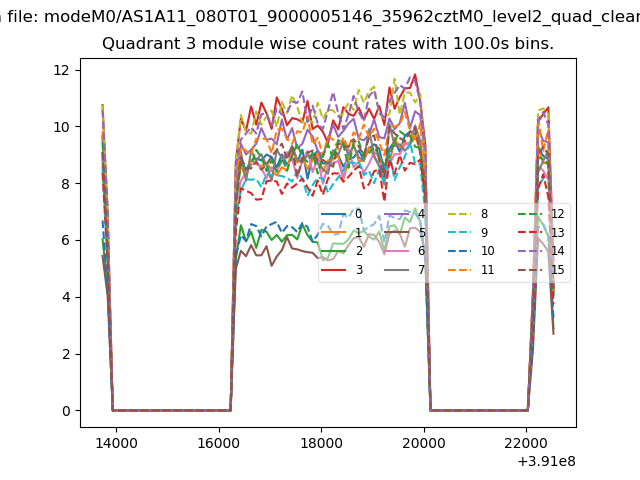
| Module-wise count rates for Quadrant A Data is divided into 100 sec bins |
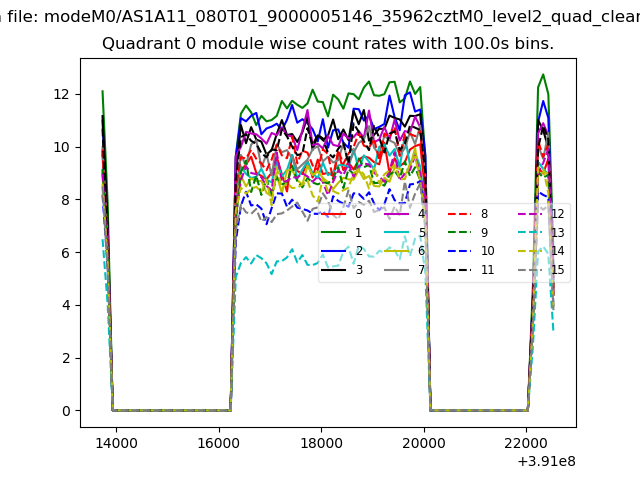 |
 |
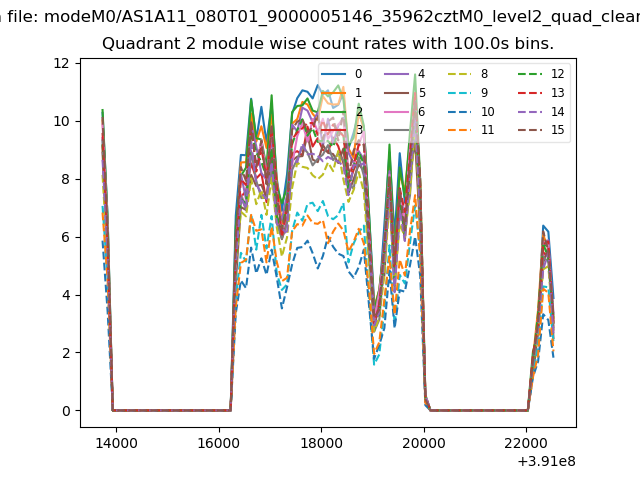
| Module-wise count rates for Quadrant B Data is divided into 100 sec bins |
 |
 |
| Module-wise count rates for Quadrant C Data is divided into 100 sec bins |
 |
 |
| Module-wise count rates for Quadrant D Data is divided into 100 sec bins |
 |
 |
| Parameter | Plot |
|---|---|
| CZT HV Monitor | 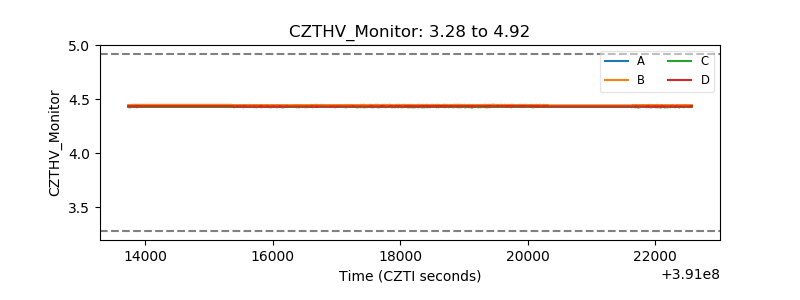 |
| D_VDD | 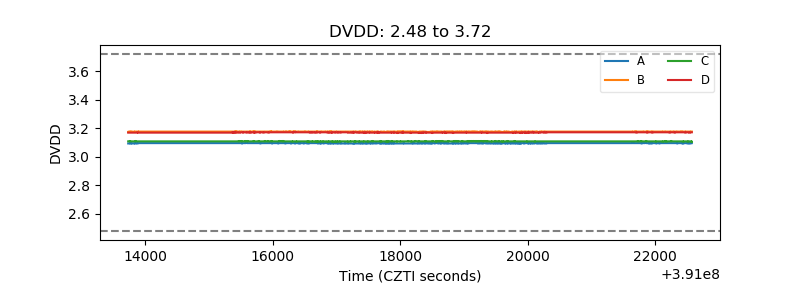 |
| Temperature 1 |  |
| Veto HV Monitor | 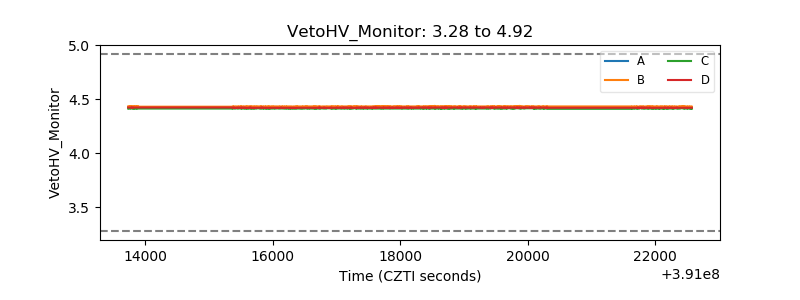 |
| Veto LLD | 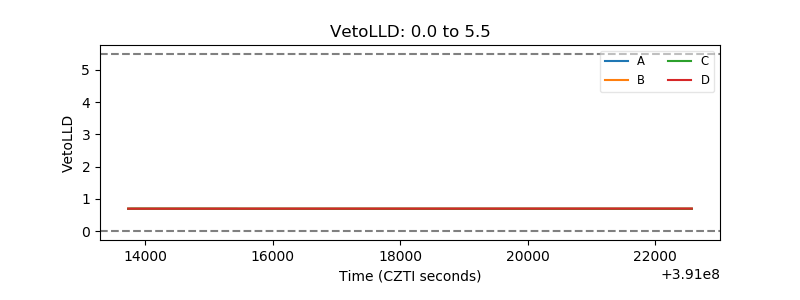 |
| Alpha Counter | 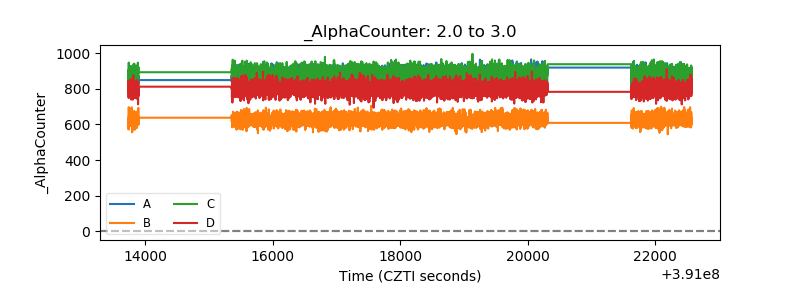 |
| _CPM_Rate | 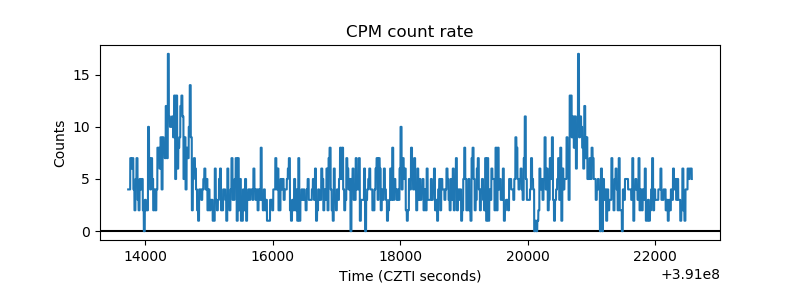 |
| CZT Counter | 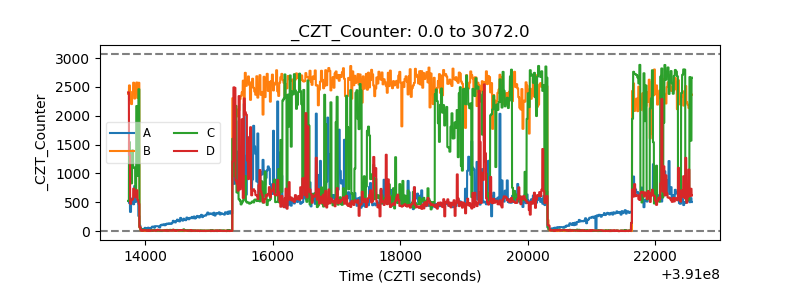 |
| +2.5 Volts monitor | 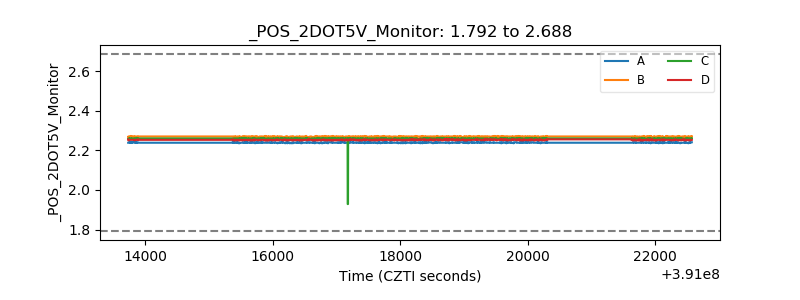 |
| +5 Volts monitor | 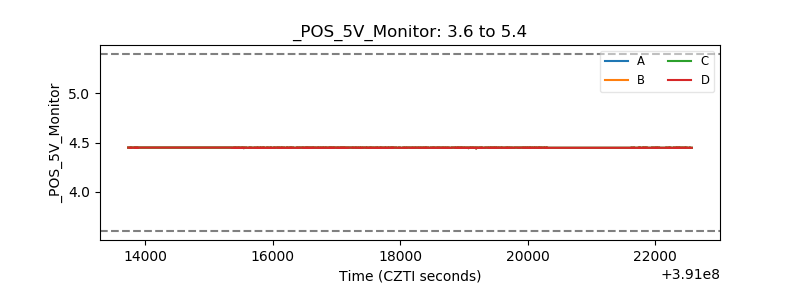 |
| _ROLL_ROT | 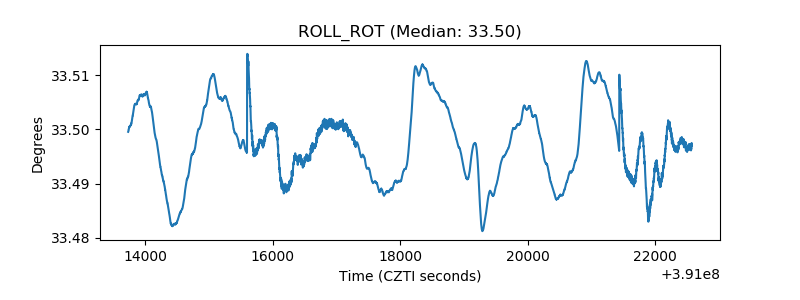 |
| _Roll_DEC | 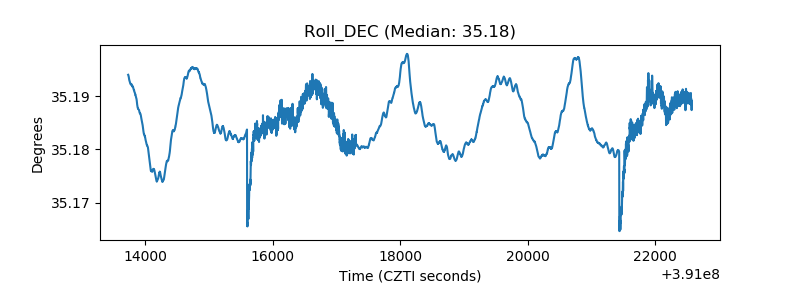 |
| _Roll_RA | 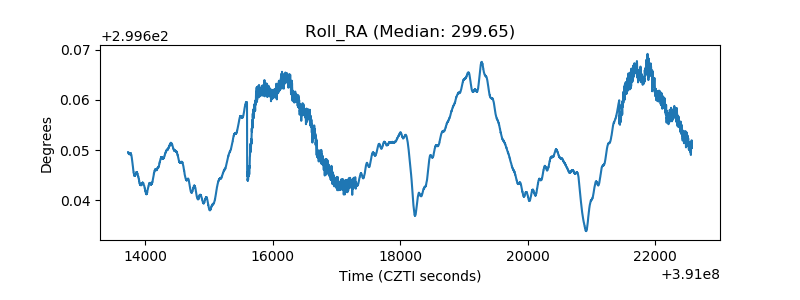 |
| Veto Counter | 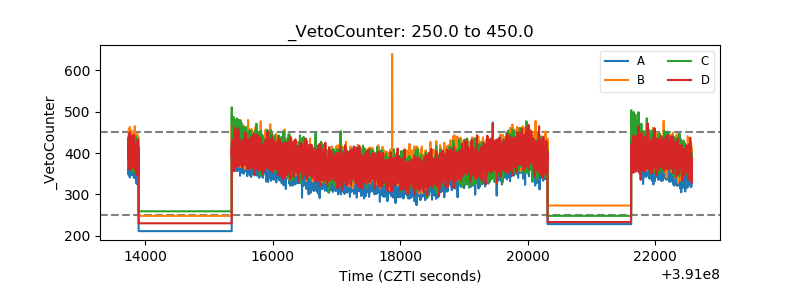 |