| Param | Original file | Final file |
|---|---|---|
| Filename | modeM0/AS1A11_080T01_9000005146_35961cztM0_level2.evt | modeM0/AS1A11_080T01_9000005146_35961cztM0_level2_quad_clean.evt |
| Size (bytes) | 841,659,840 | 69,050,880 |
| Size | 802.7 MB | 65.9 MB |
| Events in quadrant A | 3,332,280 | 515,246 |
| Events in quadrant B | 13,890,172 | 213,868 |
| Events in quadrant C | 3,635,100 | 496,513 |
| Events in quadrant D | 4,252,481 | 470,425 |
| Mode M9 | |||
|---|---|---|---|
| Quadrant | BADHDUFLAG | Total packets | Discarded packets |
| A | 0 | 29 | 0 |
| B | 0 | 29 | 0 |
| C | 0 | 29 | 0 |
| D | 0 | 30 | 0 |
| Mode SS | |||
|---|---|---|---|
| Quadrant | BADHDUFLAG | Total packets | Discarded packets |
| A | 0 | 114 | 0 |
| B | 0 | 114 | 0 |
| C | 0 | 114 | 0 |
| D | 0 | 114 | 0 |
| Mode M0 | |||
|---|---|---|---|
| Quadrant | BADHDUFLAG | Total packets | Discarded packets |
| A | 0 | 13357 | 3 |
| B | 0 | 45064 | 2 |
| C | 0 | 14120 | 2 |
| D | 0 | 16455 | 2 |
| Quadrant | Total seconds | Saturated seconds | Saturation percentage |
|---|---|---|---|
| A | 5621 | 108 | 1.921366% |
| B | 5621 | 5504 | 97.918520% |
| C | 5621 | 182 | 3.237858% |
| D | 5621 | 257 | 4.572140% |
Noise dominated data is calculated using 1-second bins in cleaned event files. If a bin has >2000 counts, and if more than 50% of those come from <1% of pixels, then it is considered to be noise-dominated and hence unusable.
| Quadrant | # 1 sec bins | Bins with >0 counts | Bins with >2000 counts | High rate bins dominated by noise | Noise dominated (total time) | Noise dominated (detector-on time) | Marked lightcurve |
|---|---|---|---|---|---|---|---|
| A | 7083 | 5622 | 49 | 49 | 0.69% | 0.87% | 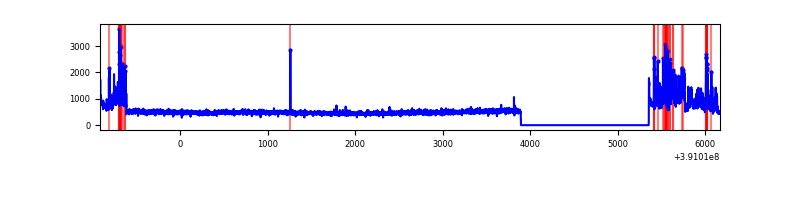 |
| B | 7083 | 5621 | 5271 | 5271 | 74.42% | 93.77% | 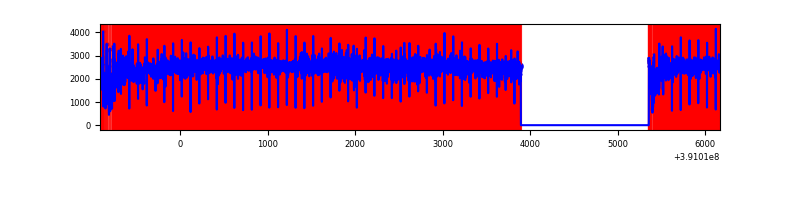 |
| C | 7083 | 5622 | 121 | 121 | 1.71% | 2.15% | 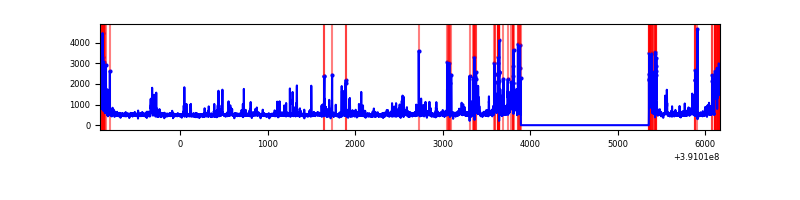 |
| D | 7083 | 5622 | 228 | 228 | 3.22% | 4.06% | 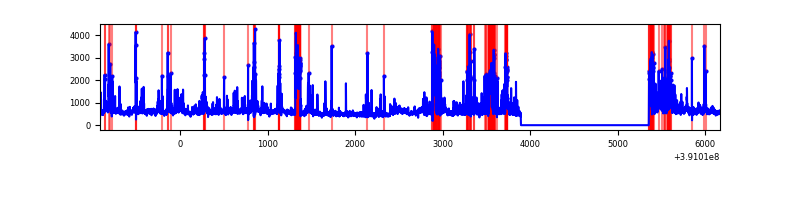 |
Top three noisy pixels from each quadrant. If the there are fewer than three noisy pixels in the level2.evt file, extra rows are filled as -1
| Pixel properties | Quadrant properties | ||||||
|---|---|---|---|---|---|---|---|
| Quadrant | DetID | PixID | Counts | Sigma | Mean | Median | Sigma |
| A | 15 | 169 | 548542 | 3950.91 | 672 | 660 | 138.7 |
| A | 10 | 83 | 173889 | 1249.2 | 672 | 660 | 138.7 |
| A | 13 | 254 | 9077 | 60.7 | 672 | 660 | 138.7 |
| B | 5 | 14 | 3656232 | 59790.63 | 307 | 300 | 61.1 |
| B | 5 | 31 | 3647939 | 59655.0 | 307 | 300 | 61.1 |
| B | 5 | 15 | 3635248 | 59447.45 | 307 | 300 | 61.1 |
| C | 9 | 187 | 505214 | 3340.1 | 644 | 650 | 151.1 |
| C | 15 | 214 | 235073 | 1551.83 | 644 | 650 | 151.1 |
| C | 0 | 10 | 205403 | 1355.42 | 644 | 650 | 151.1 |
| D | 2 | 249 | 534600 | 3361.01 | 643 | 625 | 158.9 |
| D | 8 | 195 | 488716 | 3072.2 | 643 | 625 | 158.9 |
| D | 7 | 223 | 204436 | 1282.85 | 643 | 625 | 158.9 |
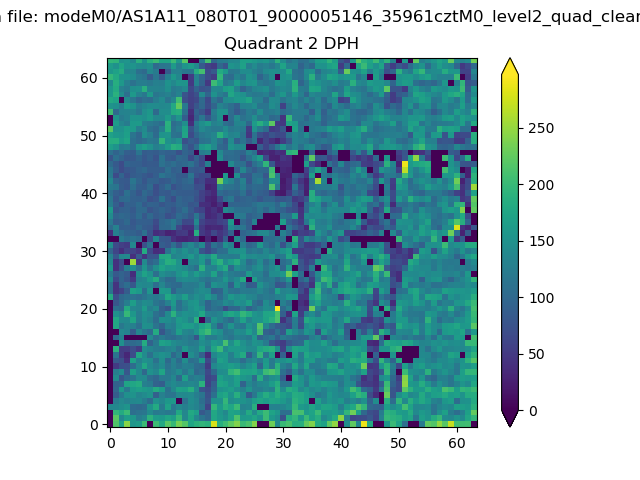
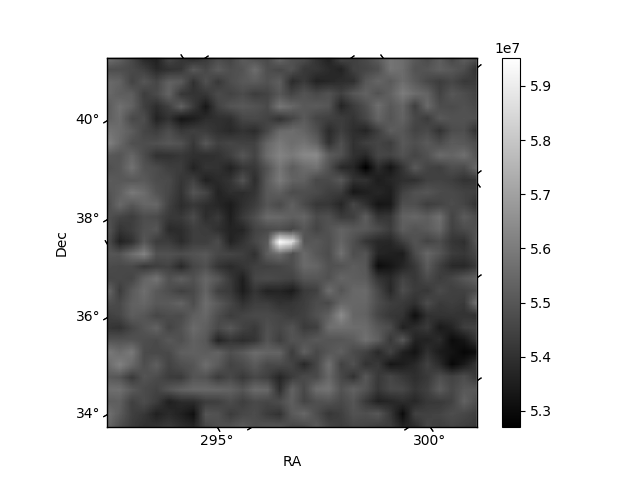
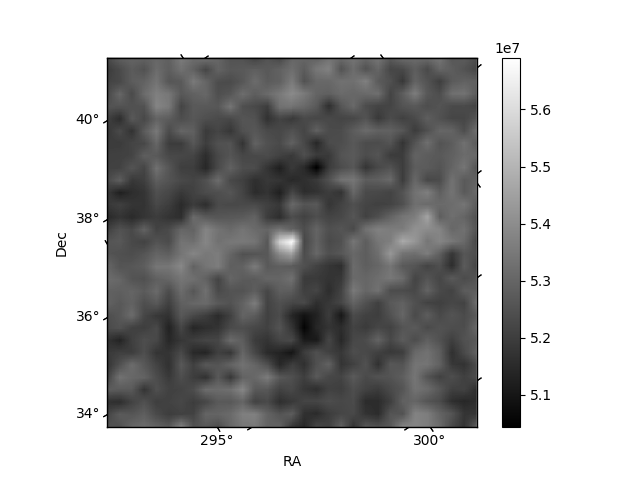
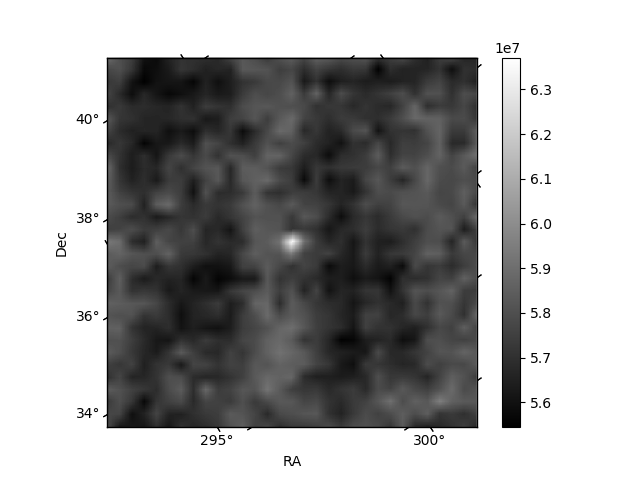
Histogram calculated using DETX and DETY for each event in the final _common_clean file
| Quadrant A | 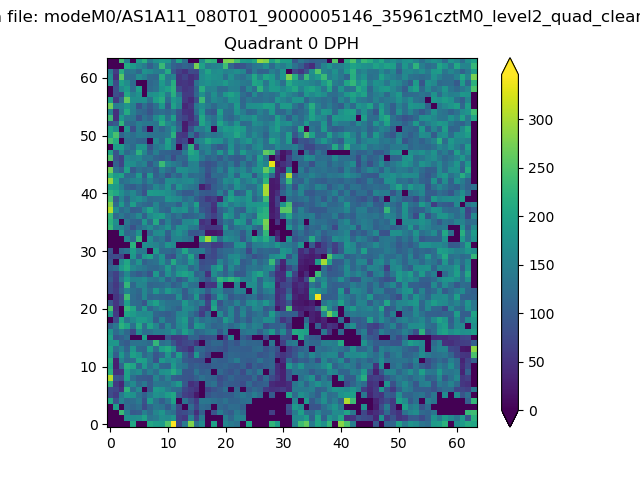 |
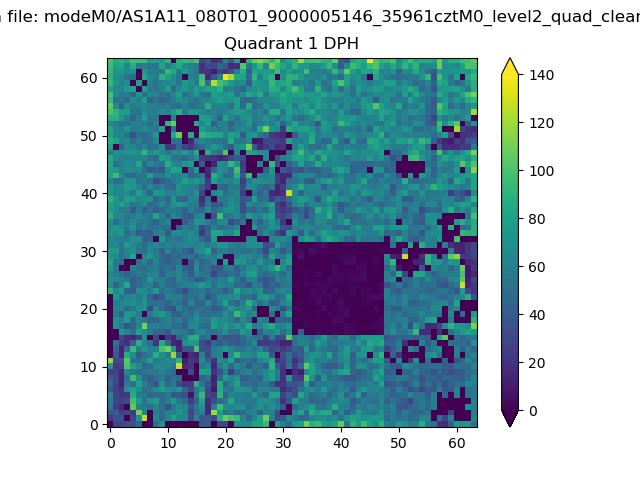 |
Quadrant B |
|---|---|---|---|
| Quadrant D | 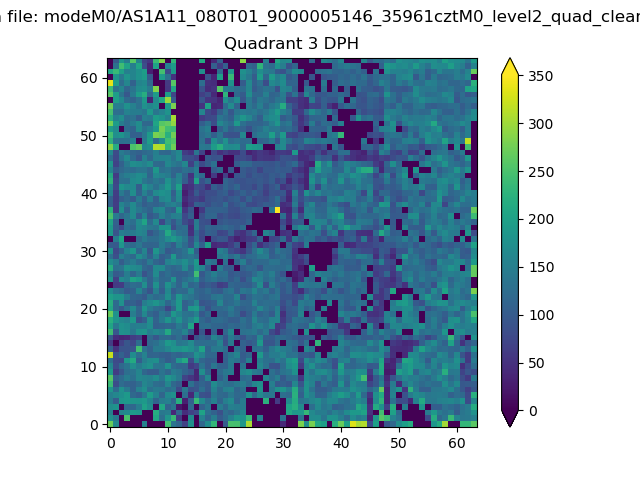 |
 |
Quadrant C |
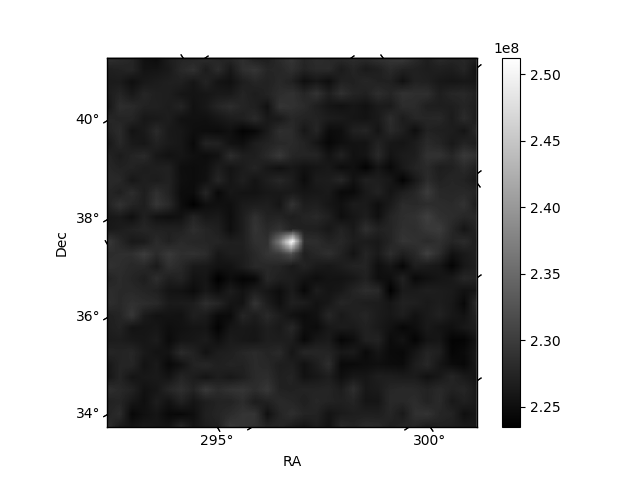
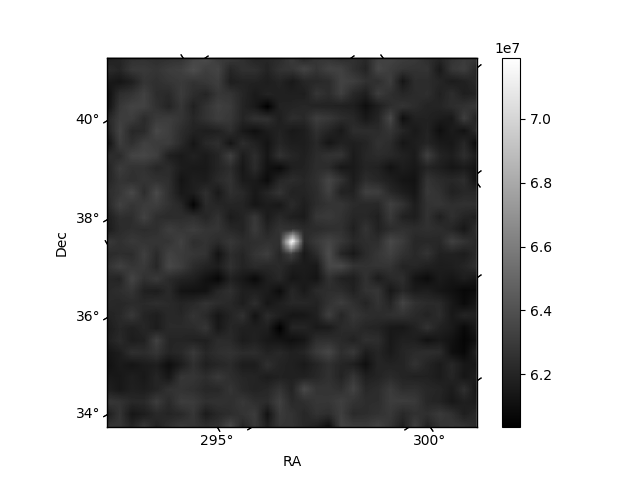
| Plot type | Count rate plots | Images |
|---|---|---|
| Comparison with Poisson distribution Blue bars denote a histogram of data divided into 1 sec bins. Red curve is a Poisson curve with rate = median count rate of data. |
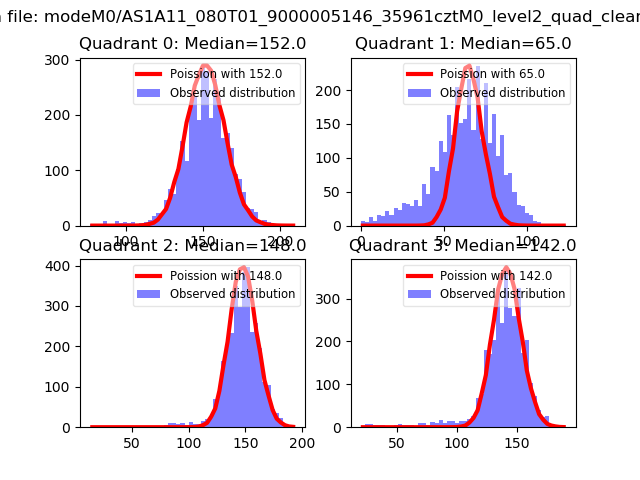 |
 |
| Quadrant-wise count rates Data is divided into 100 sec bins |
 |
|
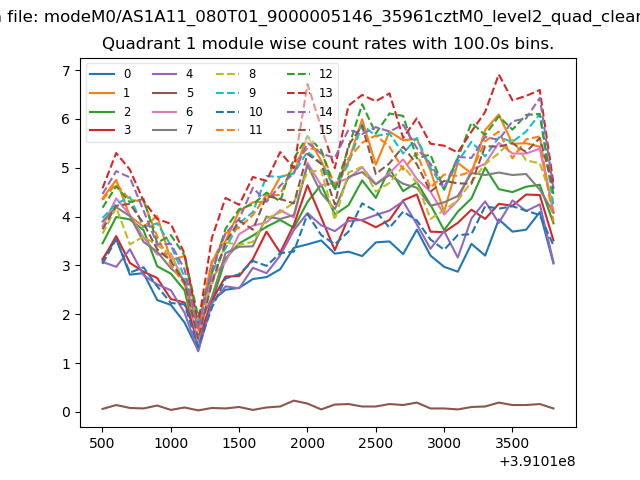
| Module-wise count rates for Quadrant A Data is divided into 100 sec bins |
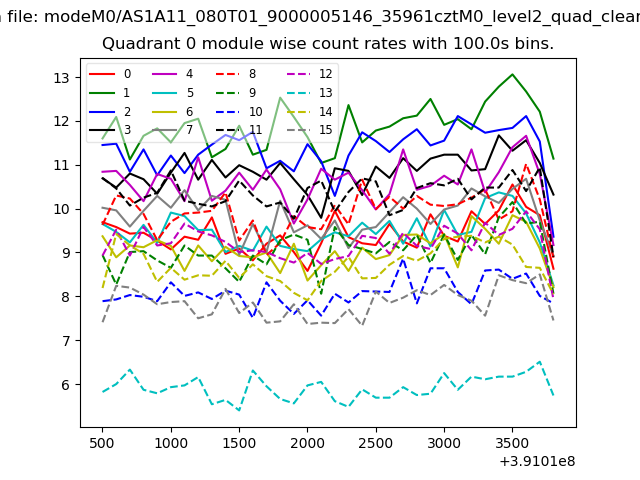 |
 |
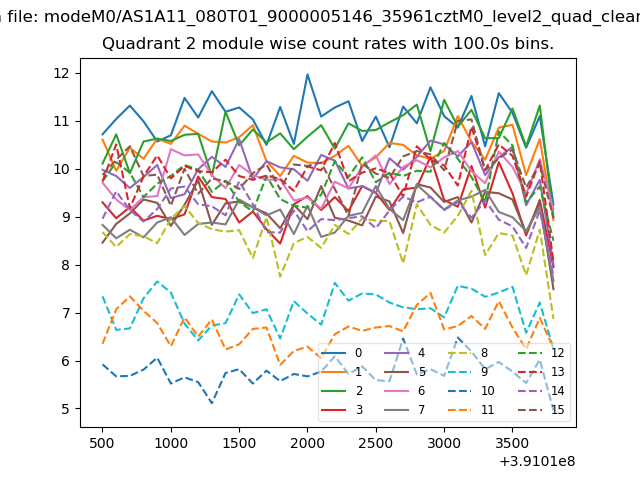
| Module-wise count rates for Quadrant B Data is divided into 100 sec bins |
 |
 |
| Module-wise count rates for Quadrant C Data is divided into 100 sec bins |
 |
 |
| Module-wise count rates for Quadrant D Data is divided into 100 sec bins |
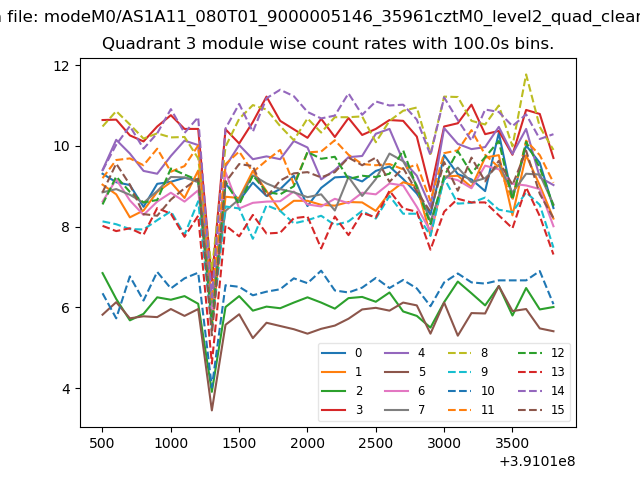 |
 |
| Parameter | Plot |
|---|---|
| CZT HV Monitor | 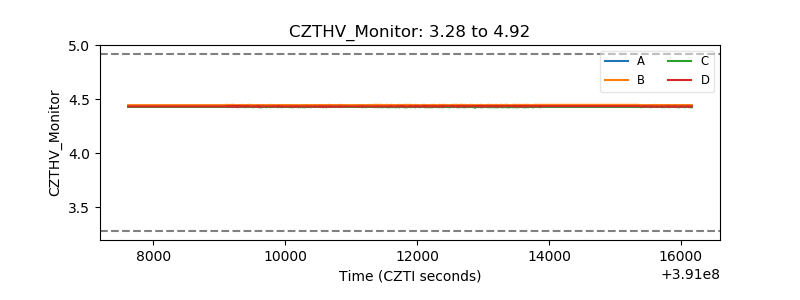 |
| D_VDD | 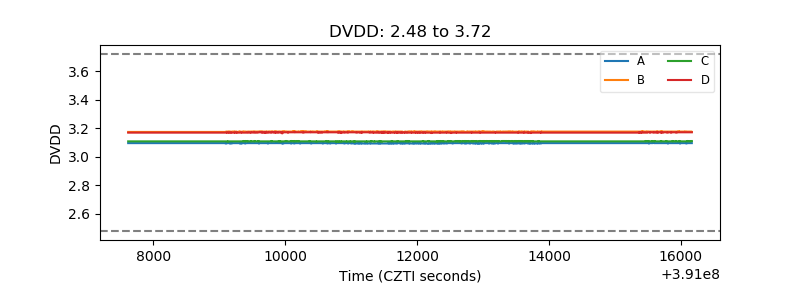 |
| Temperature 1 | 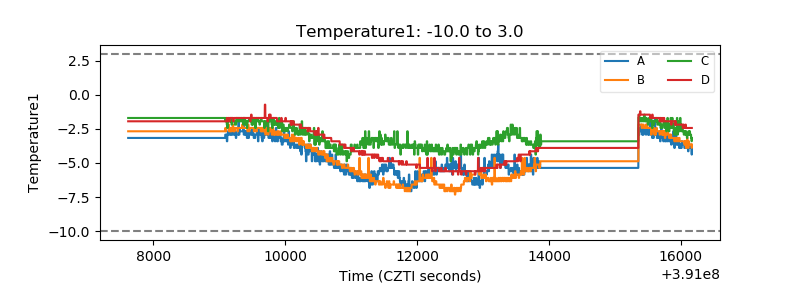 |
| Veto HV Monitor | 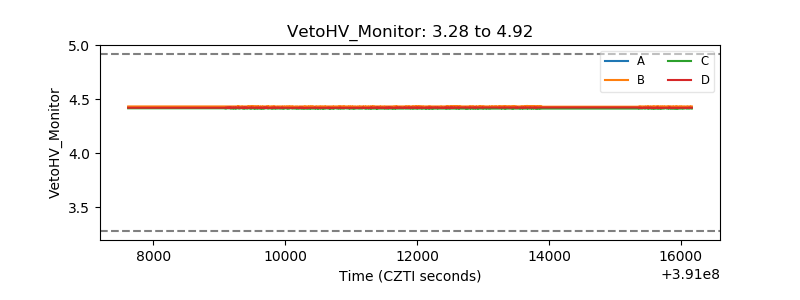 |
| Veto LLD | 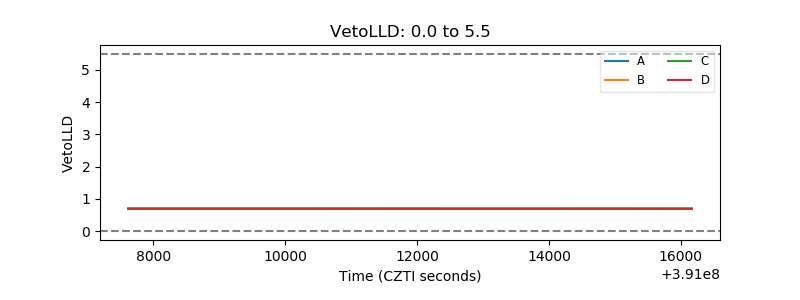 |
| Alpha Counter | 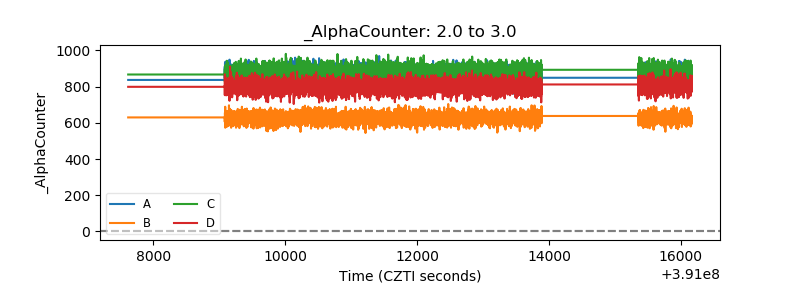 |
| _CPM_Rate | 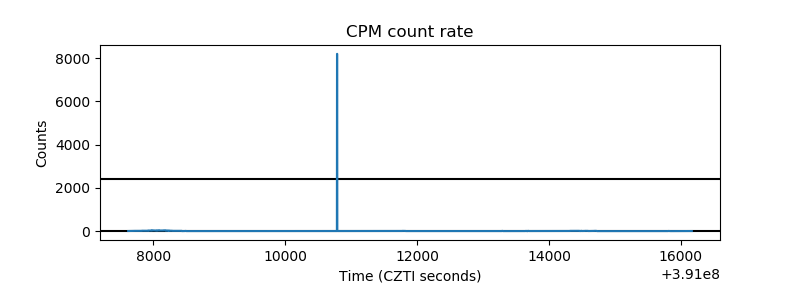 |
| CZT Counter | 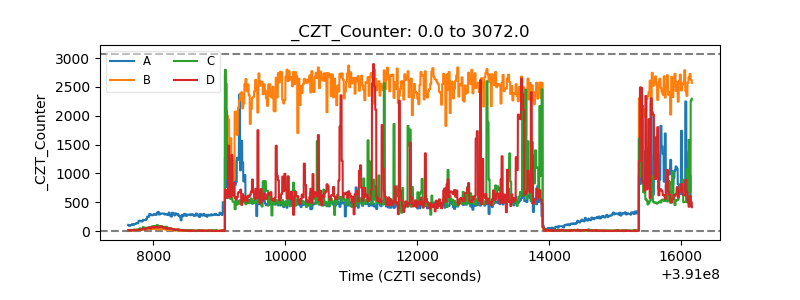 |
| +2.5 Volts monitor | 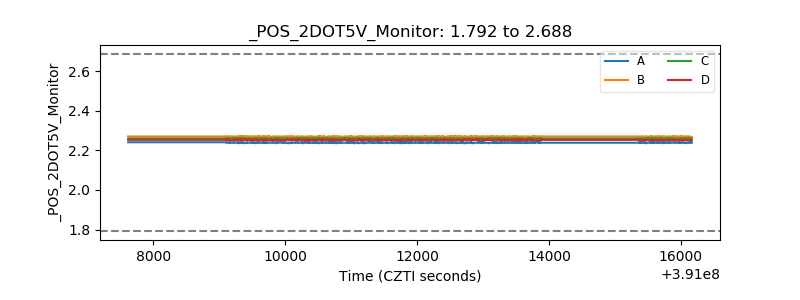 |
| +5 Volts monitor | 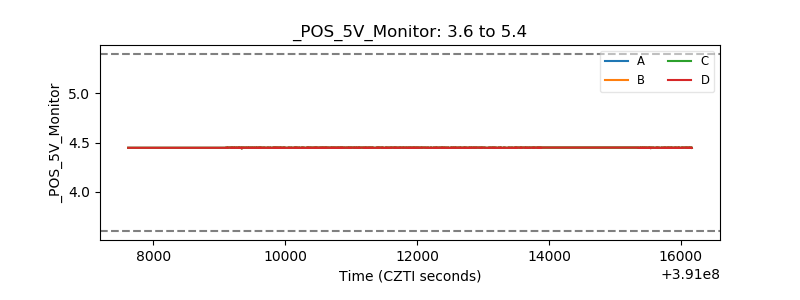 |
| _ROLL_ROT | 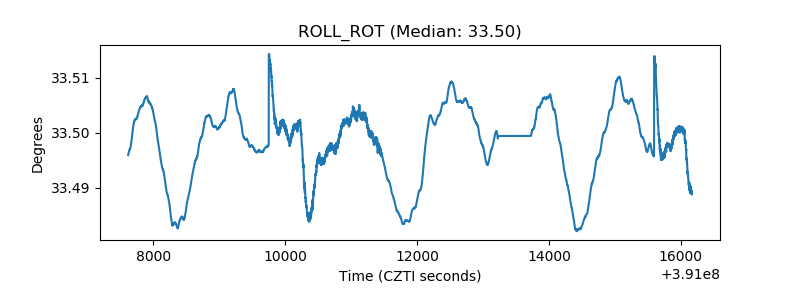 |
| _Roll_DEC | 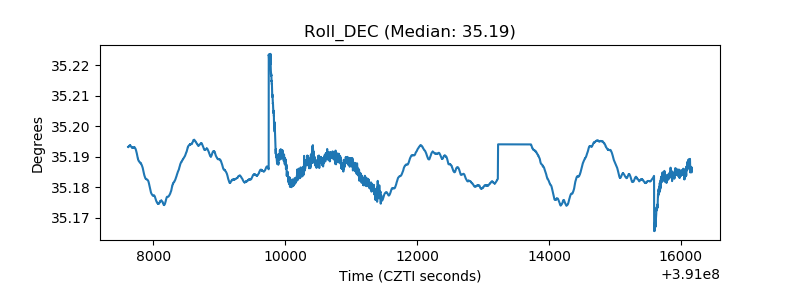 |
| _Roll_RA | 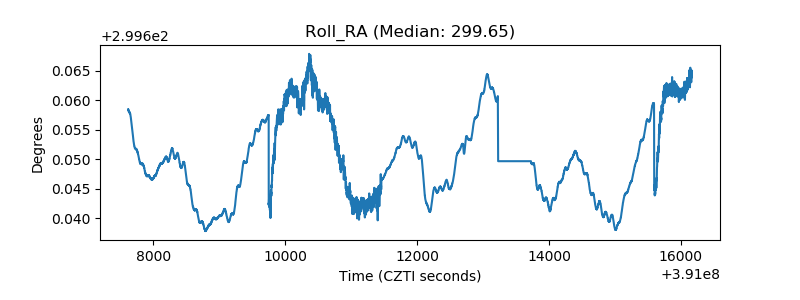 |
| Veto Counter | 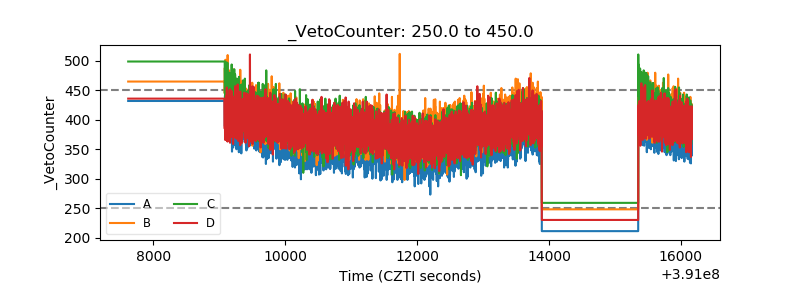 |