| Param | Original file | Final file |
|---|---|---|
| Filename | modeM0/AS1A11_080T01_9000005146_35960cztM0_level2.evt | modeM0/AS1A11_080T01_9000005146_35960cztM0_level2_quad_clean.evt |
| Size (bytes) | 767,295,360 | 56,733,120 |
| Size | 731.7 MB | 54.1 MB |
| Events in quadrant A | 3,068,365 | 406,115 |
| Events in quadrant B | 13,101,331 | 159,918 |
| Events in quadrant C | 3,013,084 | 394,220 |
| Events in quadrant D | 3,687,858 | 376,382 |
| Mode M9 | |||
|---|---|---|---|
| Quadrant | BADHDUFLAG | Total packets | Discarded packets |
| A | 0 | 35 | 0 |
| B | 0 | 35 | 0 |
| C | 0 | 35 | 0 |
| D | 0 | 36 | 0 |
| Mode SS | |||
|---|---|---|---|
| Quadrant | BADHDUFLAG | Total packets | Discarded packets |
| A | 0 | 112 | 0 |
| B | 0 | 112 | 0 |
| C | 0 | 112 | 0 |
| D | 0 | 112 | 0 |
| Mode M0 | |||
|---|---|---|---|
| Quadrant | BADHDUFLAG | Total packets | Discarded packets |
| A | 0 | 12354 | 3 |
| B | 0 | 42592 | 2 |
| C | 0 | 11957 | 2 |
| D | 0 | 14414 | 2 |
| Quadrant | Total seconds | Saturated seconds | Saturation percentage |
|---|---|---|---|
| A | 5418 | 83 | 1.531931% |
| B | 5418 | 5111 | 94.333702% |
| C | 5418 | 50 | 0.922850% |
| D | 5418 | 123 | 2.270210% |
Noise dominated data is calculated using 1-second bins in cleaned event files. If a bin has >2000 counts, and if more than 50% of those come from <1% of pixels, then it is considered to be noise-dominated and hence unusable.
| Quadrant | # 1 sec bins | Bins with >0 counts | Bins with >2000 counts | High rate bins dominated by noise | Noise dominated (total time) | Noise dominated (detector-on time) | Marked lightcurve |
|---|---|---|---|---|---|---|---|
| A | 7210 | 5419 | 46 | 46 | 0.64% | 0.85% | 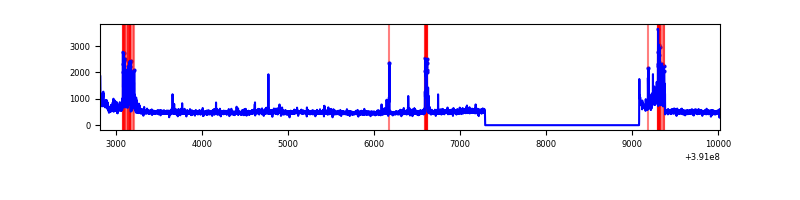 |
| B | 7210 | 5419 | 4845 | 4845 | 67.20% | 89.41% | 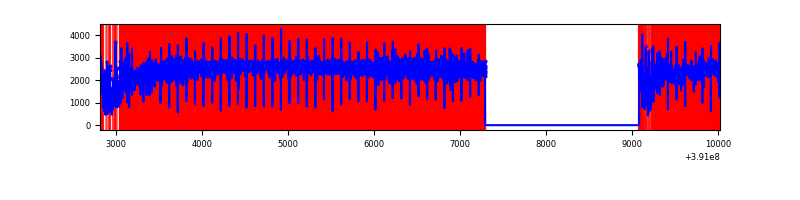 |
| C | 7210 | 5419 | 41 | 41 | 0.57% | 0.76% | 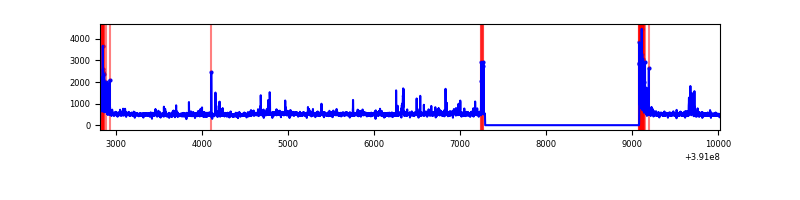 |
| D | 7210 | 5419 | 112 | 112 | 1.55% | 2.07% | 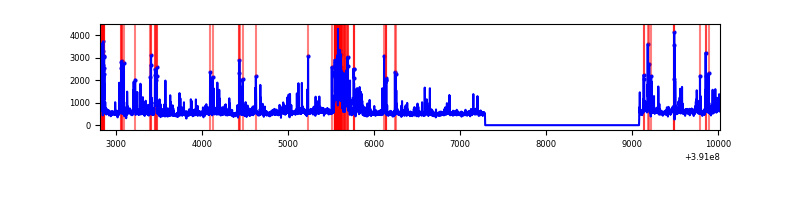 |
Top three noisy pixels from each quadrant. If the there are fewer than three noisy pixels in the level2.evt file, extra rows are filled as -1
| Pixel properties | Quadrant properties | ||||||
|---|---|---|---|---|---|---|---|
| Quadrant | DetID | PixID | Counts | Sigma | Mean | Median | Sigma |
| A | 15 | 169 | 367255 | 2770.17 | 651 | 641 | 132.3 |
| A | 10 | 83 | 167311 | 1259.37 | 651 | 641 | 132.3 |
| A | 8 | 144 | 10234 | 72.49 | 651 | 641 | 132.3 |
| B | 5 | 14 | 3434585 | 56514.75 | 313 | 307 | 60.8 |
| B | 5 | 31 | 3411594 | 56136.41 | 313 | 307 | 60.8 |
| B | 5 | 15 | 3400823 | 55959.16 | 313 | 307 | 60.8 |
| C | 15 | 214 | 228026 | 1560.53 | 626 | 633 | 145.7 |
| C | 0 | 10 | 171190 | 1170.48 | 626 | 633 | 145.7 |
| C | 0 | 207 | 84282 | 574.06 | 626 | 633 | 145.7 |
| D | 8 | 195 | 373907 | 2394.85 | 628 | 609 | 155.9 |
| D | 2 | 249 | 299210 | 1915.64 | 628 | 609 | 155.9 |
| D | 2 | 250 | 165950 | 1060.73 | 628 | 609 | 155.9 |
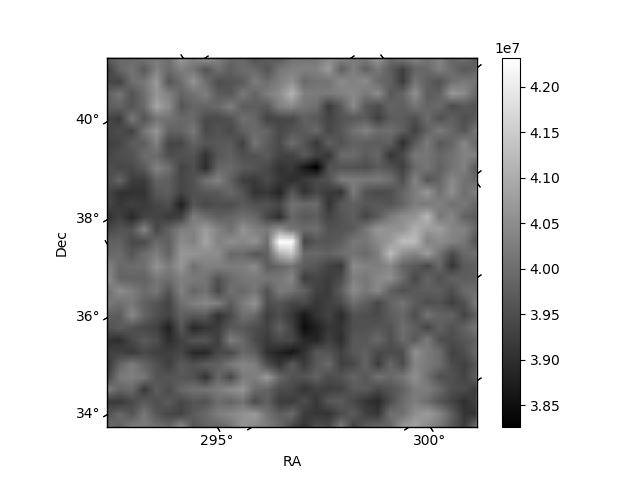
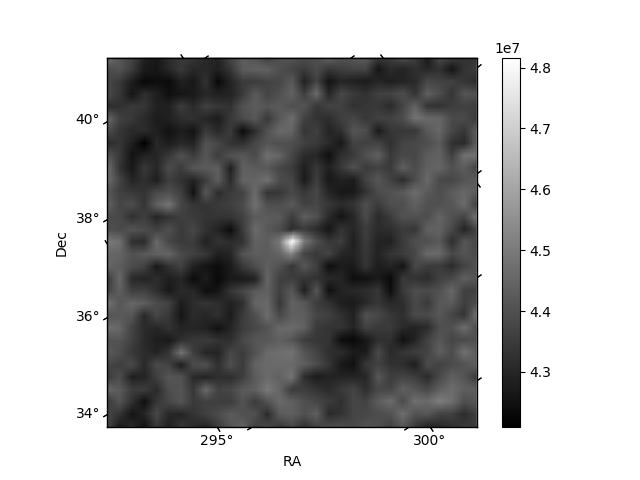
Histogram calculated using DETX and DETY for each event in the final _common_clean file
| Quadrant A | 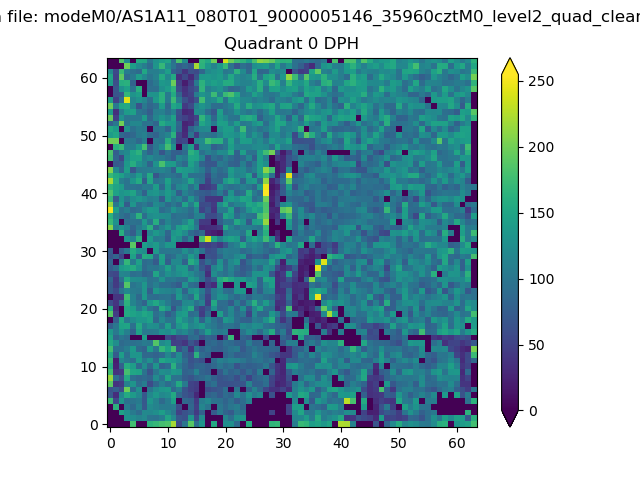 |
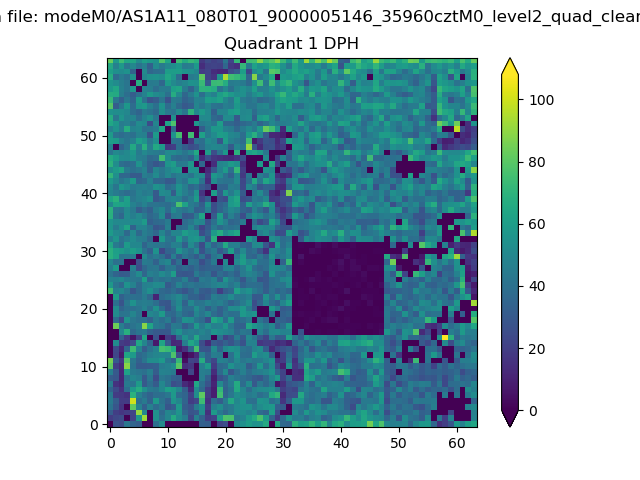 |
Quadrant B |
|---|---|---|---|
| Quadrant D | 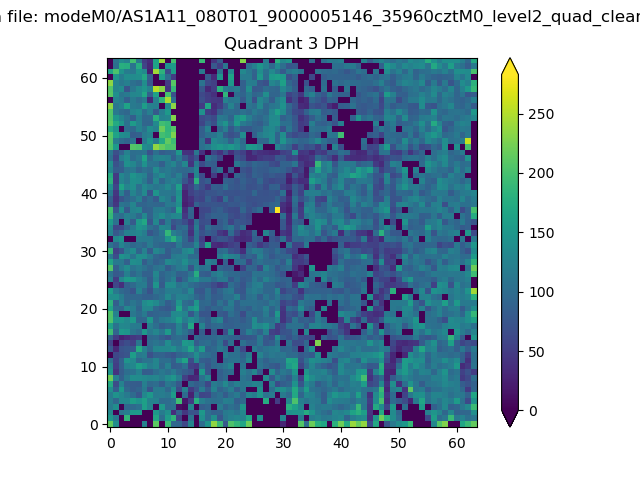 |
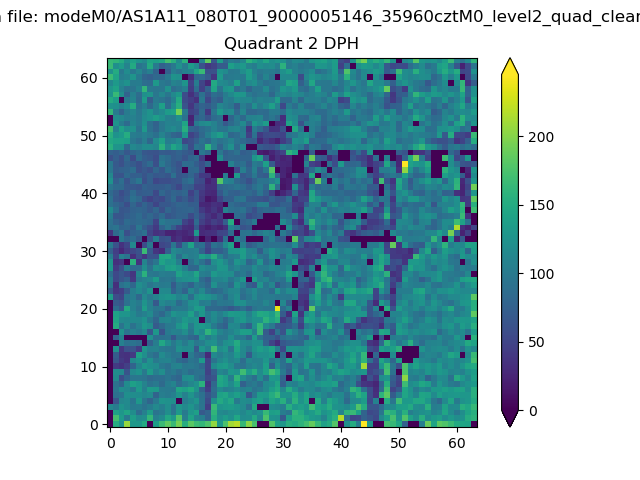 |
Quadrant C |
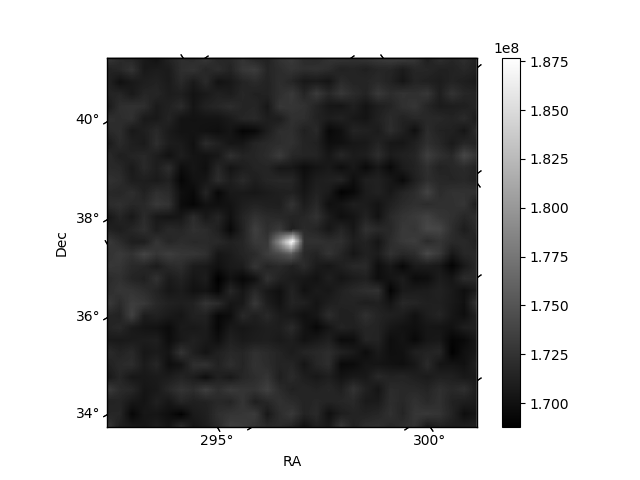
| Plot type | Count rate plots | Images |
|---|---|---|
| Comparison with Poisson distribution Blue bars denote a histogram of data divided into 1 sec bins. Red curve is a Poisson curve with rate = median count rate of data. |
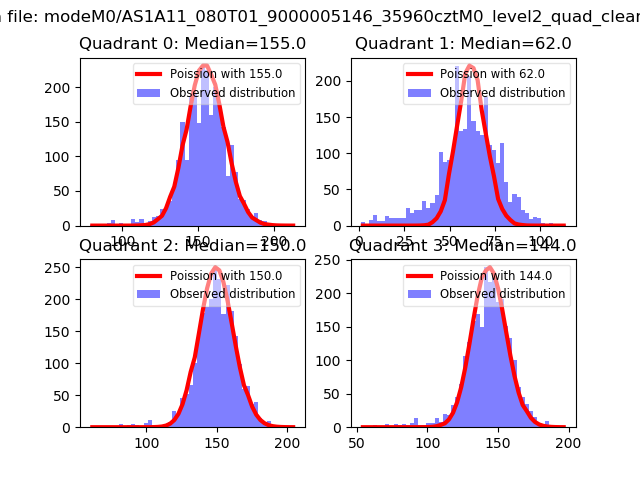 |
 |
| Quadrant-wise count rates Data is divided into 100 sec bins |
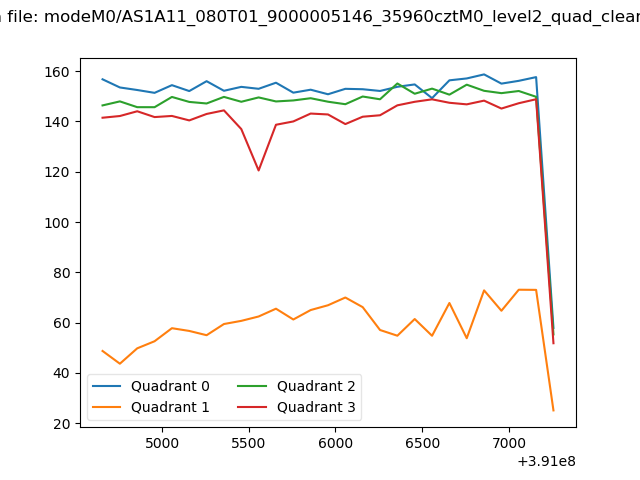 |
|
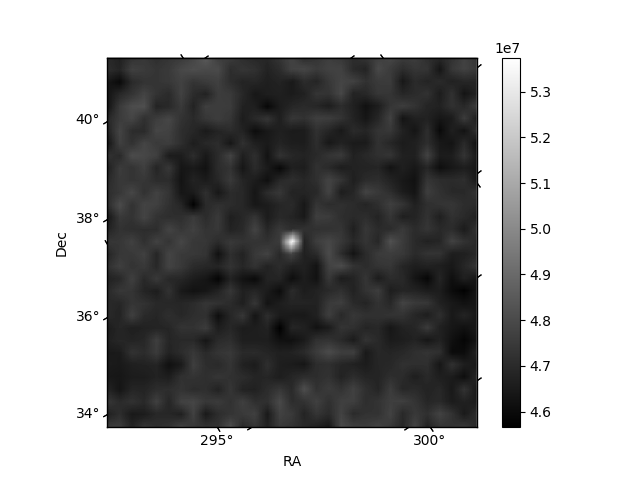
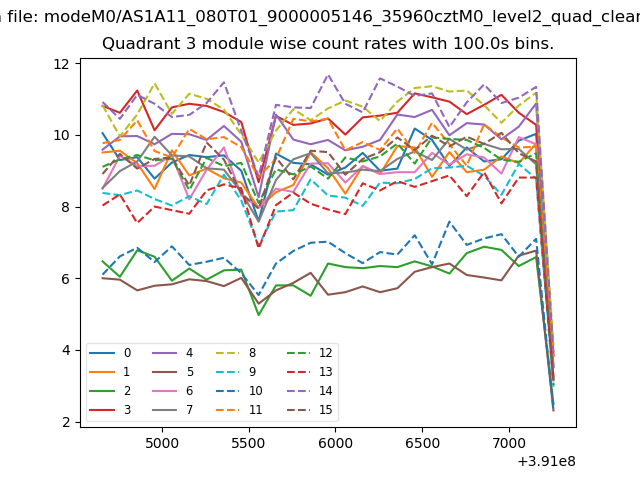
| Module-wise count rates for Quadrant A Data is divided into 100 sec bins |
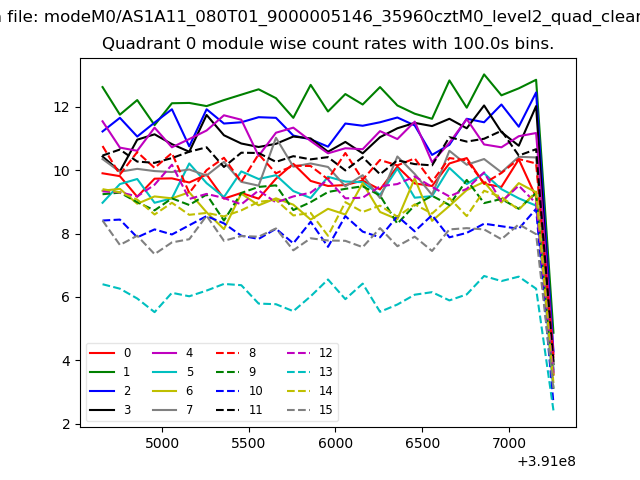 |
 |
| Module-wise count rates for Quadrant B Data is divided into 100 sec bins |
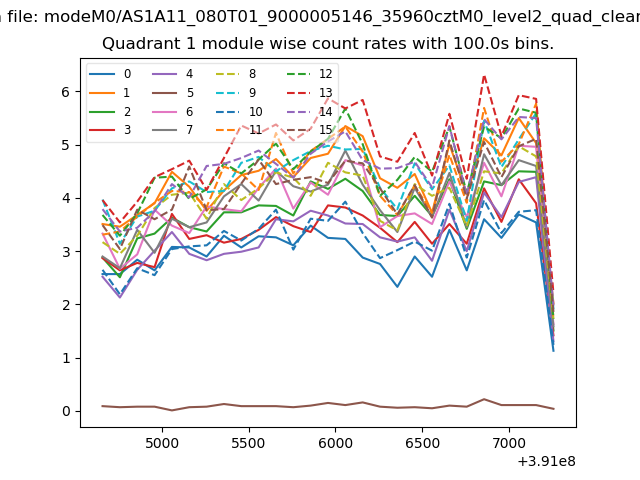 |
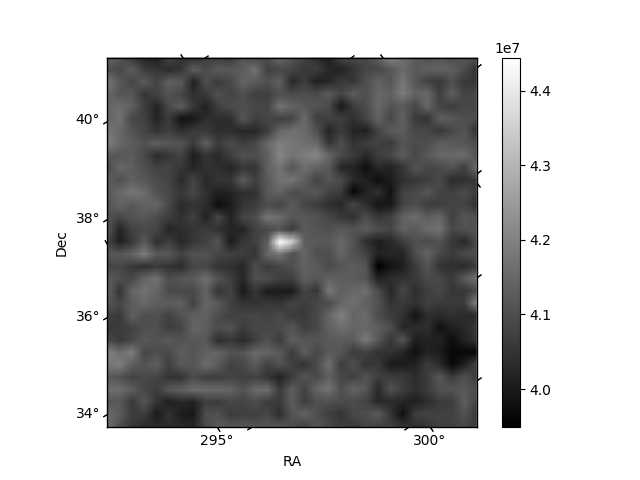 |
| Module-wise count rates for Quadrant C Data is divided into 100 sec bins |
 |
 |
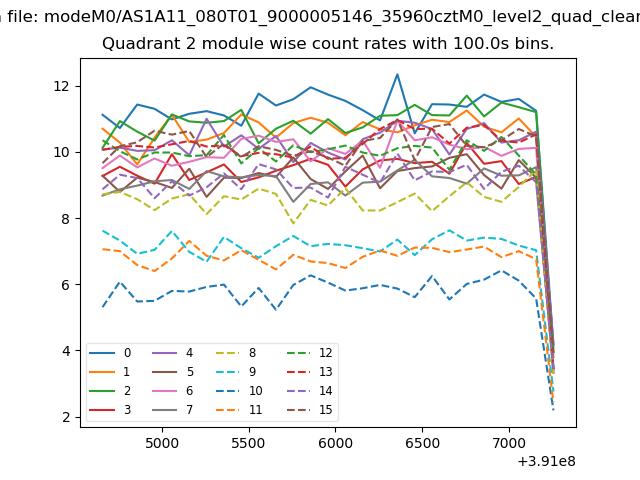
| Module-wise count rates for Quadrant D Data is divided into 100 sec bins |
 |
 |
| Parameter | Plot |
|---|---|
| CZT HV Monitor | 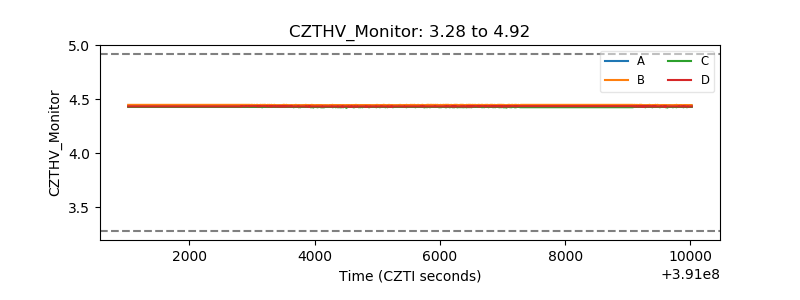 |
| D_VDD | 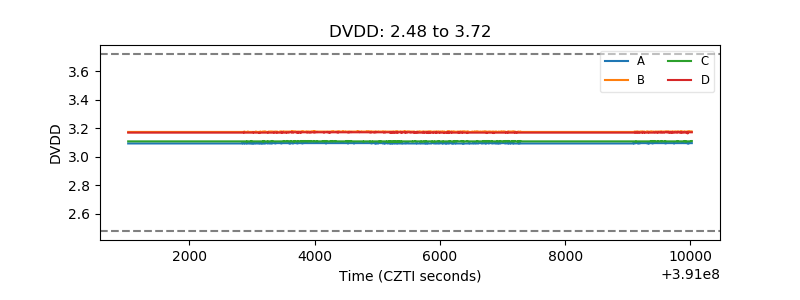 |
| Temperature 1 | 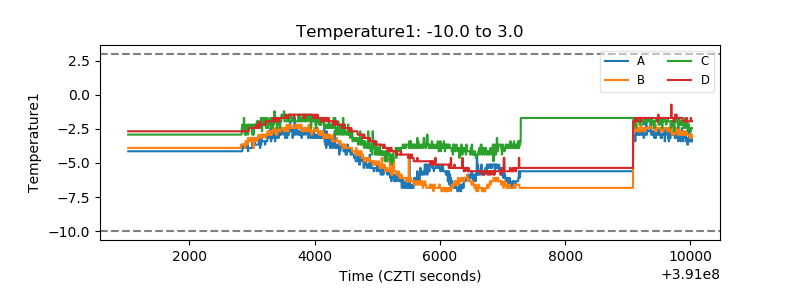 |
| Veto HV Monitor | 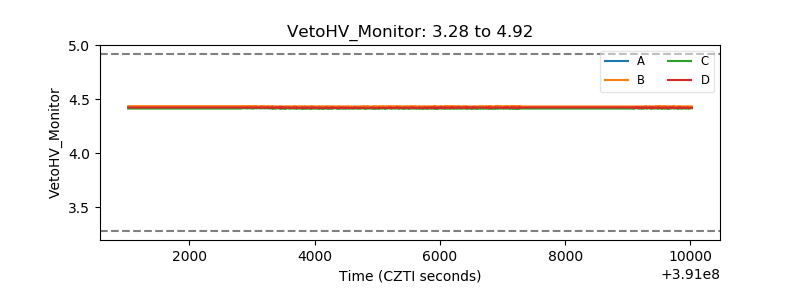 |
| Veto LLD | 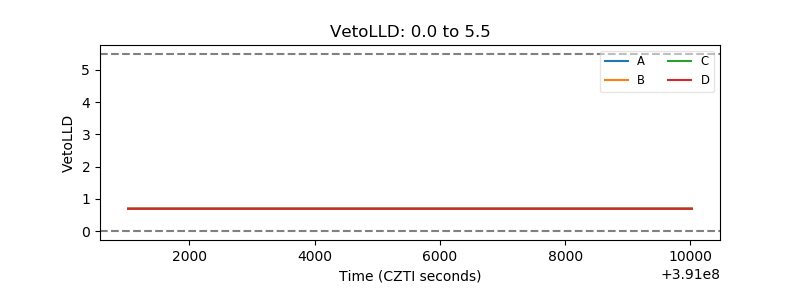 |
| Alpha Counter | 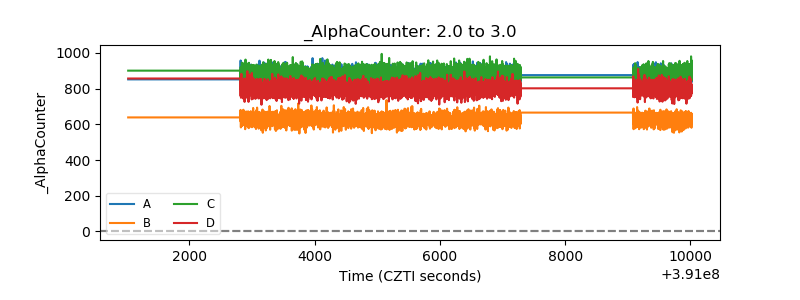 |
| _CPM_Rate | 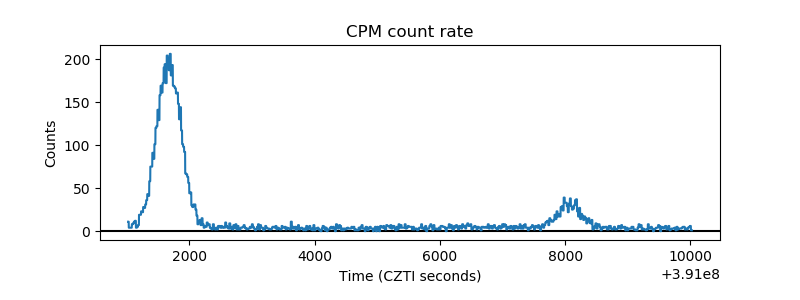 |
| CZT Counter | 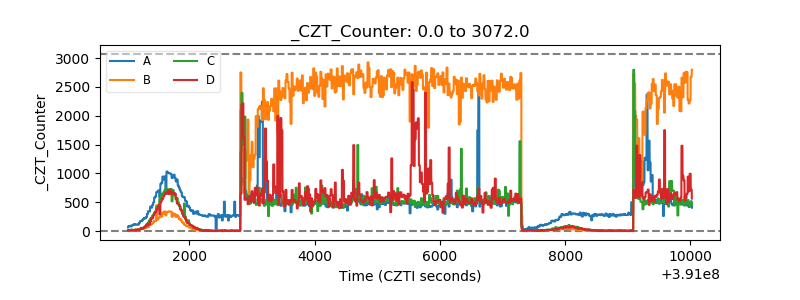 |
| +2.5 Volts monitor | 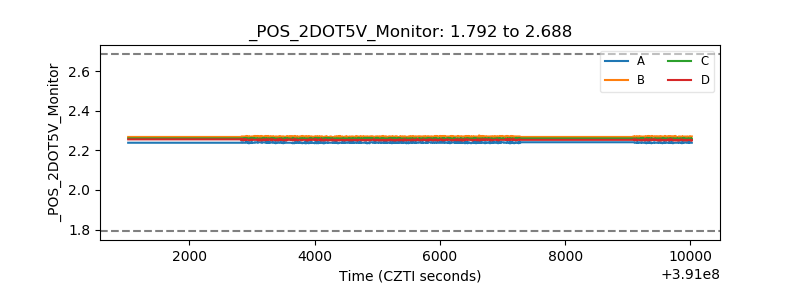 |
| +5 Volts monitor | 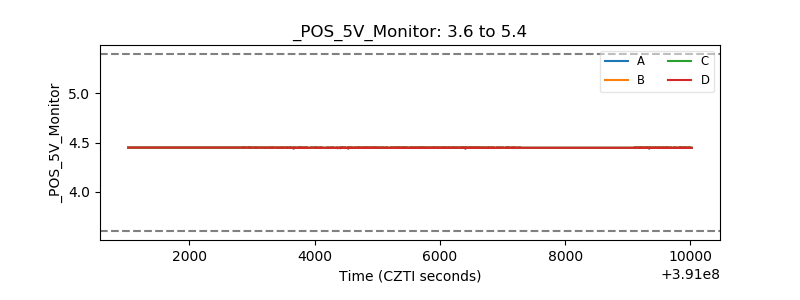 |
| _ROLL_ROT | 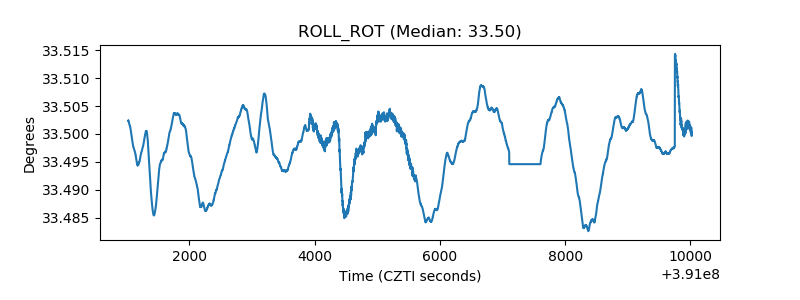 |
| _Roll_DEC | 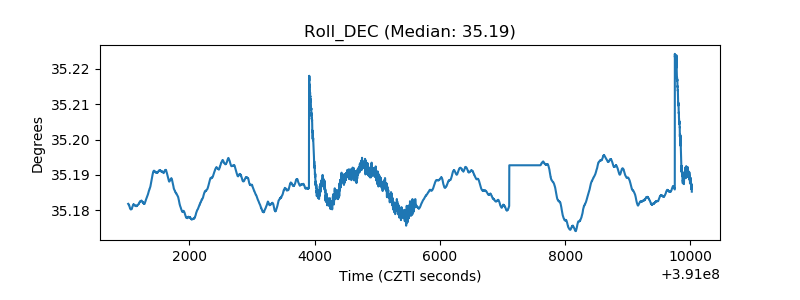 |
| _Roll_RA | 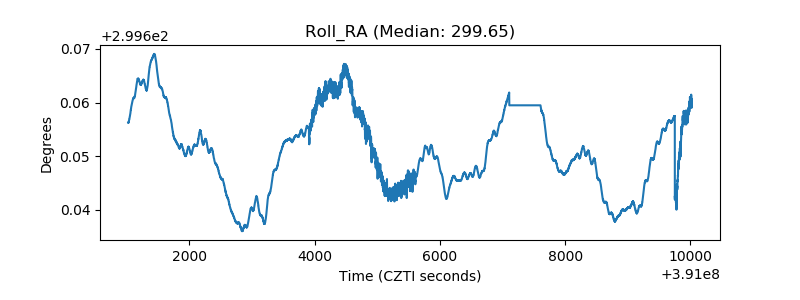 |
| Veto Counter | 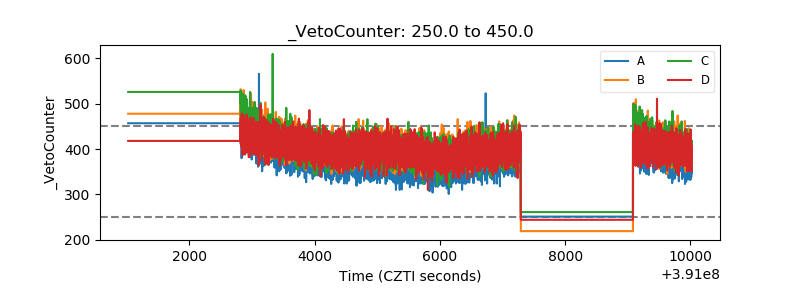 |