| Param | Original file | Final file |
|---|---|---|
| Filename | modeM0/AS1A11_080T01_9000005146_35959cztM0_level2.evt | modeM0/AS1A11_080T01_9000005146_35959cztM0_level2_quad_clean.evt |
| Size (bytes) | 763,116,480 | 48,902,400 |
| Size | 727.8 MB | 46.6 MB |
| Events in quadrant A | 3,224,670 | 334,046 |
| Events in quadrant B | 11,944,519 | 152,788 |
| Events in quadrant C | 3,874,373 | 324,190 |
| Events in quadrant D | 3,721,503 | 309,515 |
| Mode M9 | |||
|---|---|---|---|
| Quadrant | BADHDUFLAG | Total packets | Discarded packets |
| A | 0 | 25 | 0 |
| B | 0 | 25 | 0 |
| C | 0 | 25 | 0 |
| D | 0 | 26 | 0 |
| Mode SS | |||
|---|---|---|---|
| Quadrant | BADHDUFLAG | Total packets | Discarded packets |
| A | 0 | 106 | 0 |
| B | 0 | 106 | 0 |
| C | 0 | 106 | 0 |
| D | 0 | 106 | 0 |
| Mode M0 | |||
|---|---|---|---|
| Quadrant | BADHDUFLAG | Total packets | Discarded packets |
| A | 0 | 12698 | 3 |
| B | 0 | 38949 | 2 |
| C | 0 | 14848 | 2 |
| D | 0 | 14349 | 2 |
| Quadrant | Total seconds | Saturated seconds | Saturation percentage |
|---|---|---|---|
| A | 5114 | 91 | 1.779429% |
| B | 5114 | 4637 | 90.672663% |
| C | 5114 | 129 | 2.522487% |
| D | 5114 | 180 | 3.519750% |
Noise dominated data is calculated using 1-second bins in cleaned event files. If a bin has >2000 counts, and if more than 50% of those come from <1% of pixels, then it is considered to be noise-dominated and hence unusable.
| Quadrant | # 1 sec bins | Bins with >0 counts | Bins with >2000 counts | High rate bins dominated by noise | Noise dominated (total time) | Noise dominated (detector-on time) | Marked lightcurve |
|---|---|---|---|---|---|---|---|
| A | 7177 | 5115 | 54 | 54 | 0.75% | 1.06% | 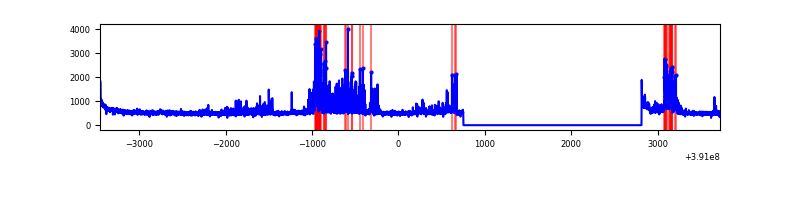 |
| B | 7176 | 5114 | 4243 | 4243 | 59.13% | 82.97% | 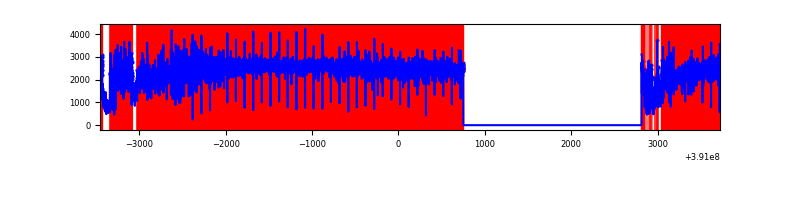 |
| C | 7177 | 5115 | 110 | 110 | 1.53% | 2.15% | 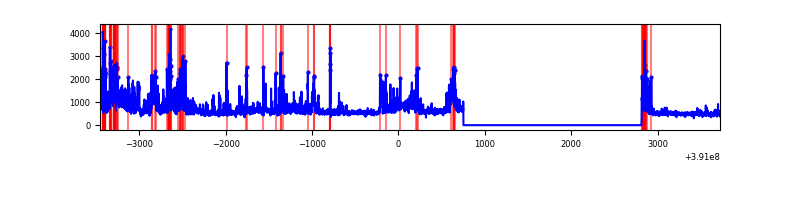 |
| D | 7177 | 5115 | 141 | 141 | 1.96% | 2.76% | 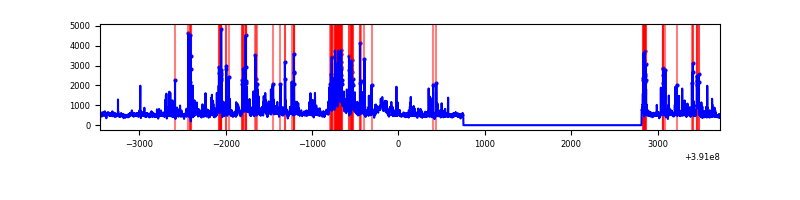 |
Top three noisy pixels from each quadrant. If the there are fewer than three noisy pixels in the level2.evt file, extra rows are filled as -1
| Pixel properties | Quadrant properties | ||||||
|---|---|---|---|---|---|---|---|
| Quadrant | DetID | PixID | Counts | Sigma | Mean | Median | Sigma |
| A | 15 | 169 | 605133 | 4802.25 | 631 | 620 | 125.9 |
| A | 10 | 83 | 166065 | 1314.29 | 631 | 620 | 125.9 |
| A | 13 | 6 | 9298 | 68.93 | 631 | 620 | 125.9 |
| B | 5 | 31 | 3216252 | 48490.37 | 347 | 340 | 66.3 |
| B | 5 | 15 | 3182881 | 47987.19 | 347 | 340 | 66.3 |
| B | 5 | 14 | 2525042 | 38068.12 | 347 | 340 | 66.3 |
| C | 9 | 187 | 1054175 | 7619.4 | 601 | 607 | 138.3 |
| C | 15 | 214 | 215358 | 1553.08 | 601 | 607 | 138.3 |
| C | 0 | 10 | 157448 | 1134.27 | 601 | 607 | 138.3 |
| D | 2 | 249 | 338084 | 2327.78 | 602 | 587 | 145.0 |
| D | 8 | 195 | 274141 | 1886.75 | 602 | 587 | 145.0 |
| D | 7 | 223 | 251852 | 1733.02 | 602 | 587 | 145.0 |
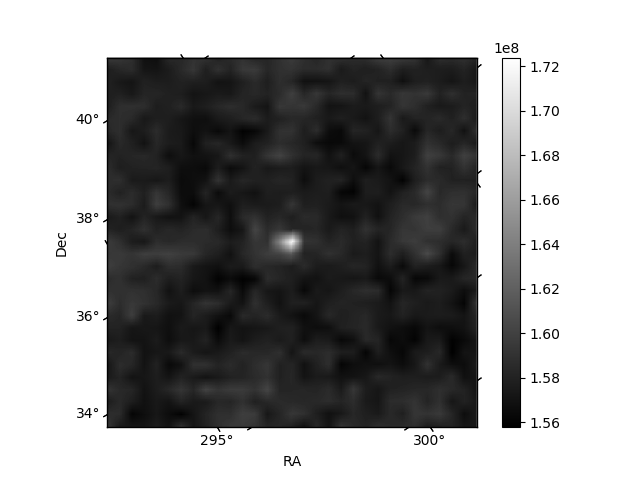
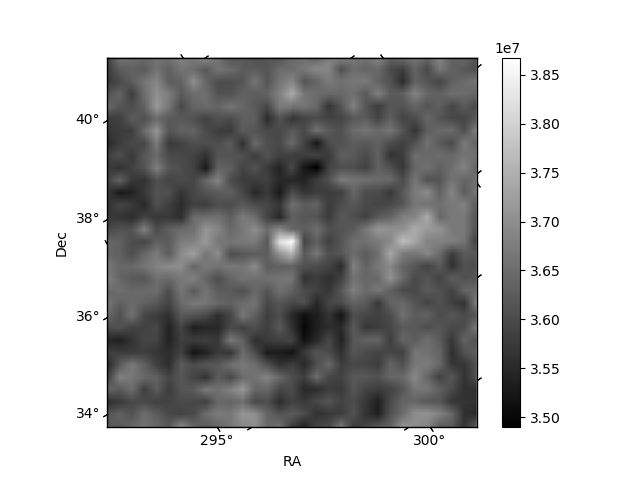
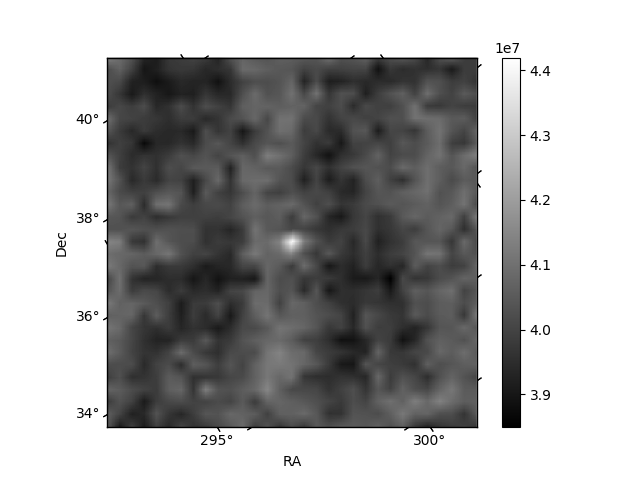
Histogram calculated using DETX and DETY for each event in the final _common_clean file
| Quadrant A | 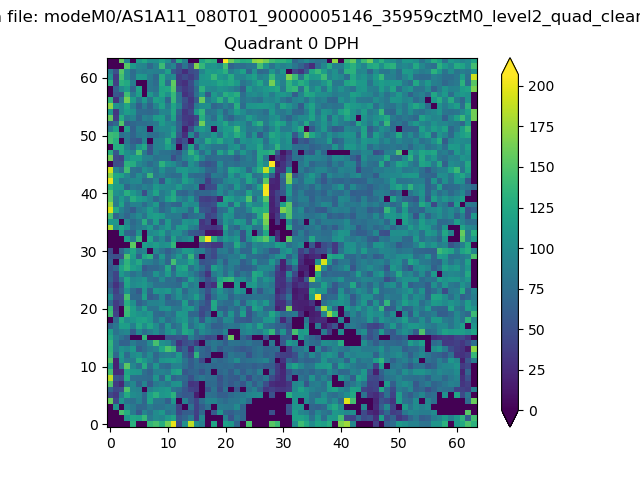 |
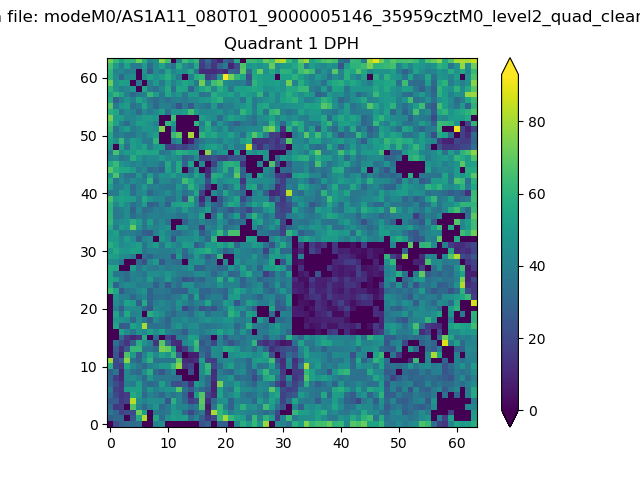 |
Quadrant B |
|---|---|---|---|
| Quadrant D | 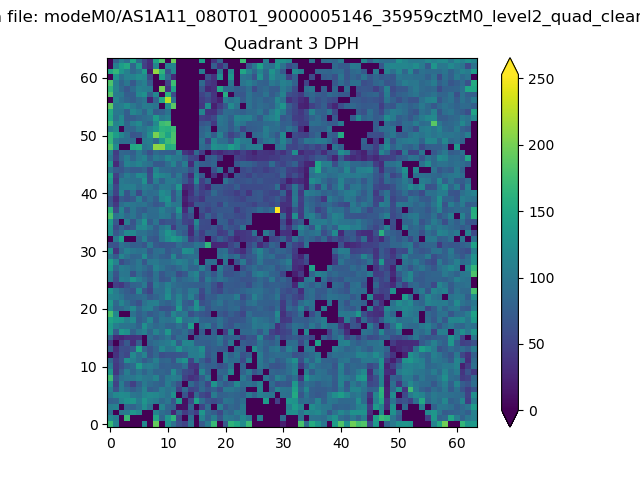 |
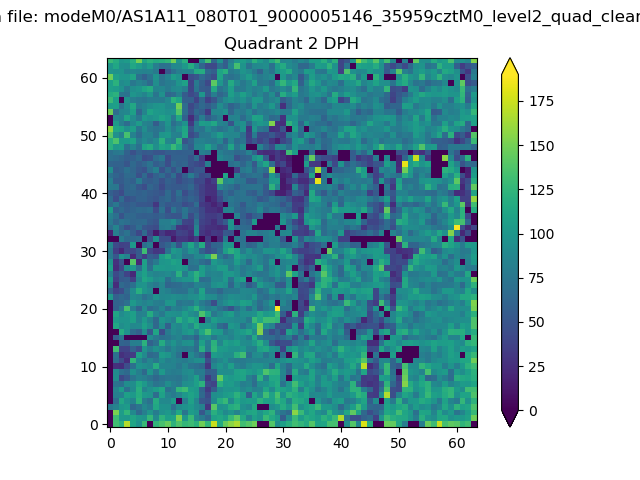 |
Quadrant C |
| Plot type | Count rate plots | Images |
|---|---|---|
| Comparison with Poisson distribution Blue bars denote a histogram of data divided into 1 sec bins. Red curve is a Poisson curve with rate = median count rate of data. |
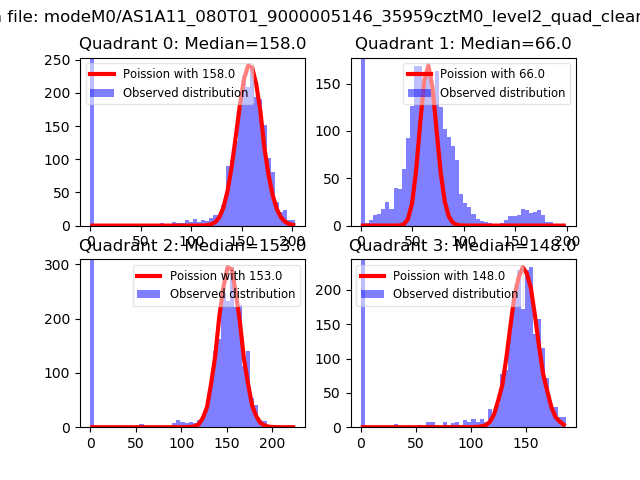 |
 |
| Quadrant-wise count rates Data is divided into 100 sec bins |
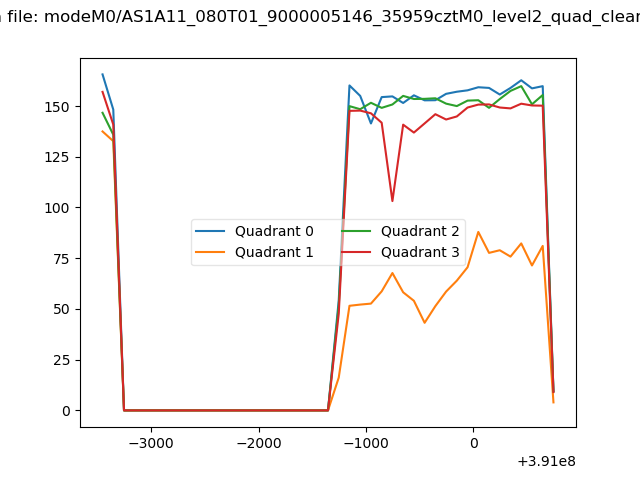 |
|
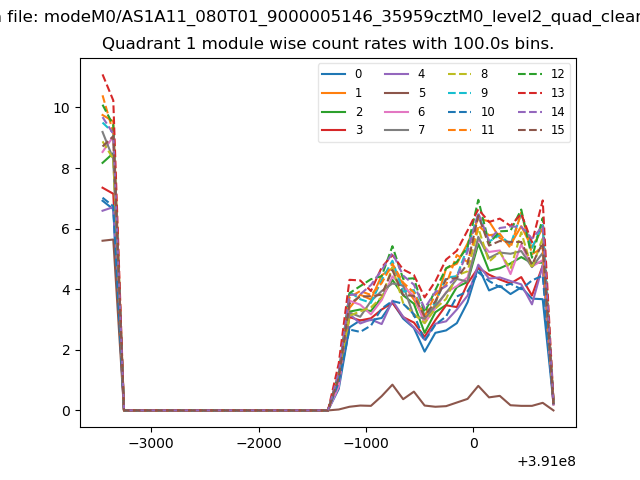
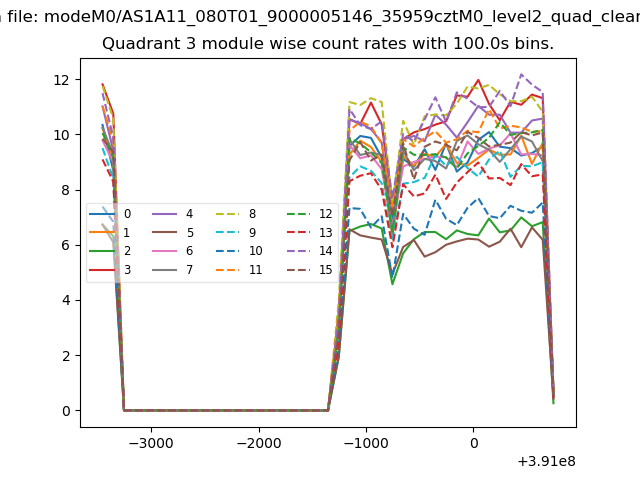
| Module-wise count rates for Quadrant A Data is divided into 100 sec bins |
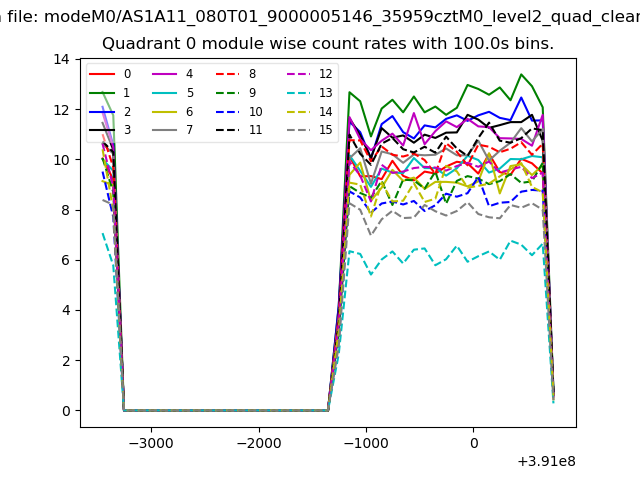 |
 |
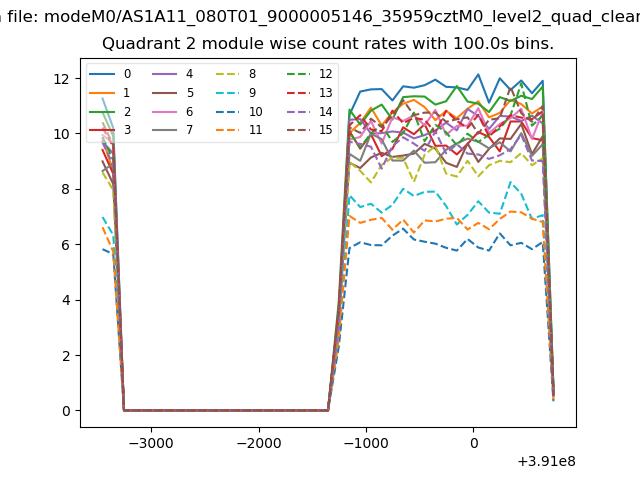
| Module-wise count rates for Quadrant B Data is divided into 100 sec bins |
 |
 |
| Module-wise count rates for Quadrant C Data is divided into 100 sec bins |
 |
 |
| Module-wise count rates for Quadrant D Data is divided into 100 sec bins |
 |
 |
| Parameter | Plot |
|---|---|
| CZT HV Monitor | 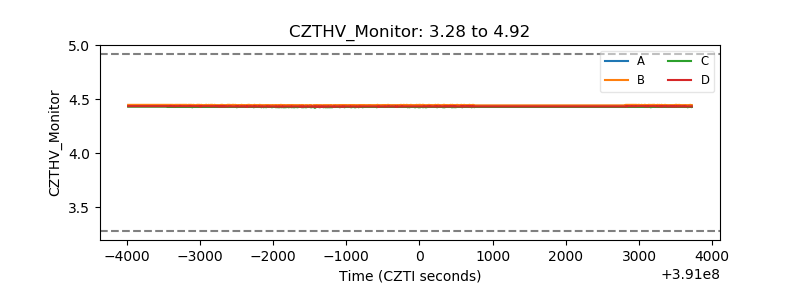 |
| D_VDD | 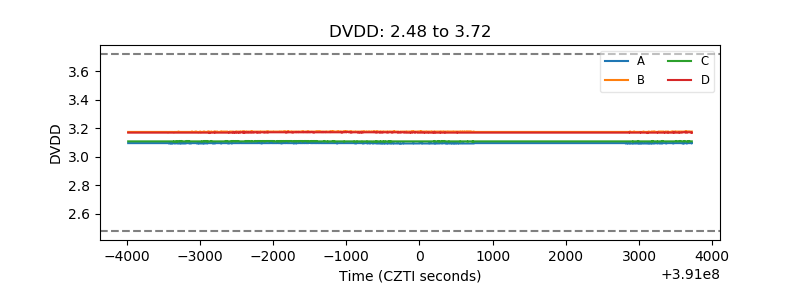 |
| Temperature 1 | 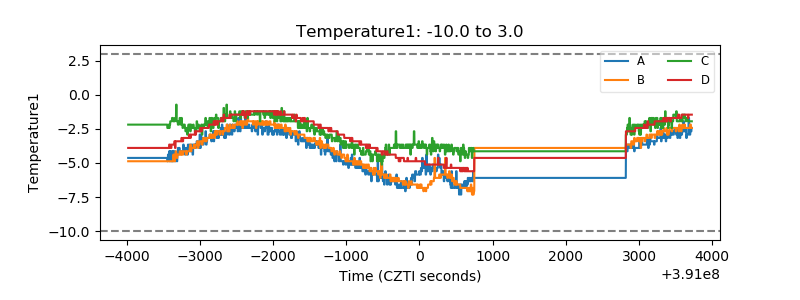 |
| Veto HV Monitor | 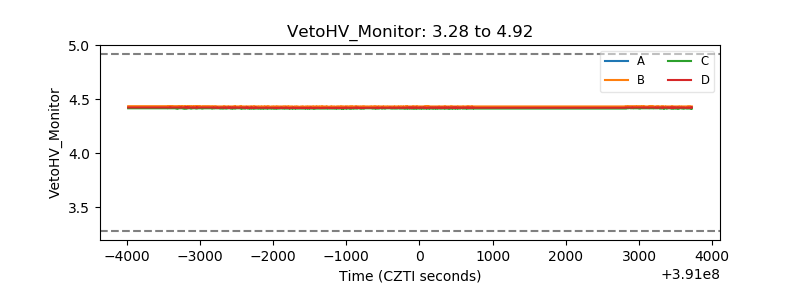 |
| Veto LLD | 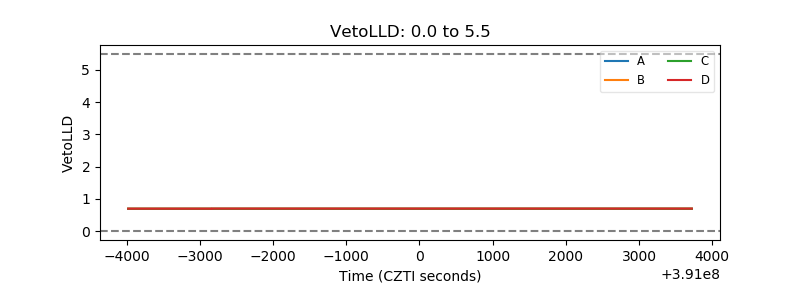 |
| Alpha Counter | 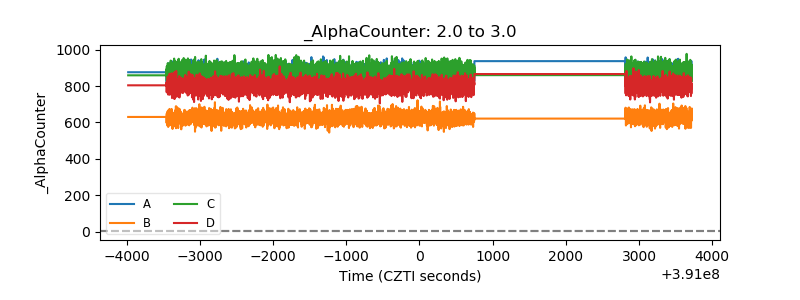 |
| _CPM_Rate | 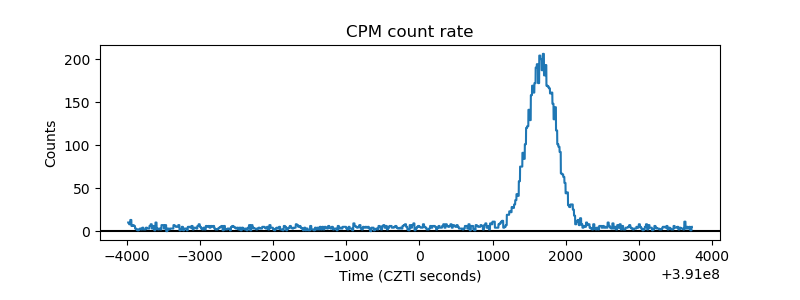 |
| CZT Counter | 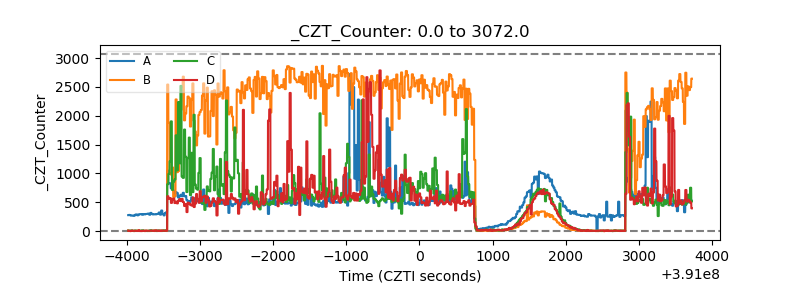 |
| +2.5 Volts monitor | 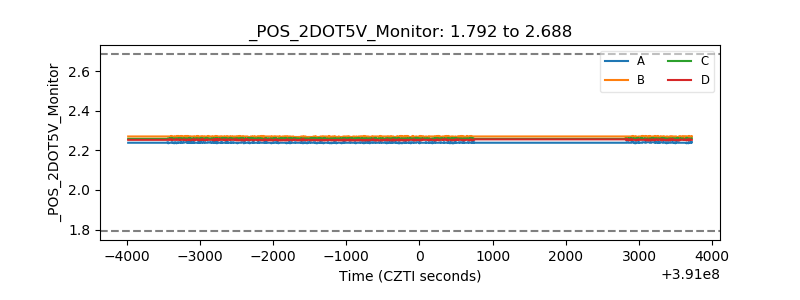 |
| +5 Volts monitor | 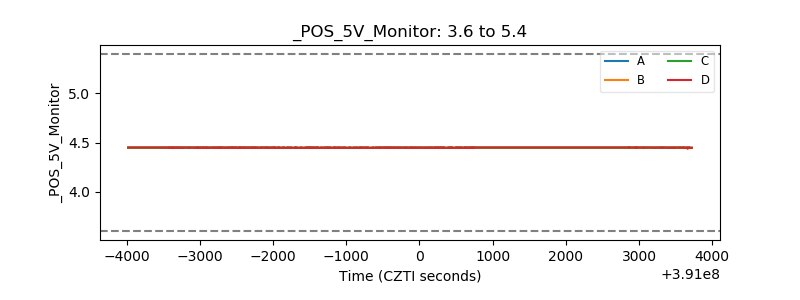 |
| _ROLL_ROT | 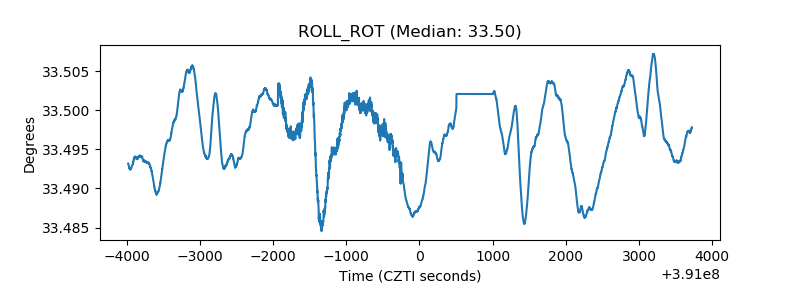 |
| _Roll_DEC | 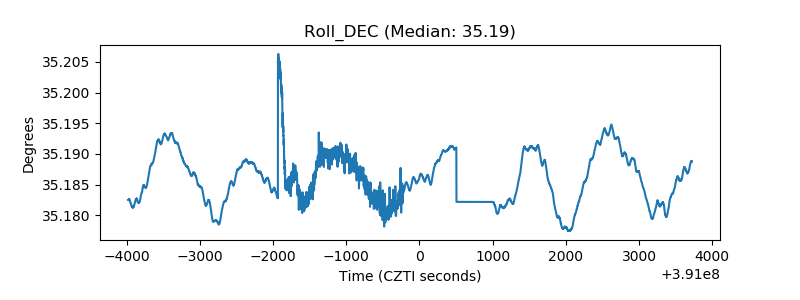 |
| _Roll_RA | 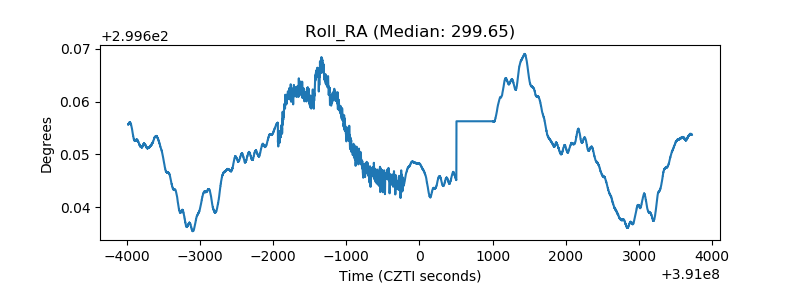 |
| Veto Counter | 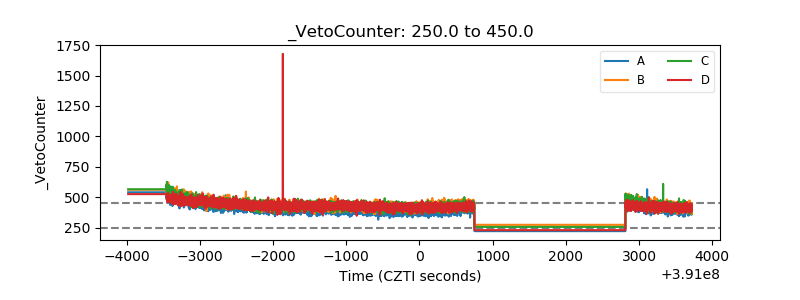 |