| Param | Original file | Final file |
|---|---|---|
| Filename | modeM0/AS1A11_080T01_9000005146_35957cztM0_level2.evt | modeM0/AS1A11_080T01_9000005146_35957cztM0_level2_quad_clean.evt |
| Size (bytes) | 828,653,760 | 59,495,040 |
| Size | 790.3 MB | 56.7 MB |
| Events in quadrant A | 4,017,501 | 409,375 |
| Events in quadrant B | 11,808,894 | 264,210 |
| Events in quadrant C | 5,654,665 | 365,344 |
| Events in quadrant D | 3,271,716 | 404,362 |
| Mode M9 | |||
|---|---|---|---|
| Quadrant | BADHDUFLAG | Total packets | Discarded packets |
| A | 0 | 21 | 0 |
| B | 0 | 21 | 0 |
| C | 0 | 21 | 0 |
| D | 0 | 21 | 0 |
| Mode SS | |||
|---|---|---|---|
| Quadrant | BADHDUFLAG | Total packets | Discarded packets |
| A | 0 | 104 | 0 |
| B | 0 | 104 | 0 |
| C | 0 | 104 | 0 |
| D | 0 | 104 | 0 |
| Mode M0 | |||
|---|---|---|---|
| Quadrant | BADHDUFLAG | Total packets | Discarded packets |
| A | 0 | 15073 | 2 |
| B | 0 | 38459 | 1 |
| C | 0 | 20218 | 1 |
| D | 0 | 12934 | 1 |
| Quadrant | Total seconds | Saturated seconds | Saturation percentage |
|---|---|---|---|
| A | 5086 | 398 | 7.825403% |
| B | 5086 | 4697 | 92.351553% |
| C | 5086 | 907 | 17.833268% |
| D | 5086 | 65 | 1.278018% |
Noise dominated data is calculated using 1-second bins in cleaned event files. If a bin has >2000 counts, and if more than 50% of those come from <1% of pixels, then it is considered to be noise-dominated and hence unusable.
| Quadrant | # 1 sec bins | Bins with >0 counts | Bins with >2000 counts | High rate bins dominated by noise | Noise dominated (total time) | Noise dominated (detector-on time) | Marked lightcurve |
|---|---|---|---|---|---|---|---|
| A | 7209 | 5087 | 351 | 351 | 4.87% | 6.90% | 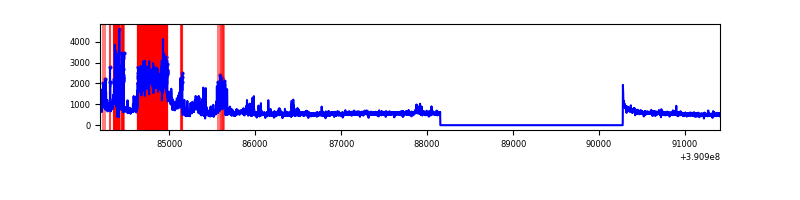 |
| B | 7209 | 5087 | 4353 | 4353 | 60.38% | 85.57% | 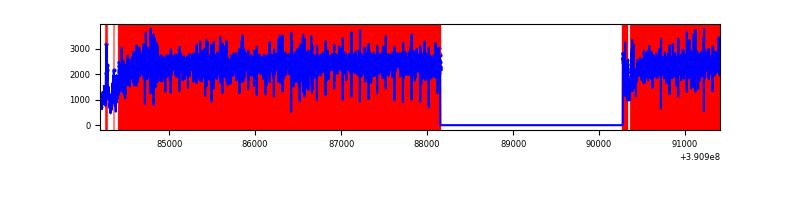 |
| C | 7209 | 5087 | 773 | 773 | 10.72% | 15.20% | 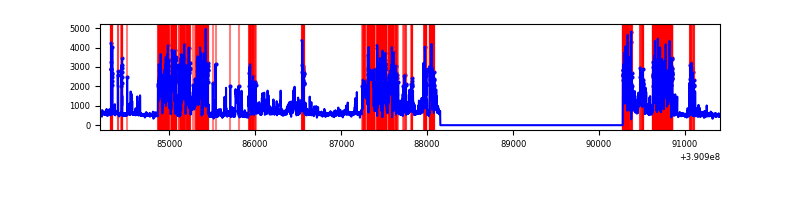 |
| D | 7209 | 5087 | 56 | 56 | 0.78% | 1.10% | 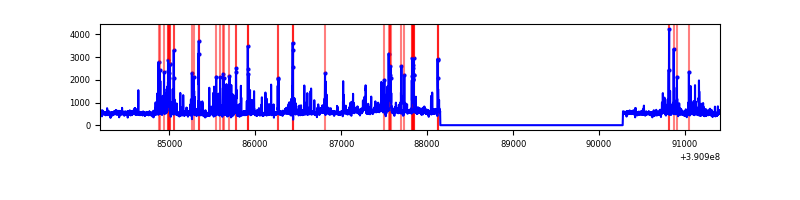 |
Top three noisy pixels from each quadrant. If the there are fewer than three noisy pixels in the level2.evt file, extra rows are filled as -1
| Pixel properties | Quadrant properties | ||||||
|---|---|---|---|---|---|---|---|
| Quadrant | DetID | PixID | Counts | Sigma | Mean | Median | Sigma |
| A | 15 | 169 | 1361682 | 10435.06 | 651 | 641 | 130.4 |
| A | 10 | 83 | 125257 | 955.43 | 651 | 641 | 130.4 |
| A | 13 | 6 | 7670 | 53.89 | 651 | 641 | 130.4 |
| B | 5 | 14 | 3102078 | 40218.23 | 403 | 395 | 77.1 |
| B | 5 | 31 | 3085252 | 40000.05 | 403 | 395 | 77.1 |
| B | 5 | 15 | 3075962 | 39879.59 | 403 | 395 | 77.1 |
| C | 9 | 187 | 2812664 | 21162.23 | 580 | 586 | 132.9 |
| C | 0 | 207 | 202305 | 1518.03 | 580 | 586 | 132.9 |
| C | 15 | 214 | 199354 | 1495.82 | 580 | 586 | 132.9 |
| D | 2 | 250 | 227681 | 1473.67 | 636 | 621 | 154.1 |
| D | 8 | 195 | 176428 | 1141.03 | 636 | 621 | 154.1 |
| D | 7 | 223 | 143510 | 927.38 | 636 | 621 | 154.1 |
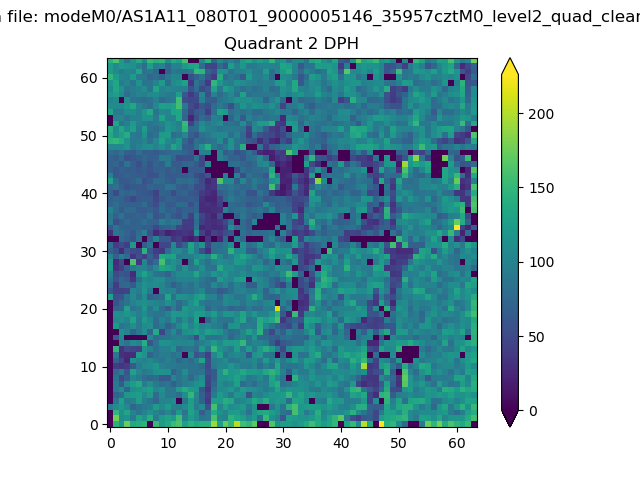
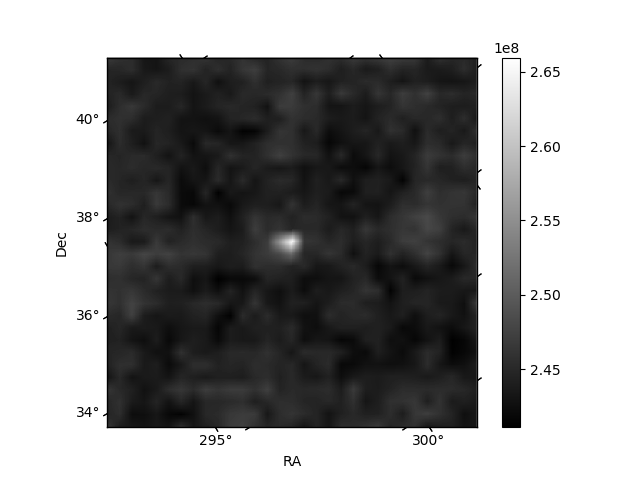
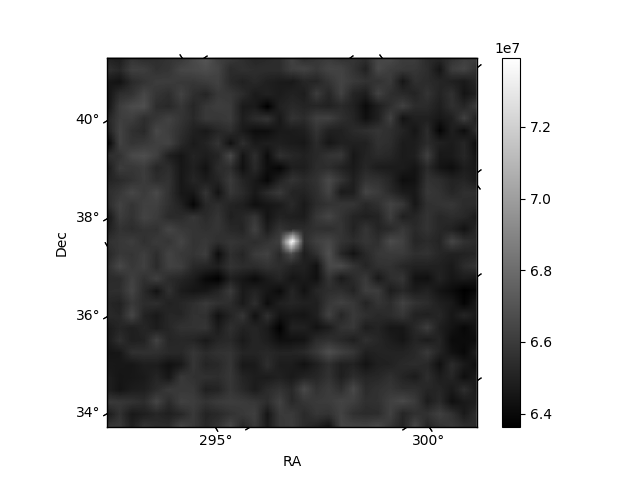
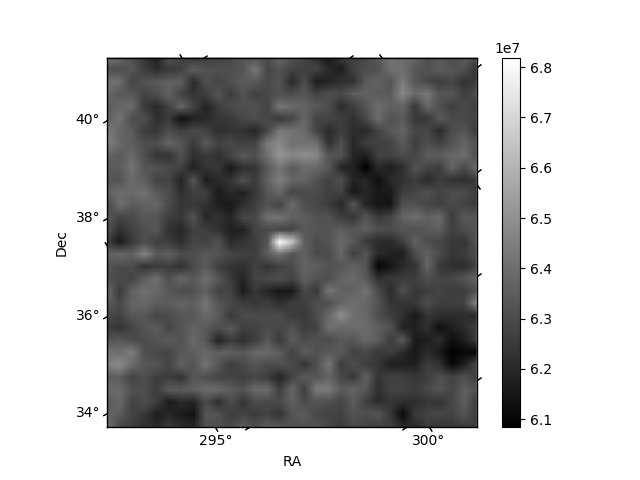
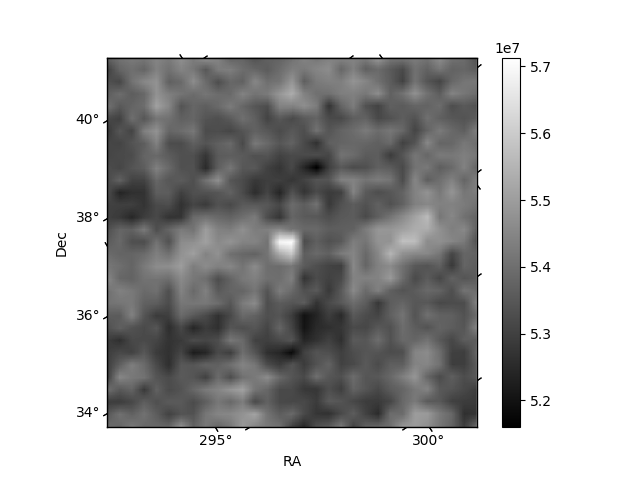
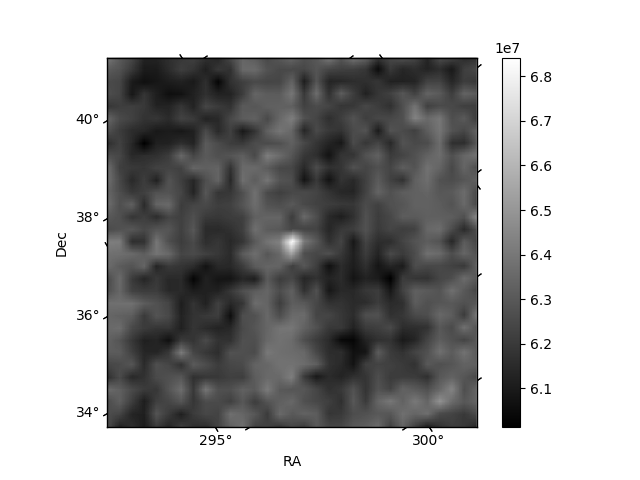
Histogram calculated using DETX and DETY for each event in the final _common_clean file
| Quadrant A | 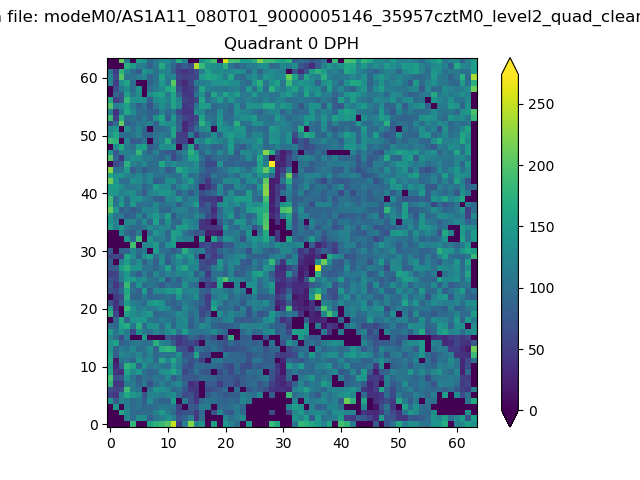 |
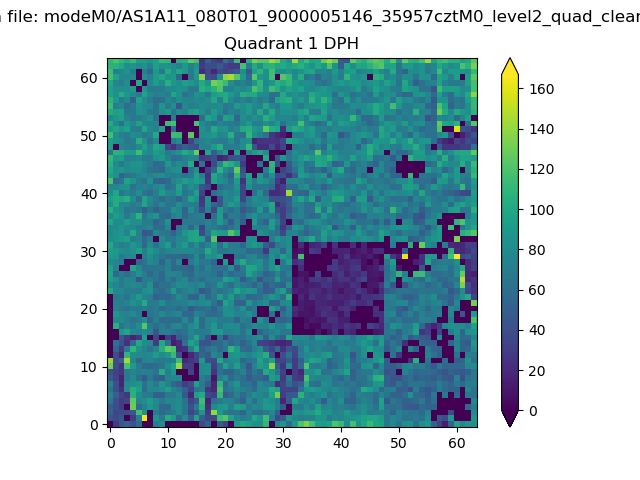 |
Quadrant B |
|---|---|---|---|
| Quadrant D | 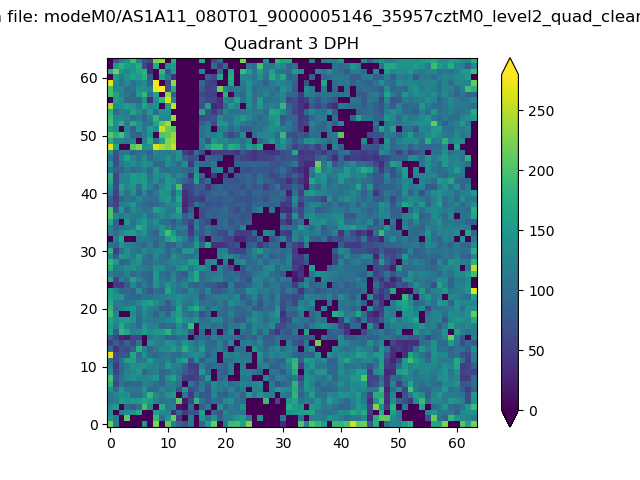 |
 |
Quadrant C |
| Plot type | Count rate plots | Images |
|---|---|---|
| Comparison with Poisson distribution Blue bars denote a histogram of data divided into 1 sec bins. Red curve is a Poisson curve with rate = median count rate of data. |
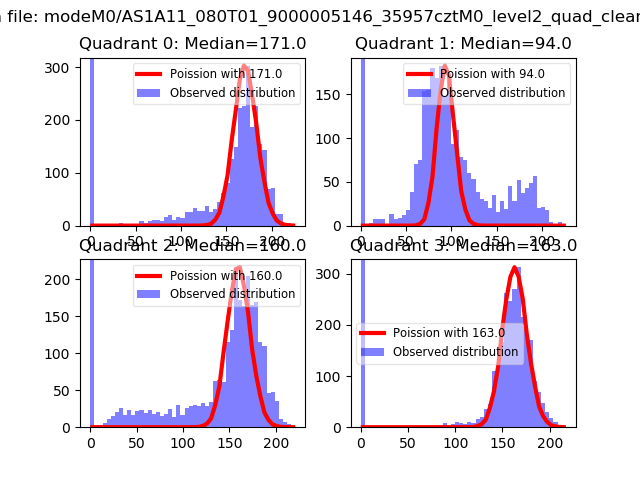 |
 |
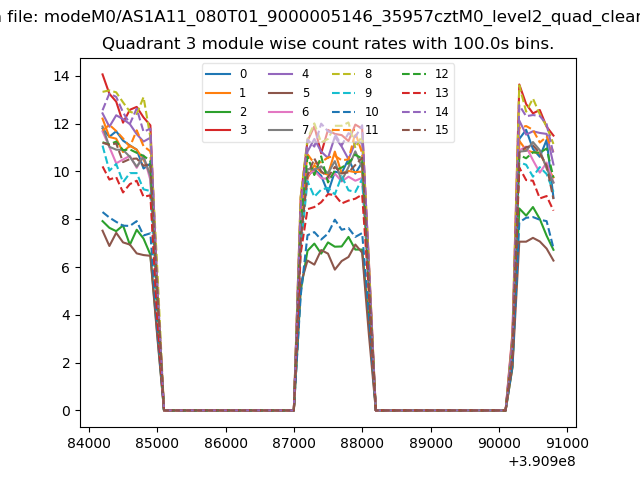
| Quadrant-wise count rates Data is divided into 100 sec bins |
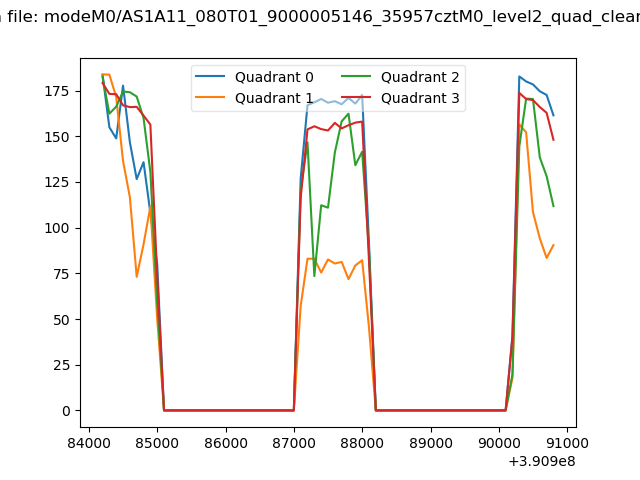 |
|
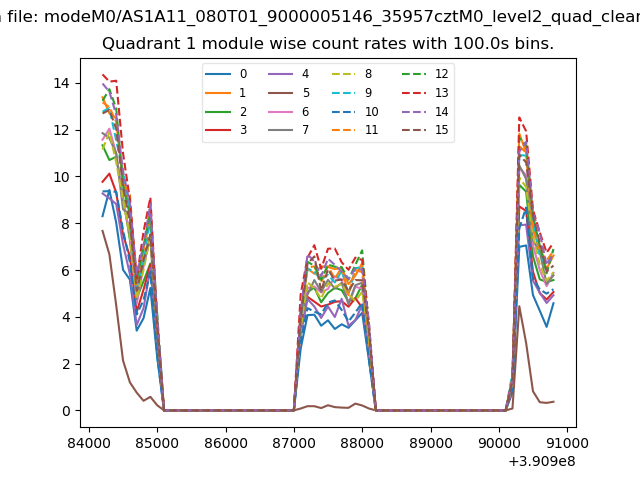
| Module-wise count rates for Quadrant A Data is divided into 100 sec bins |
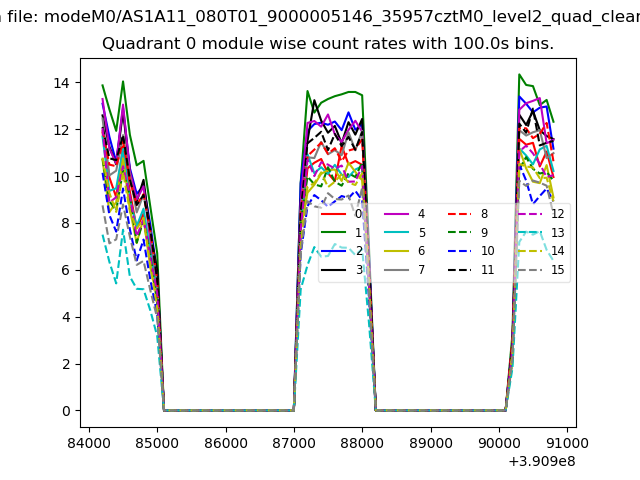 |
 |
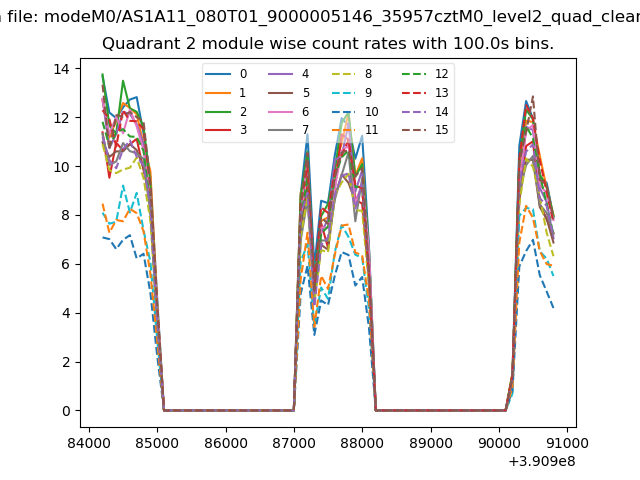
| Module-wise count rates for Quadrant B Data is divided into 100 sec bins |
 |
 |
| Module-wise count rates for Quadrant C Data is divided into 100 sec bins |
 |
 |
| Module-wise count rates for Quadrant D Data is divided into 100 sec bins |
 |
 |
| Parameter | Plot |
|---|---|
| CZT HV Monitor | 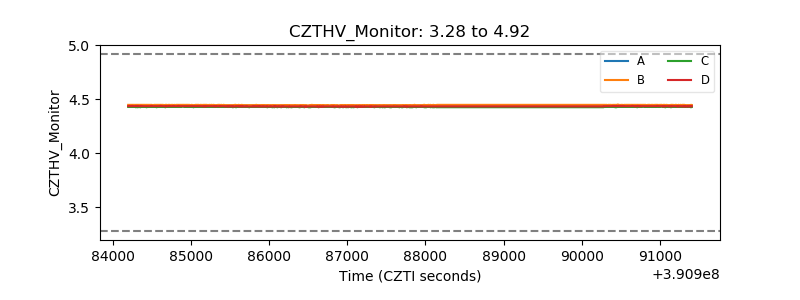 |
| D_VDD | 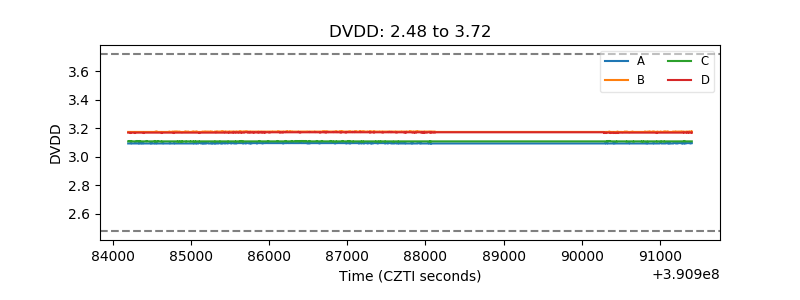 |
| Temperature 1 | 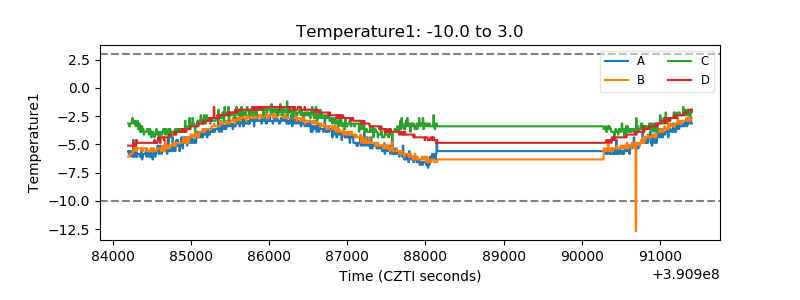 |
| Veto HV Monitor | 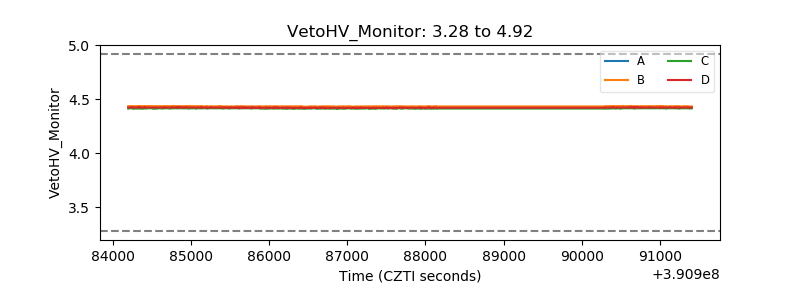 |
| Veto LLD | 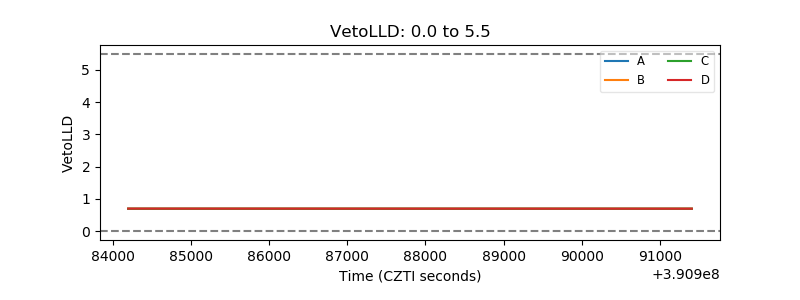 |
| Alpha Counter | 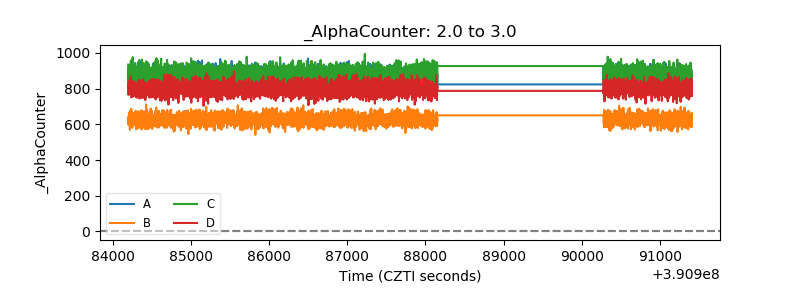 |
| _CPM_Rate | 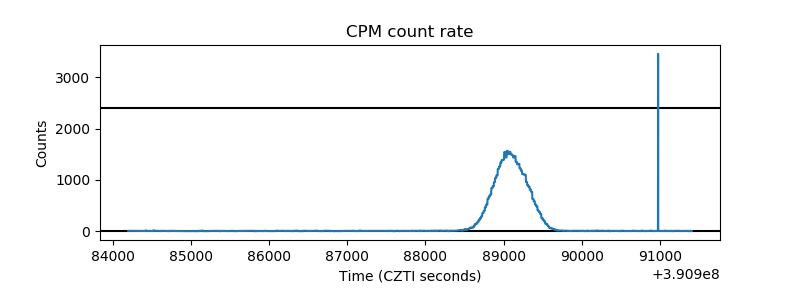 |
| CZT Counter | 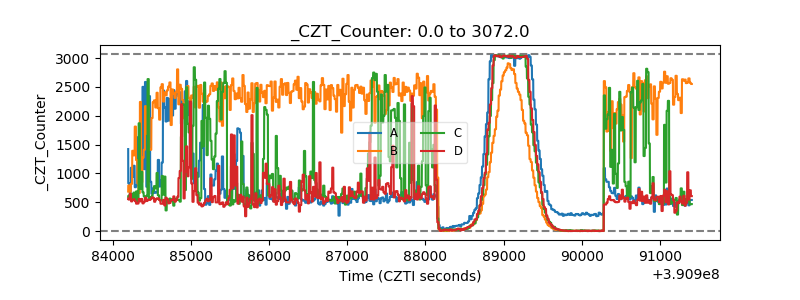 |
| +2.5 Volts monitor | 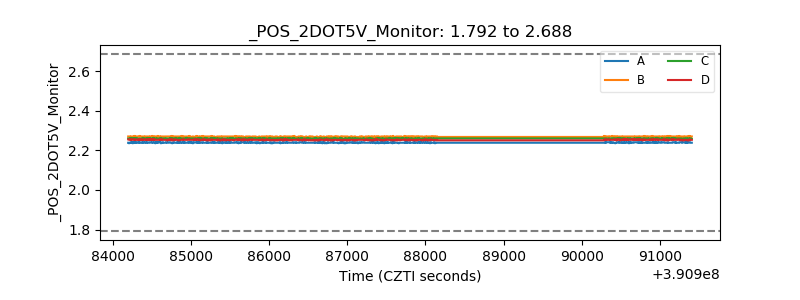 |
| +5 Volts monitor | 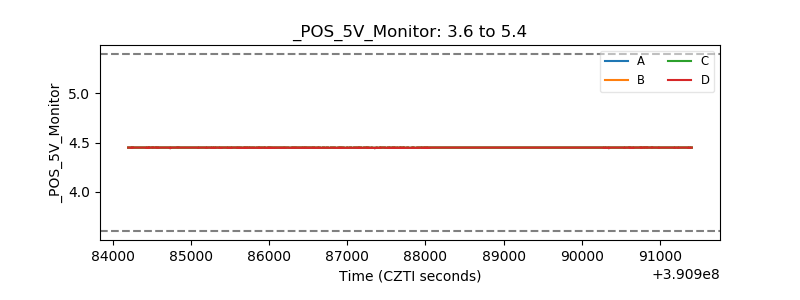 |
| _ROLL_ROT | 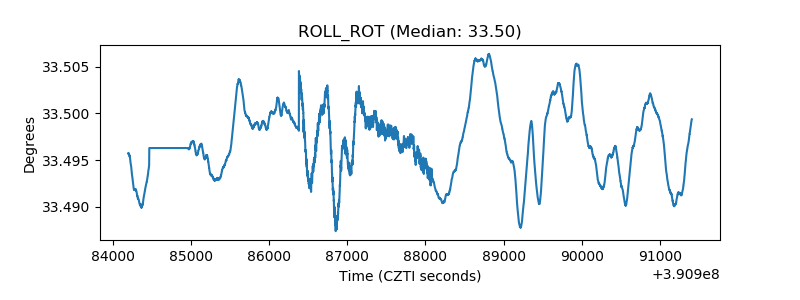 |
| _Roll_DEC | 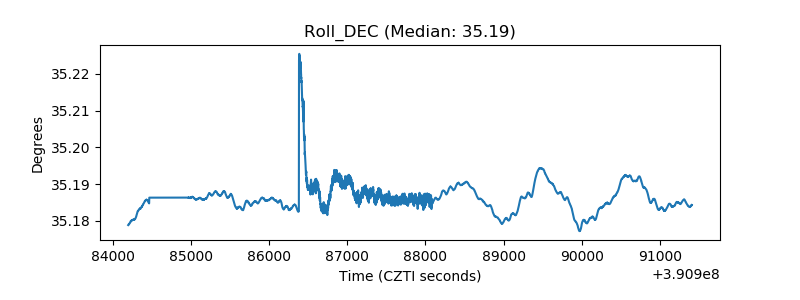 |
| _Roll_RA | 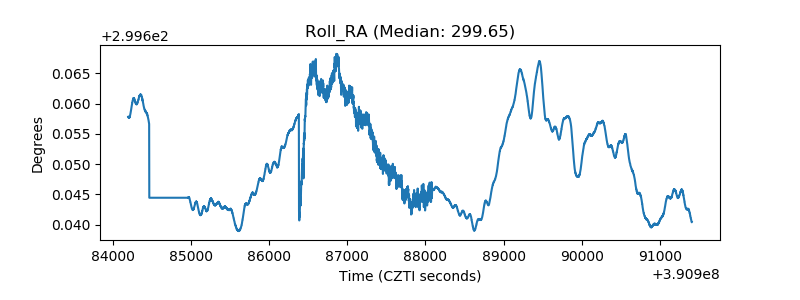 |
| Veto Counter | 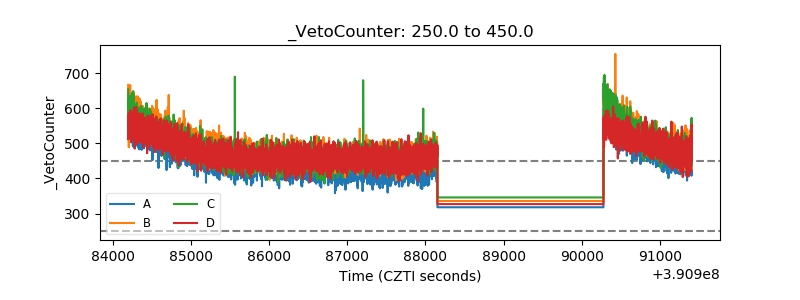 |