| Param | Original file | Final file |
|---|---|---|
| Filename | modeM0/AS1A11_080T01_9000005146_35956cztM0_level2.evt | modeM0/AS1A11_080T01_9000005146_35956cztM0_level2_quad_clean.evt |
| Size (bytes) | 782,409,600 | 73,768,320 |
| Size | 746.2 MB | 70.4 MB |
| Events in quadrant A | 3,949,859 | 523,877 |
| Events in quadrant B | 12,038,294 | 339,287 |
| Events in quadrant C | 4,231,071 | 489,899 |
| Events in quadrant D | 3,121,126 | 511,317 |
| Mode M9 | |||
|---|---|---|---|
| Quadrant | BADHDUFLAG | Total packets | Discarded packets |
| A | 0 | 20 | 0 |
| B | 0 | 20 | 0 |
| C | 0 | 20 | 0 |
| D | 0 | 20 | 0 |
| Mode SS | |||
|---|---|---|---|
| Quadrant | BADHDUFLAG | Total packets | Discarded packets |
| A | 0 | 108 | 0 |
| B | 0 | 108 | 0 |
| C | 0 | 108 | 0 |
| D | 0 | 108 | 0 |
| Mode M0 | |||
|---|---|---|---|
| Quadrant | BADHDUFLAG | Total packets | Discarded packets |
| A | 0 | 15015 | 3 |
| B | 0 | 39207 | 2 |
| C | 0 | 15768 | 10 |
| D | 0 | 12467 | 2 |
| Quadrant | Total seconds | Saturated seconds | Saturation percentage |
|---|---|---|---|
| A | 5248 | 406 | 7.736280% |
| B | 5248 | 4693 | 89.424543% |
| C | 5247 | 566 | 10.787116% |
| D | 5248 | 54 | 1.028963% |
Noise dominated data is calculated using 1-second bins in cleaned event files. If a bin has >2000 counts, and if more than 50% of those come from <1% of pixels, then it is considered to be noise-dominated and hence unusable.
| Quadrant | # 1 sec bins | Bins with >0 counts | Bins with >2000 counts | High rate bins dominated by noise | Noise dominated (total time) | Noise dominated (detector-on time) | Marked lightcurve |
|---|---|---|---|---|---|---|---|
| A | 7282 | 5249 | 358 | 358 | 4.92% | 6.82% | 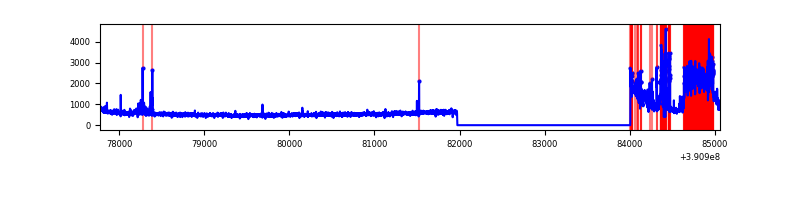 |
| B | 7282 | 5249 | 4404 | 4404 | 60.48% | 83.90% | 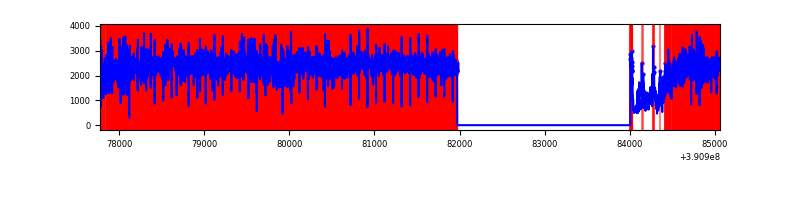 |
| C | 7282 | 5249 | 462 | 462 | 6.34% | 8.80% | 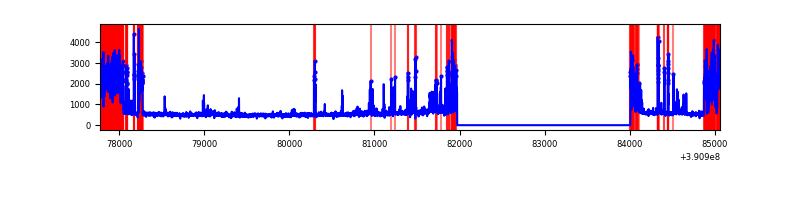 |
| D | 7282 | 5249 | 43 | 43 | 0.59% | 0.82% | 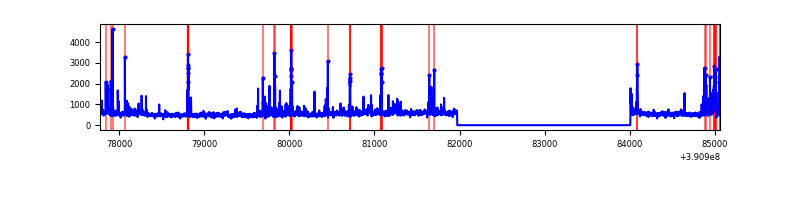 |
Top three noisy pixels from each quadrant. If the there are fewer than three noisy pixels in the level2.evt file, extra rows are filled as -1
| Pixel properties | Quadrant properties | ||||||
|---|---|---|---|---|---|---|---|
| Quadrant | DetID | PixID | Counts | Sigma | Mean | Median | Sigma |
| A | 15 | 169 | 1208714 | 8943.51 | 668 | 659 | 135.1 |
| A | 10 | 83 | 147124 | 1084.31 | 668 | 659 | 135.1 |
| A | 8 | 144 | 9994 | 69.11 | 668 | 659 | 135.1 |
| B | 5 | 14 | 2902360 | 37954.96 | 400 | 391 | 76.5 |
| B | 5 | 31 | 2876719 | 37619.6 | 400 | 391 | 76.5 |
| B | 5 | 15 | 2866500 | 37485.95 | 400 | 391 | 76.5 |
| C | 9 | 187 | 1379975 | 9666.8 | 617 | 623 | 142.7 |
| C | 15 | 214 | 211813 | 1480.07 | 617 | 623 | 142.7 |
| C | 0 | 10 | 93462 | 650.64 | 617 | 623 | 142.7 |
| D | 8 | 195 | 174071 | 1091.83 | 649 | 633 | 158.9 |
| D | 2 | 250 | 156930 | 983.93 | 649 | 633 | 158.9 |
| D | 7 | 223 | 87646 | 547.77 | 649 | 633 | 158.9 |
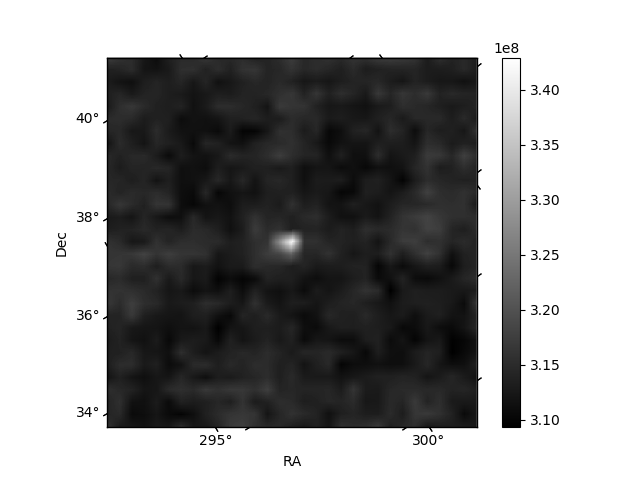
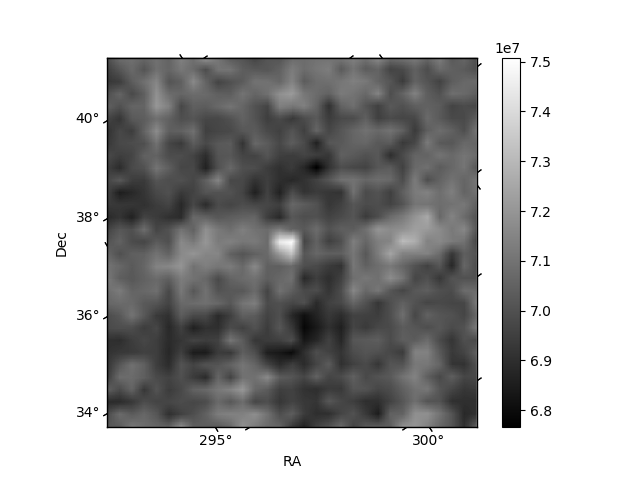
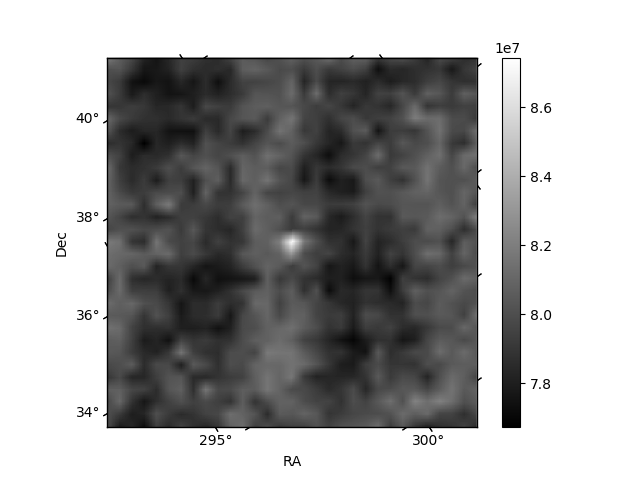
Histogram calculated using DETX and DETY for each event in the final _common_clean file
| Quadrant A | 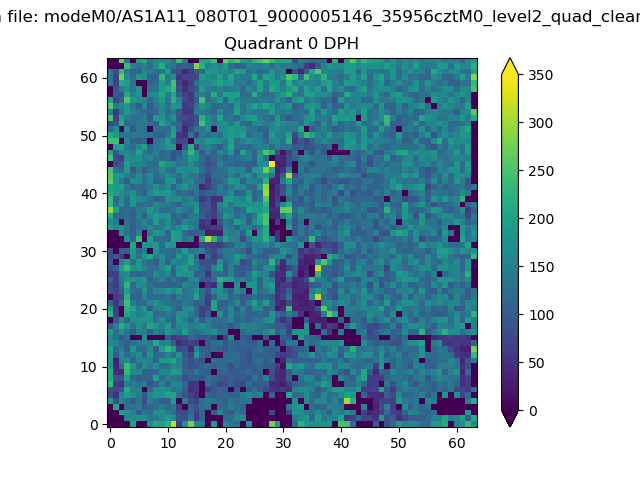 |
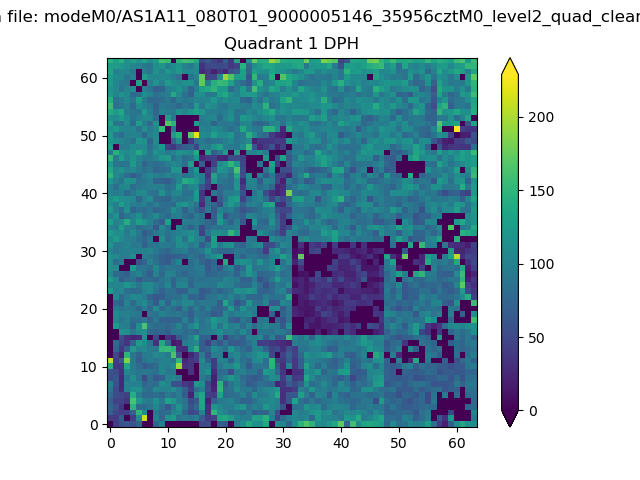 |
Quadrant B |
|---|---|---|---|
| Quadrant D | 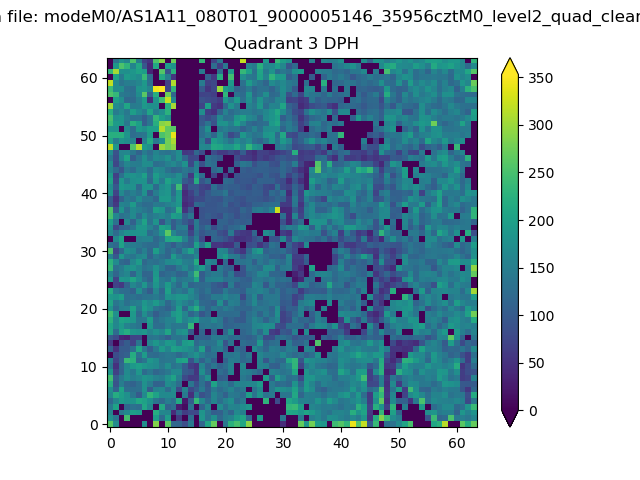 |
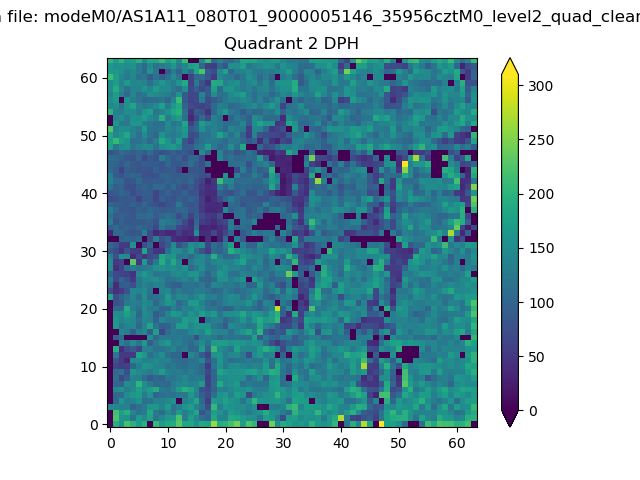 |
Quadrant C |
| Plot type | Count rate plots | Images |
|---|---|---|
| Comparison with Poisson distribution Blue bars denote a histogram of data divided into 1 sec bins. Red curve is a Poisson curve with rate = median count rate of data. |
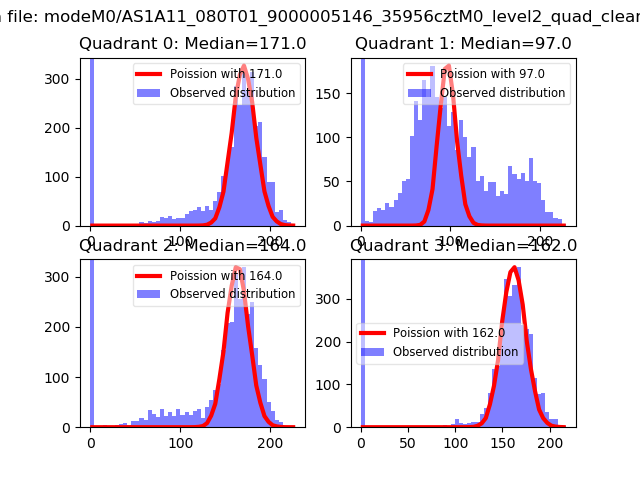 |
 |
| Quadrant-wise count rates Data is divided into 100 sec bins |
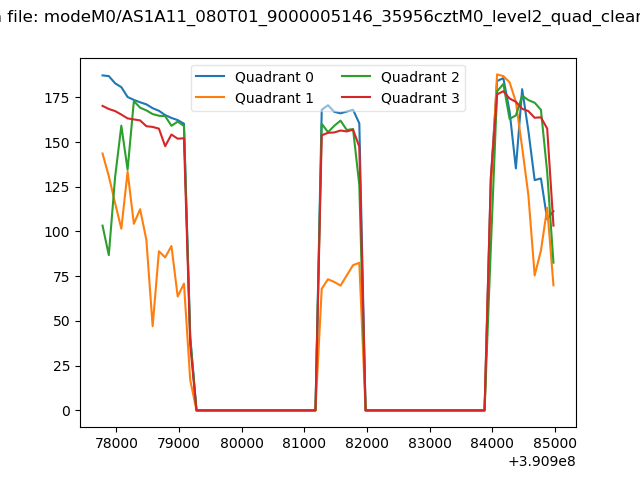 |
|
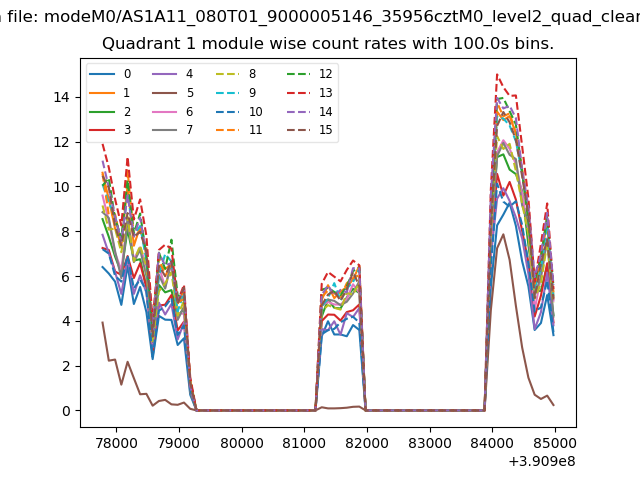
| Module-wise count rates for Quadrant A Data is divided into 100 sec bins |
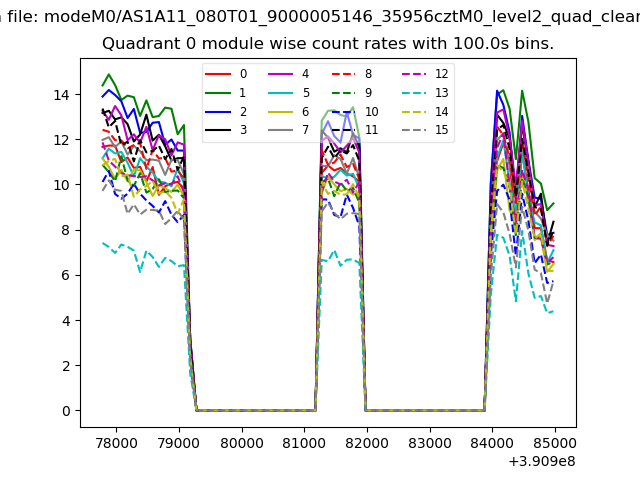 |
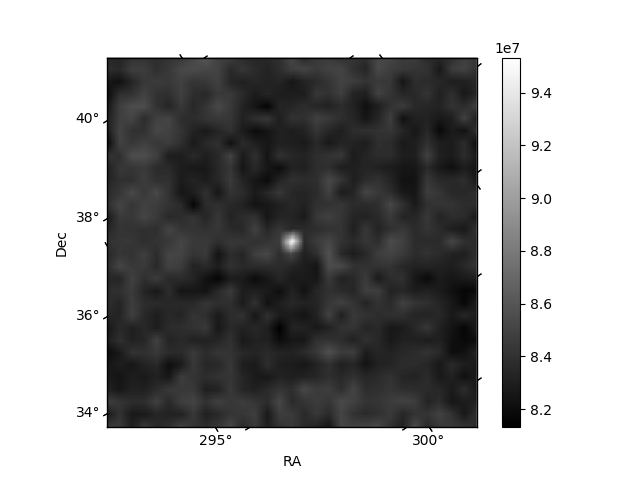 |
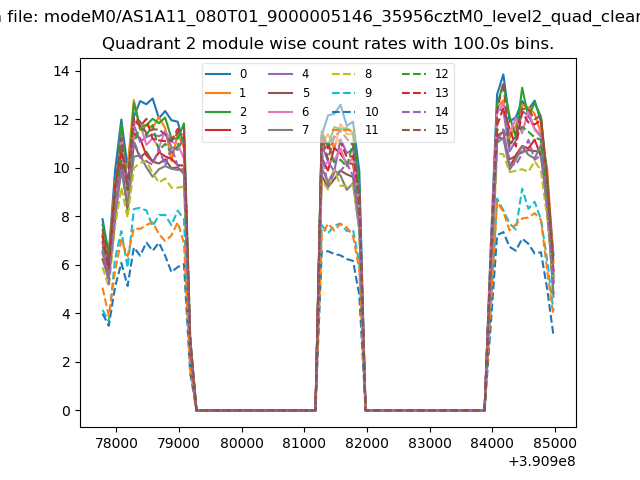
| Module-wise count rates for Quadrant B Data is divided into 100 sec bins |
 |
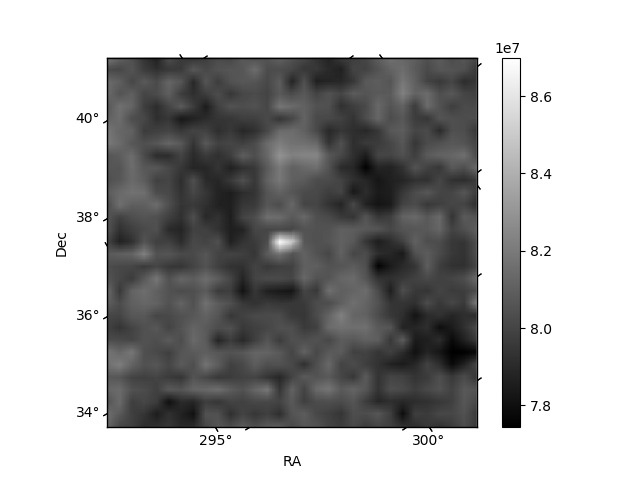 |
| Module-wise count rates for Quadrant C Data is divided into 100 sec bins |
 |
 |
| Module-wise count rates for Quadrant D Data is divided into 100 sec bins |
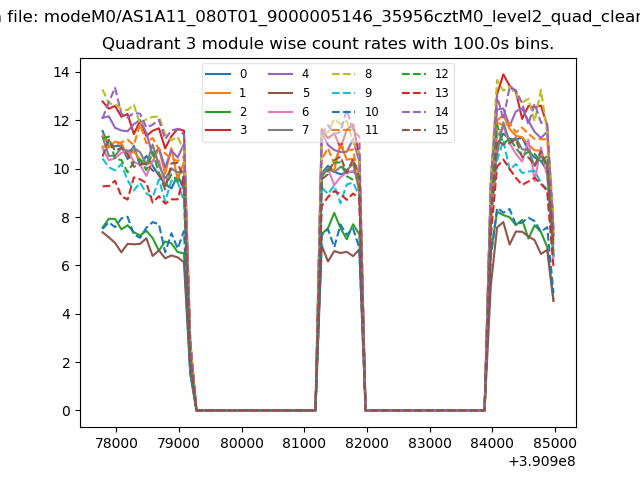 |
 |
| Parameter | Plot |
|---|---|
| CZT HV Monitor | 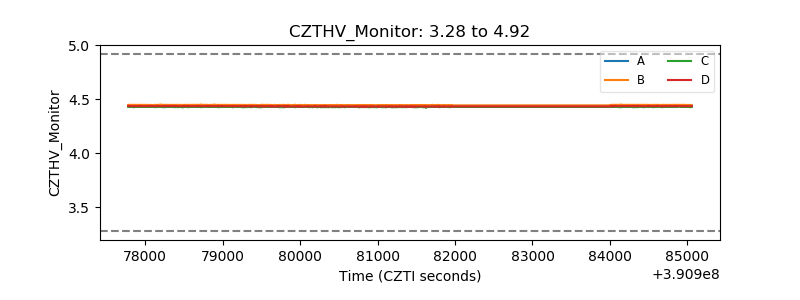 |
| D_VDD | 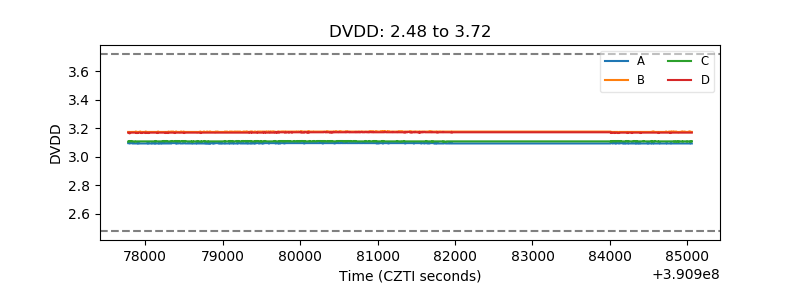 |
| Temperature 1 | 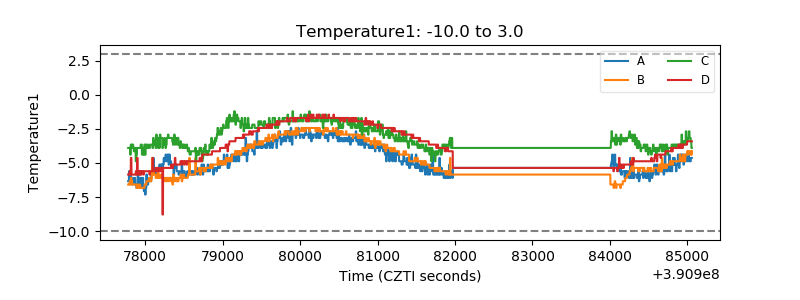 |
| Veto HV Monitor | 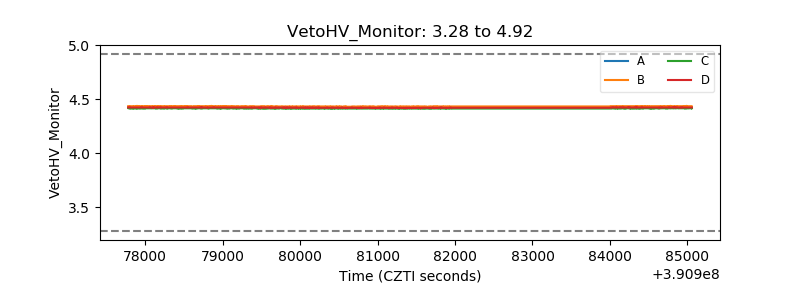 |
| Veto LLD | 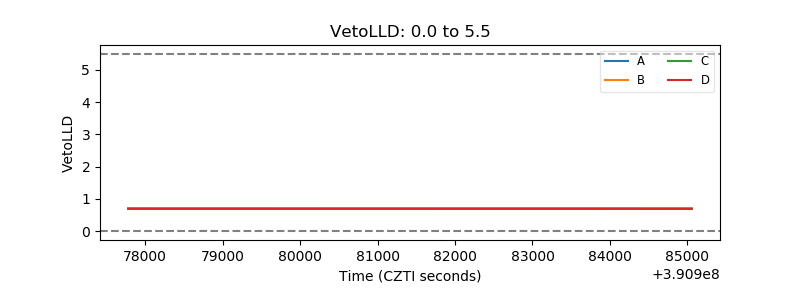 |
| Alpha Counter | 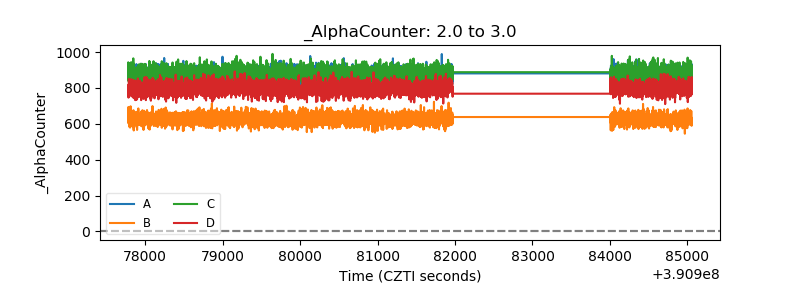 |
| _CPM_Rate | 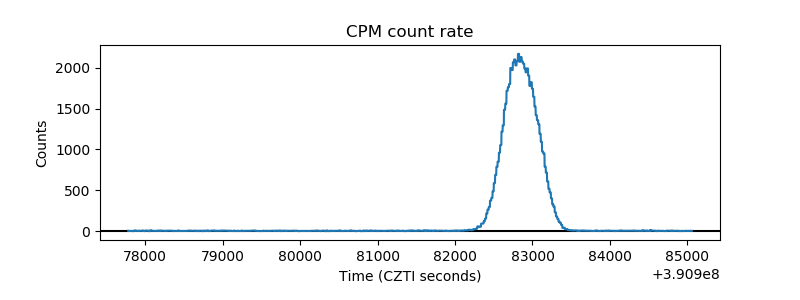 |
| CZT Counter | 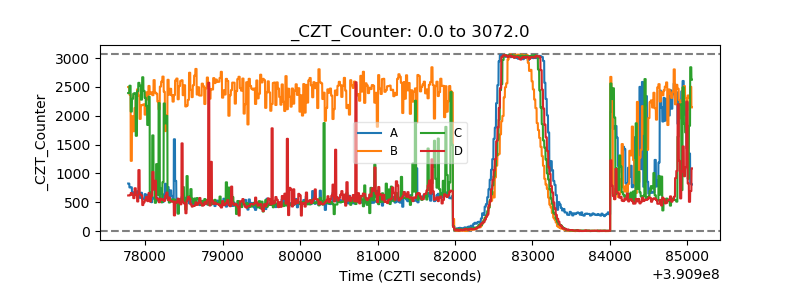 |
| +2.5 Volts monitor |  |
| +5 Volts monitor | 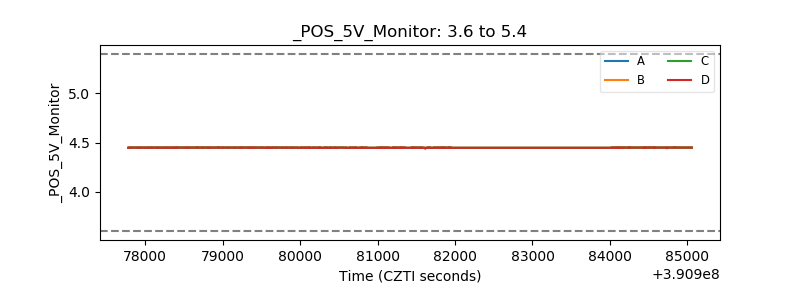 |
| _ROLL_ROT | 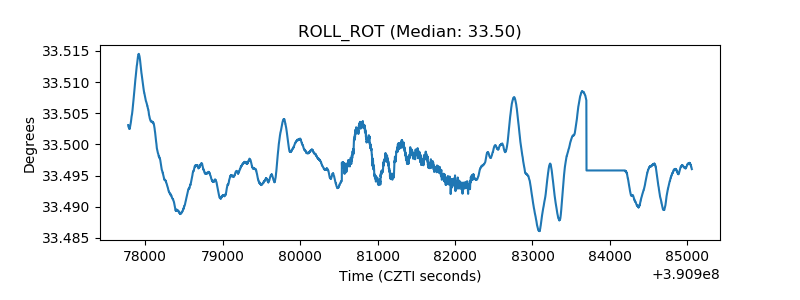 |
| _Roll_DEC | 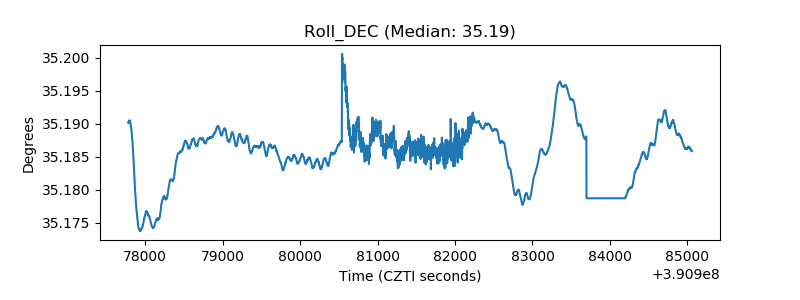 |
| _Roll_RA | 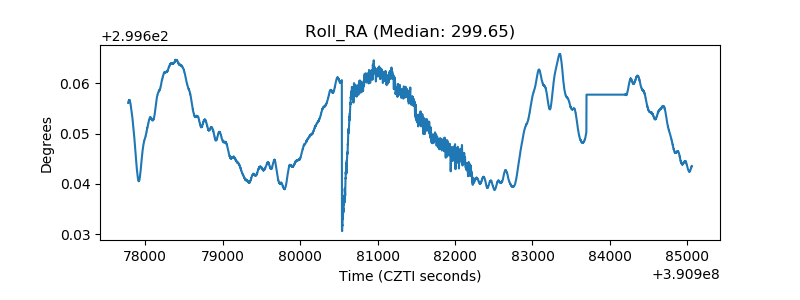 |
| Veto Counter | 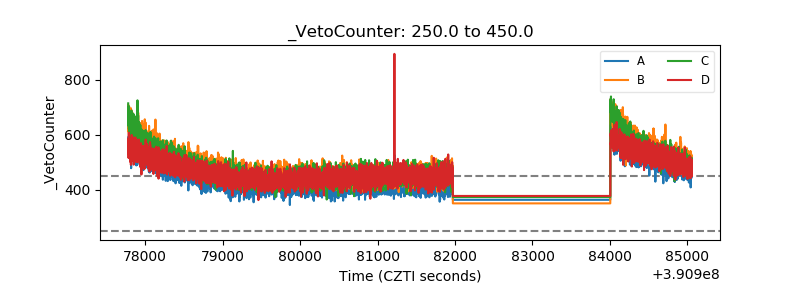 |