| Param | Original file | Final file |
|---|---|---|
| Filename | modeM0/AS1A11_080T01_9000005146_35951cztM0_level2.evt | modeM0/AS1A11_080T01_9000005146_35951cztM0_level2_quad_clean.evt |
| Size (bytes) | 785,142,720 | 80,887,680 |
| Size | 748.8 MB | 77.1 MB |
| Events in quadrant A | 2,702,096 | 586,932 |
| Events in quadrant B | 13,345,471 | 363,208 |
| Events in quadrant C | 3,710,319 | 559,394 |
| Events in quadrant D | 3,639,545 | 544,975 |
| Mode M9 | |||
|---|---|---|---|
| Quadrant | BADHDUFLAG | Total packets | Discarded packets |
| A | 0 | 16 | 0 |
| B | 0 | 16 | 0 |
| C | 0 | 16 | 0 |
| D | 0 | 16 | 0 |
| Mode SS | |||
|---|---|---|---|
| Quadrant | BADHDUFLAG | Total packets | Discarded packets |
| A | 0 | 112 | 0 |
| B | 0 | 112 | 0 |
| C | 0 | 112 | 0 |
| D | 0 | 112 | 0 |
| Mode M0 | |||
|---|---|---|---|
| Quadrant | BADHDUFLAG | Total packets | Discarded packets |
| A | 0 | 11582 | 2 |
| B | 0 | 43433 | 1 |
| C | 0 | 14502 | 1 |
| D | 0 | 14906 | 1 |
| Quadrant | Total seconds | Saturated seconds | Saturation percentage |
|---|---|---|---|
| A | 5627 | 8 | 0.142172% |
| B | 5627 | 5507 | 97.867425% |
| C | 5627 | 248 | 4.407322% |
| D | 5627 | 135 | 2.399147% |
Noise dominated data is calculated using 1-second bins in cleaned event files. If a bin has >2000 counts, and if more than 50% of those come from <1% of pixels, then it is considered to be noise-dominated and hence unusable.
| Quadrant | # 1 sec bins | Bins with >0 counts | Bins with >2000 counts | High rate bins dominated by noise | Noise dominated (total time) | Noise dominated (detector-on time) | Marked lightcurve |
|---|---|---|---|---|---|---|---|
| A | 7150 | 5628 | 0 | 0 | 0.00% | 0.00% | 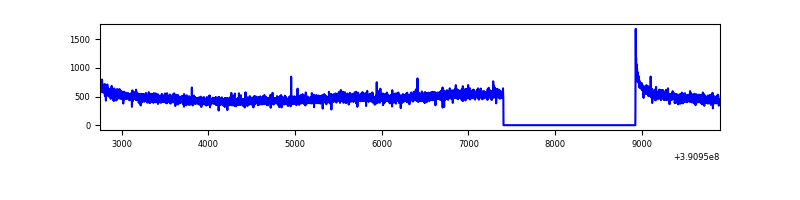 |
| B | 7150 | 5628 | 5068 | 5068 | 70.88% | 90.05% | 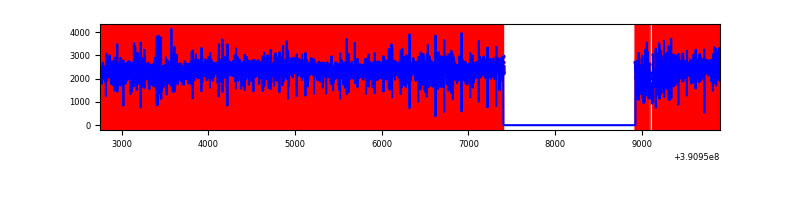 |
| C | 7150 | 5628 | 203 | 203 | 2.84% | 3.61% | 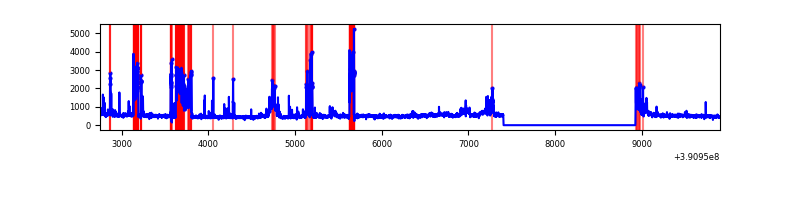 |
| D | 7150 | 5628 | 93 | 93 | 1.30% | 1.65% | 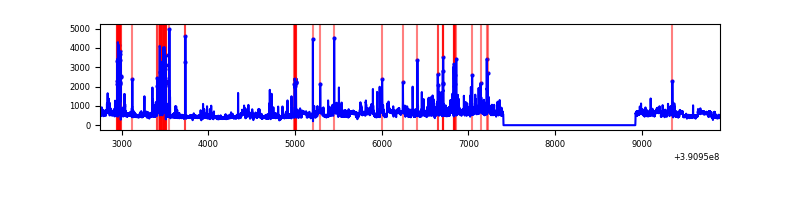 |
Top three noisy pixels from each quadrant. If the there are fewer than three noisy pixels in the level2.evt file, extra rows are filled as -1
| Pixel properties | Quadrant properties | ||||||
|---|---|---|---|---|---|---|---|
| Quadrant | DetID | PixID | Counts | Sigma | Mean | Median | Sigma |
| A | 10 | 83 | 140929 | 1036.89 | 657 | 646 | 135.3 |
| A | 13 | 6 | 12965 | 91.05 | 657 | 646 | 135.3 |
| A | 13 | 254 | 8873 | 60.81 | 657 | 646 | 135.3 |
| B | 5 | 14 | 3573386 | 45158.53 | 406 | 397 | 79.1 |
| B | 5 | 31 | 3531023 | 44623.11 | 406 | 397 | 79.1 |
| B | 5 | 15 | 3523187 | 44524.08 | 406 | 397 | 79.1 |
| C | 9 | 187 | 770257 | 5198.59 | 626 | 632 | 148.0 |
| C | 15 | 214 | 231110 | 1556.81 | 626 | 632 | 148.0 |
| C | 9 | 69 | 159656 | 1074.16 | 626 | 632 | 148.0 |
| D | 1 | 52 | 289501 | 1861.86 | 629 | 615 | 155.2 |
| D | 2 | 31 | 272748 | 1753.89 | 629 | 615 | 155.2 |
| D | 10 | 118 | 178813 | 1148.48 | 629 | 615 | 155.2 |
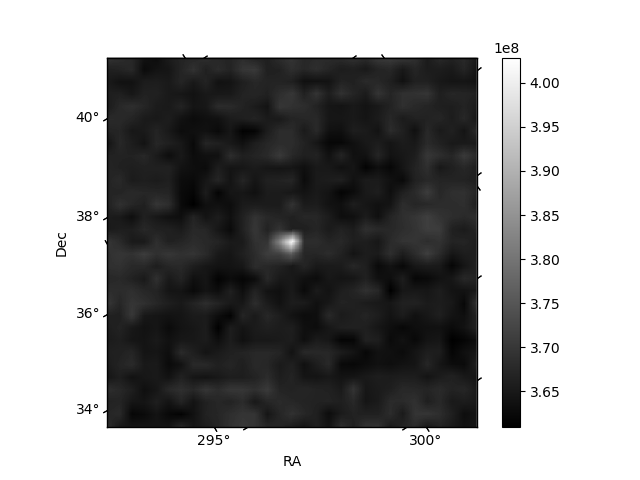
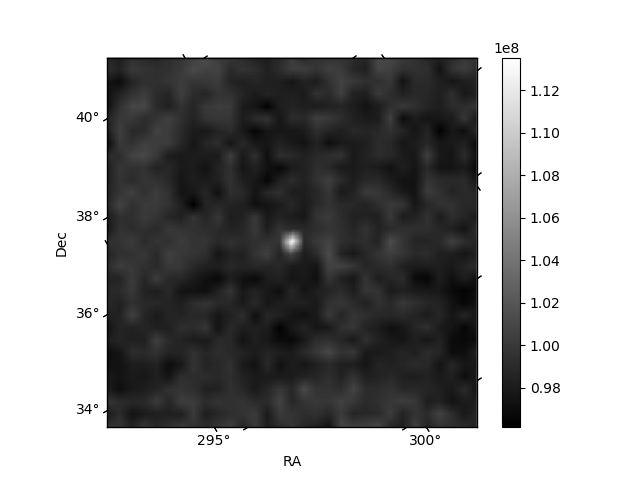
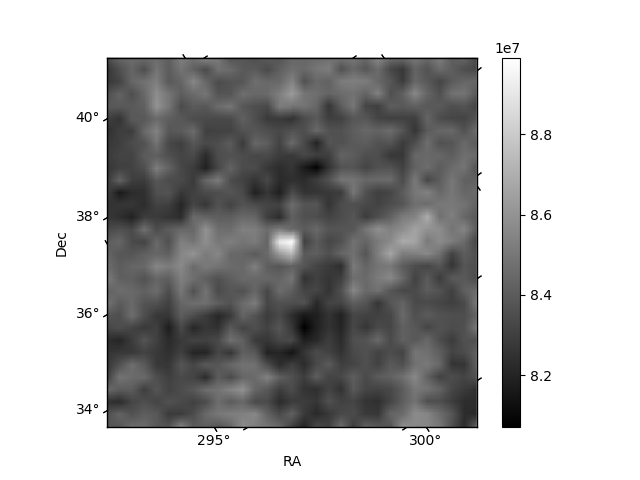
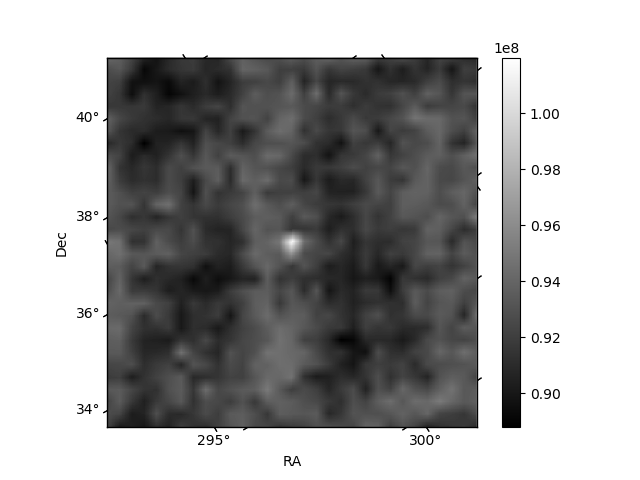
Histogram calculated using DETX and DETY for each event in the final _common_clean file
| Quadrant A | 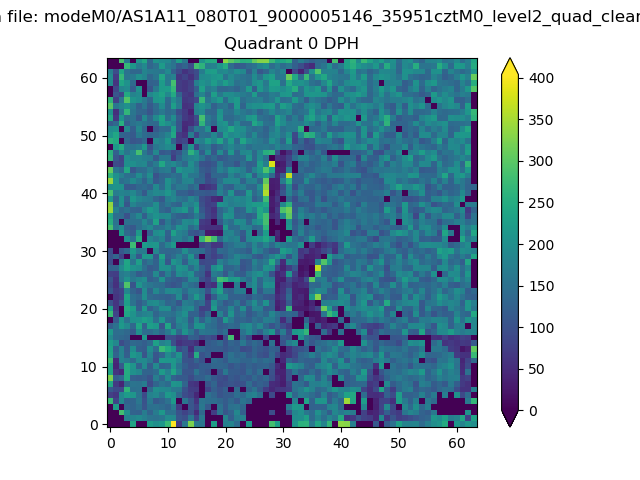 |
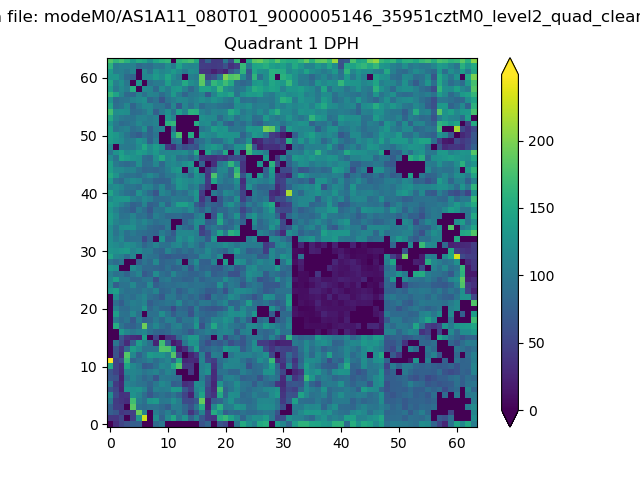 |
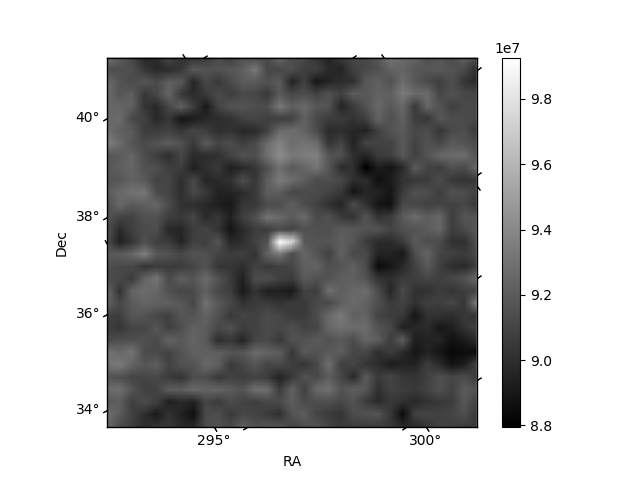
Quadrant B |
|---|---|---|---|
| Quadrant D | 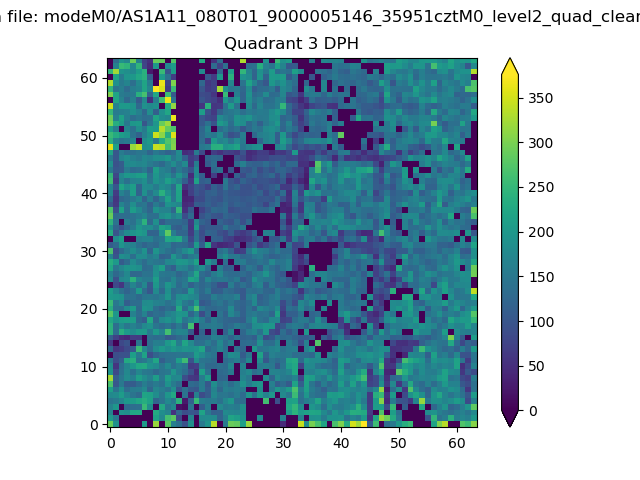 |
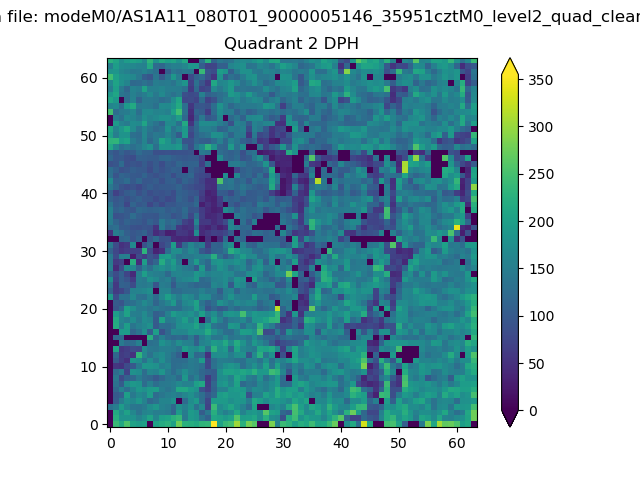 |
Quadrant C |
| Plot type | Count rate plots | Images |
|---|---|---|
| Comparison with Poisson distribution Blue bars denote a histogram of data divided into 1 sec bins. Red curve is a Poisson curve with rate = median count rate of data. |
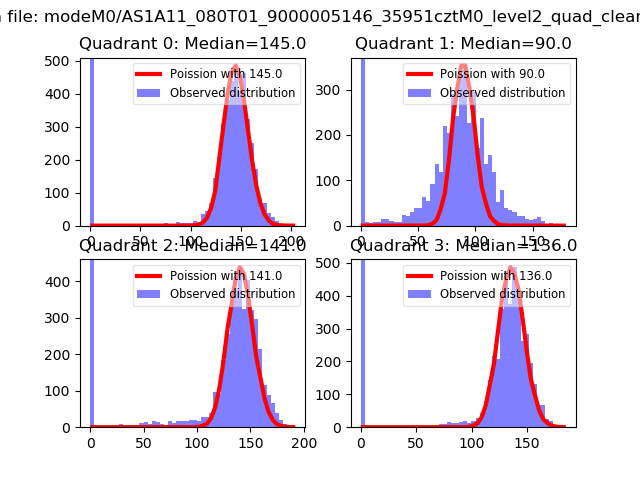 |
 |
| Quadrant-wise count rates Data is divided into 100 sec bins |
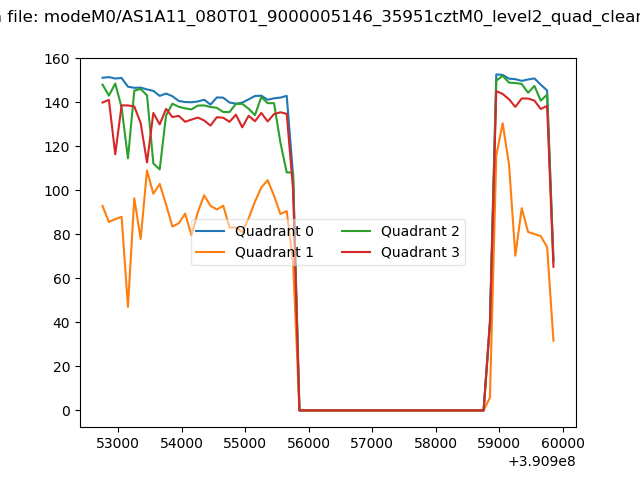 |
|
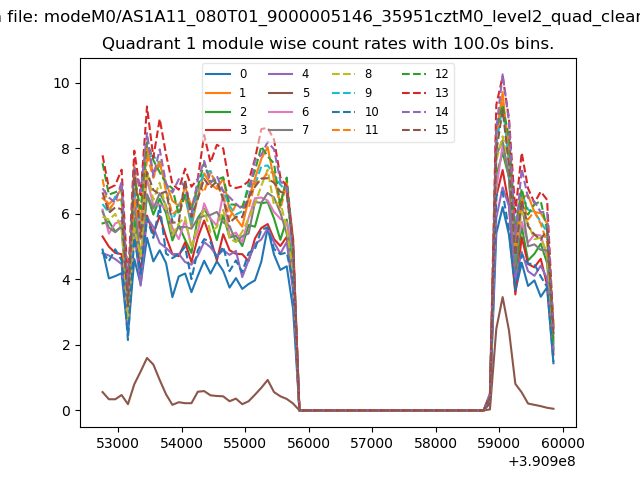
| Module-wise count rates for Quadrant A Data is divided into 100 sec bins |
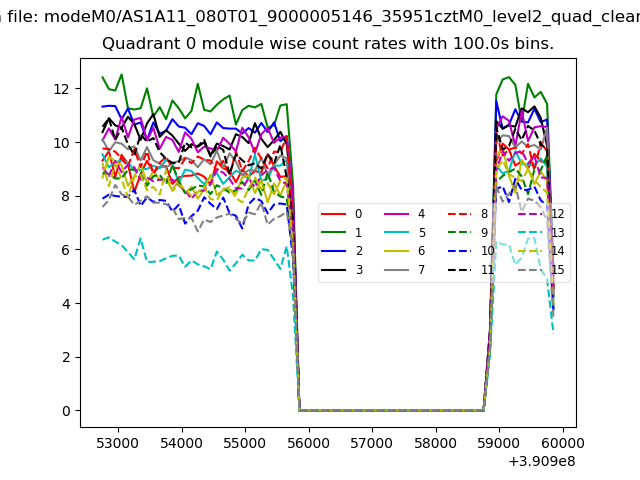 |
 |
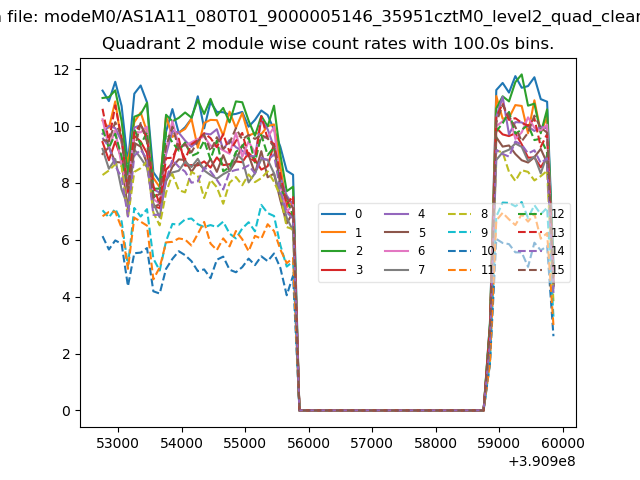
| Module-wise count rates for Quadrant B Data is divided into 100 sec bins |
 |
 |
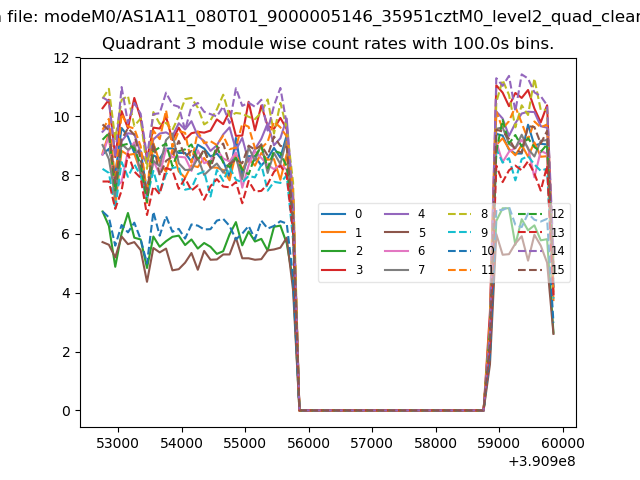
| Module-wise count rates for Quadrant C Data is divided into 100 sec bins |
 |
 |
| Module-wise count rates for Quadrant D Data is divided into 100 sec bins |
 |
 |
| Parameter | Plot |
|---|---|
| CZT HV Monitor | 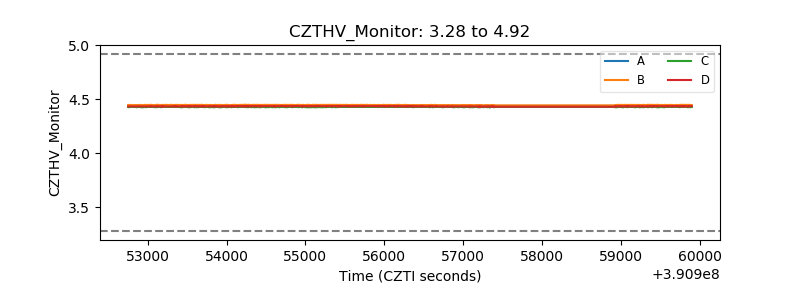 |
| D_VDD | 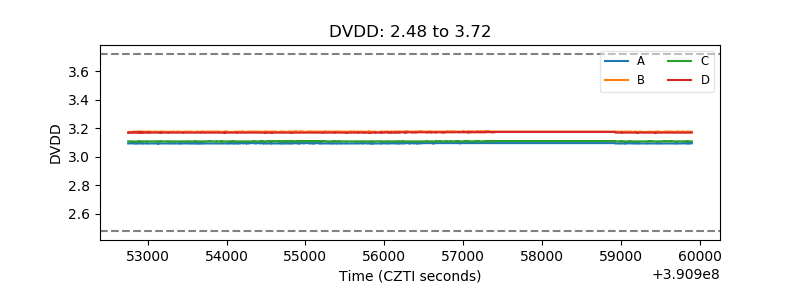 |
| Temperature 1 | 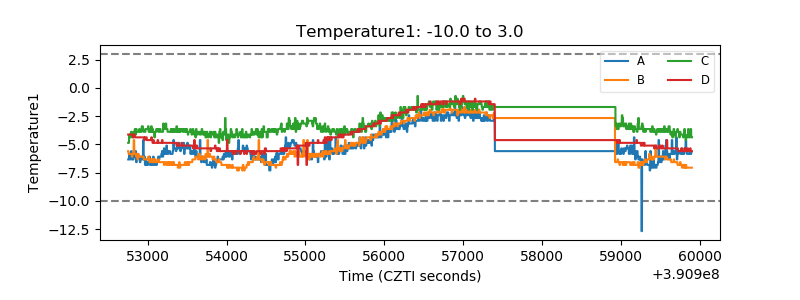 |
| Veto HV Monitor | 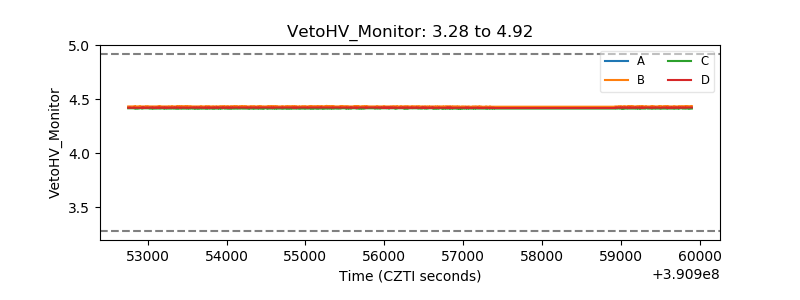 |
| Veto LLD | 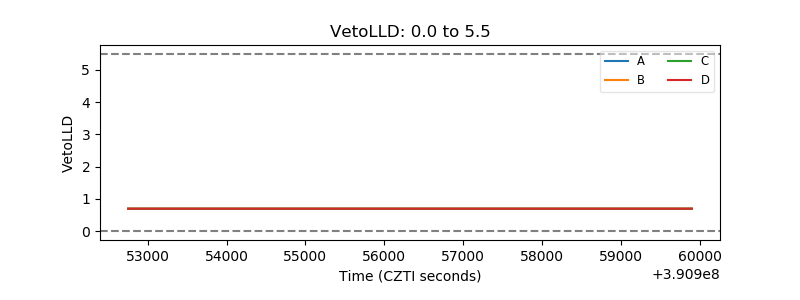 |
| Alpha Counter | 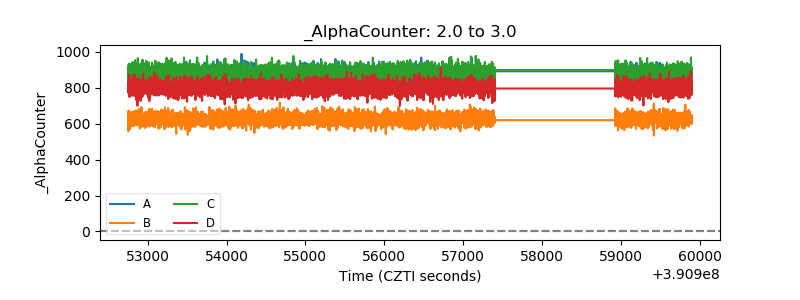 |
| _CPM_Rate | 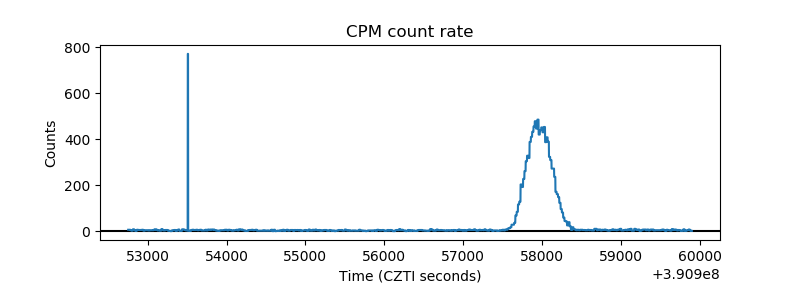 |
| CZT Counter | 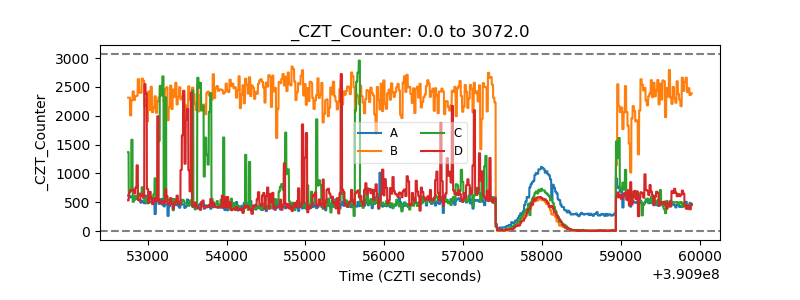 |
| +2.5 Volts monitor | 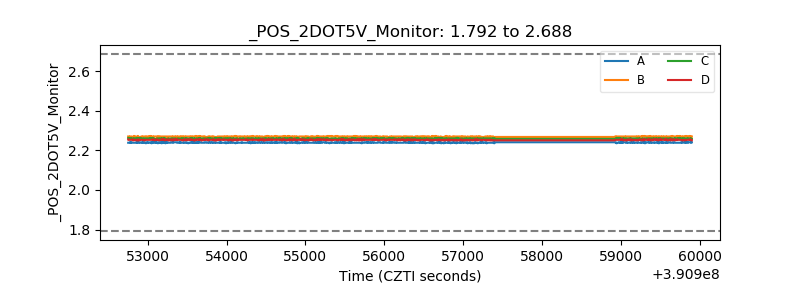 |
| +5 Volts monitor | 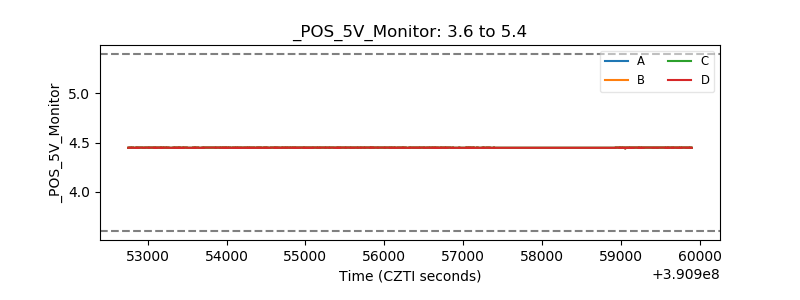 |
| _ROLL_ROT | 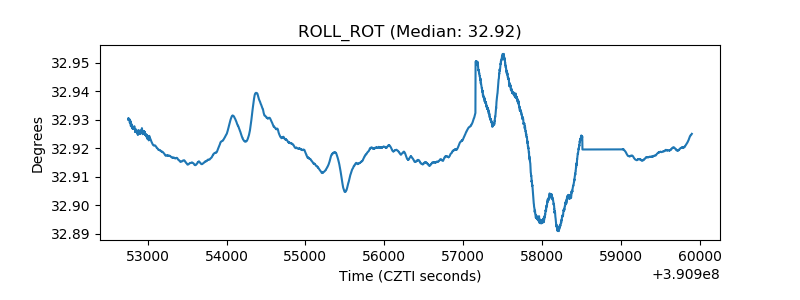 |
| _Roll_DEC | 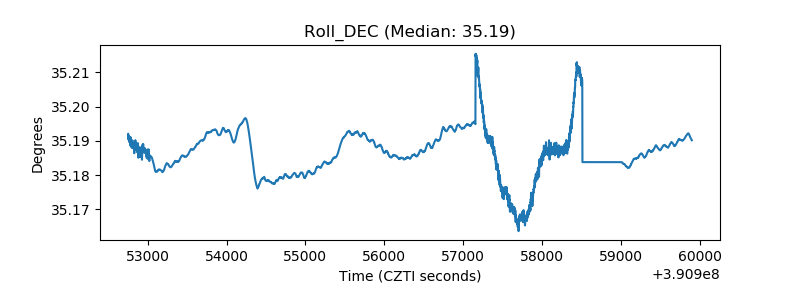 |
| _Roll_RA | 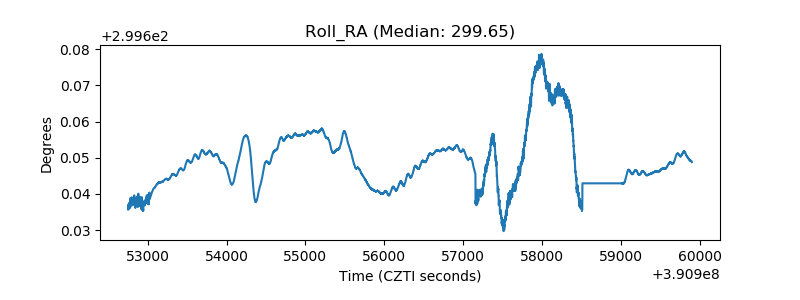 |
| Veto Counter | 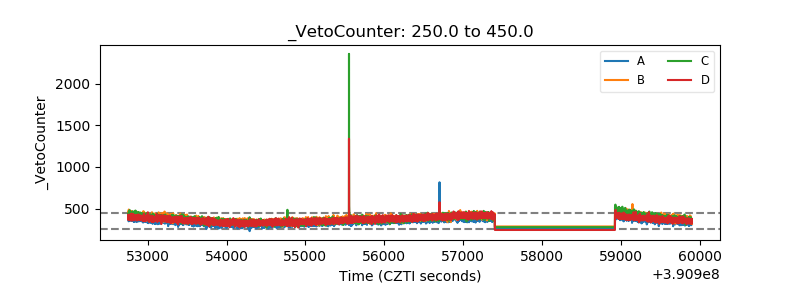 |