| Param | Original file | Final file |
|---|---|---|
| Filename | modeM0/AS1A11_080T01_9000005146_35948cztM0_level2.evt | modeM0/AS1A11_080T01_9000005146_35948cztM0_level2_quad_clean.evt |
| Size (bytes) | 588,191,040 | 98,231,040 |
| Size | 560.9 MB | 93.7 MB |
| Events in quadrant A | 2,992,090 | 677,148 |
| Events in quadrant B | 7,619,105 | 585,543 |
| Events in quadrant C | 3,256,555 | 660,729 |
| Events in quadrant D | 3,537,356 | 630,568 |
| Mode M9 | |||
|---|---|---|---|
| Quadrant | BADHDUFLAG | Total packets | Discarded packets |
| A | 0 | 23 | 0 |
| B | 0 | 23 | 0 |
| C | 0 | 23 | 0 |
| D | 0 | 24 | 0 |
| Mode SS | |||
|---|---|---|---|
| Quadrant | BADHDUFLAG | Total packets | Discarded packets |
| A | 0 | 124 | 0 |
| B | 0 | 124 | 0 |
| C | 0 | 124 | 0 |
| D | 0 | 124 | 0 |
| Mode M0 | |||
|---|---|---|---|
| Quadrant | BADHDUFLAG | Total packets | Discarded packets |
| A | 0 | 12486 | 3 |
| B | 0 | 26584 | 2 |
| C | 0 | 13063 | 2 |
| D | 0 | 14331 | 2 |
| Quadrant | Total seconds | Saturated seconds | Saturation percentage |
|---|---|---|---|
| A | 6014 | 11 | 0.182907% |
| B | 6014 | 2133 | 35.467243% |
| C | 6014 | 69 | 1.147323% |
| D | 6014 | 78 | 1.296974% |
Noise dominated data is calculated using 1-second bins in cleaned event files. If a bin has >2000 counts, and if more than 50% of those come from <1% of pixels, then it is considered to be noise-dominated and hence unusable.
| Quadrant | # 1 sec bins | Bins with >0 counts | Bins with >2000 counts | High rate bins dominated by noise | Noise dominated (total time) | Noise dominated (detector-on time) | Marked lightcurve |
|---|---|---|---|---|---|---|---|
| A | 7296 | 6015 | 0 | 0 | 0.00% | 0.00% | 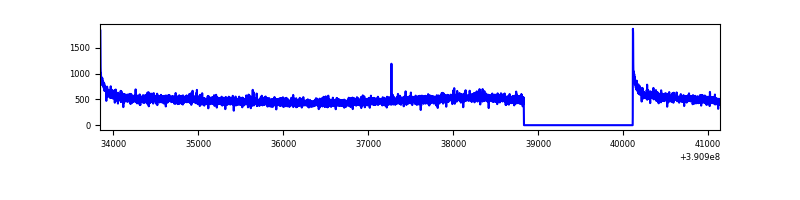 |
| B | 7296 | 6014 | 1760 | 1760 | 24.12% | 29.27% | 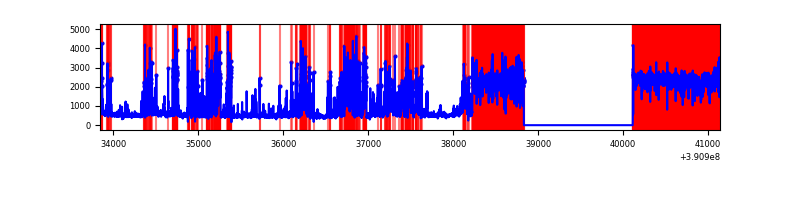 |
| C | 7296 | 6015 | 60 | 60 | 0.82% | 1.00% | 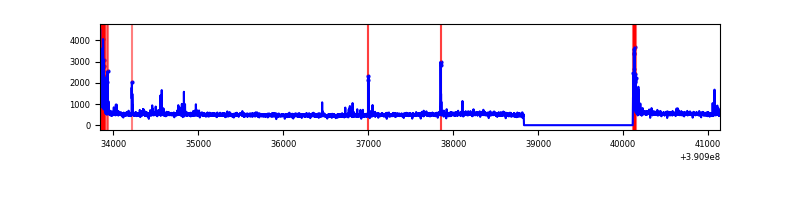 |
| D | 7296 | 6015 | 63 | 63 | 0.86% | 1.05% | 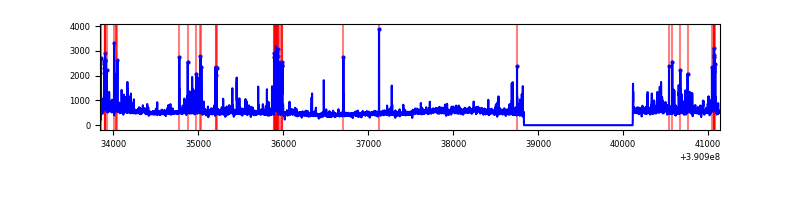 |
Top three noisy pixels from each quadrant. If the there are fewer than three noisy pixels in the level2.evt file, extra rows are filled as -1
| Pixel properties | Quadrant properties | ||||||
|---|---|---|---|---|---|---|---|
| Quadrant | DetID | PixID | Counts | Sigma | Mean | Median | Sigma |
| A | 10 | 83 | 178138 | 1169.49 | 726 | 711 | 151.7 |
| A | 13 | 254 | 9593 | 58.54 | 726 | 711 | 151.7 |
| A | 3 | 137 | 7402 | 44.1 | 726 | 711 | 151.7 |
| B | 5 | 172 | 2190871 | 18339.91 | 614 | 601 | 119.4 |
| B | 5 | 14 | 940670 | 7871.53 | 614 | 601 | 119.4 |
| B | 5 | 31 | 928508 | 7769.69 | 614 | 601 | 119.4 |
| C | 15 | 214 | 250044 | 1520.92 | 699 | 706 | 163.9 |
| C | 0 | 10 | 225852 | 1373.35 | 699 | 706 | 163.9 |
| C | 0 | 207 | 19874 | 116.92 | 699 | 706 | 163.9 |
| D | 8 | 195 | 198186 | 1146.15 | 701 | 686 | 172.3 |
| D | 1 | 52 | 127017 | 733.14 | 701 | 686 | 172.3 |
| D | 10 | 118 | 108366 | 624.9 | 701 | 686 | 172.3 |
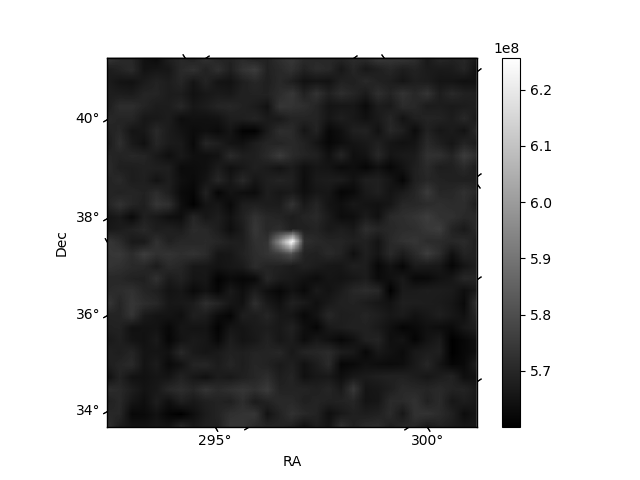
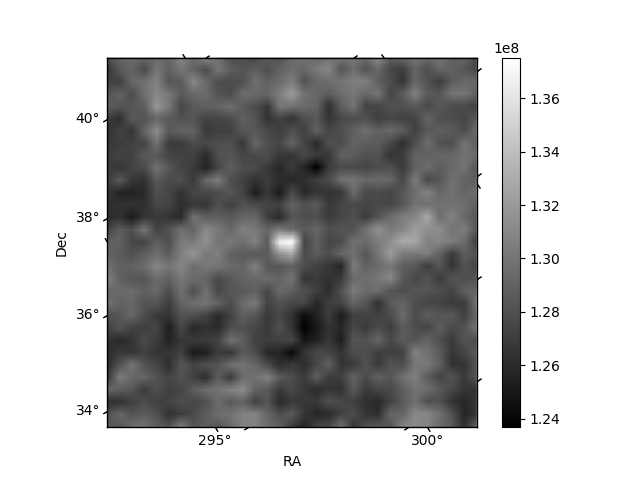
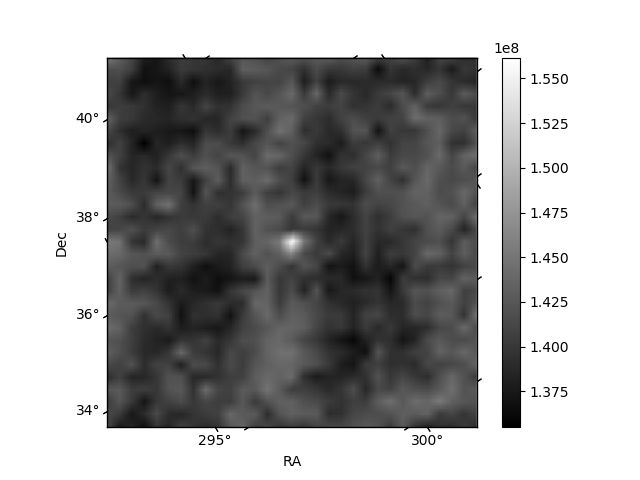
Histogram calculated using DETX and DETY for each event in the final _common_clean file
| Quadrant A | 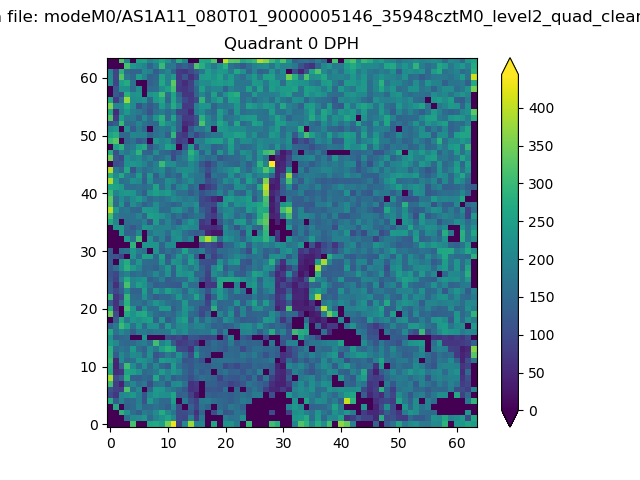 |
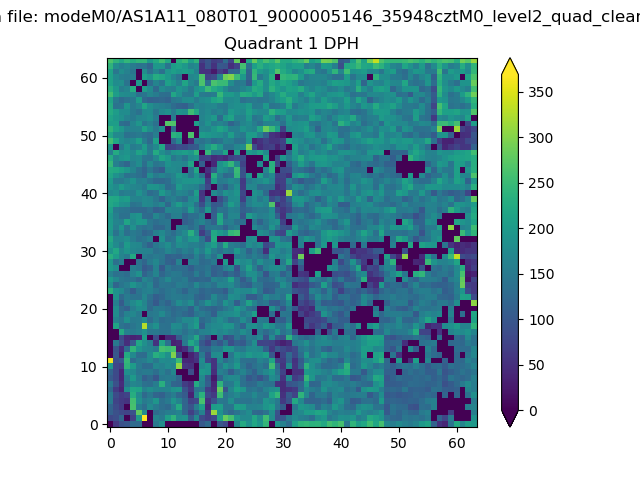 |
Quadrant B |
|---|---|---|---|
| Quadrant D | 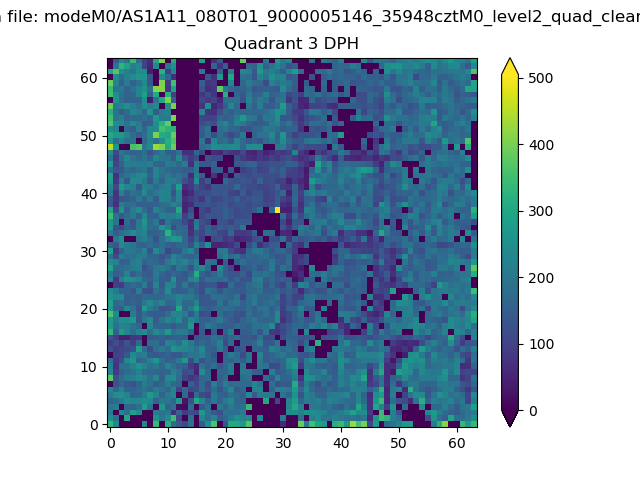 |
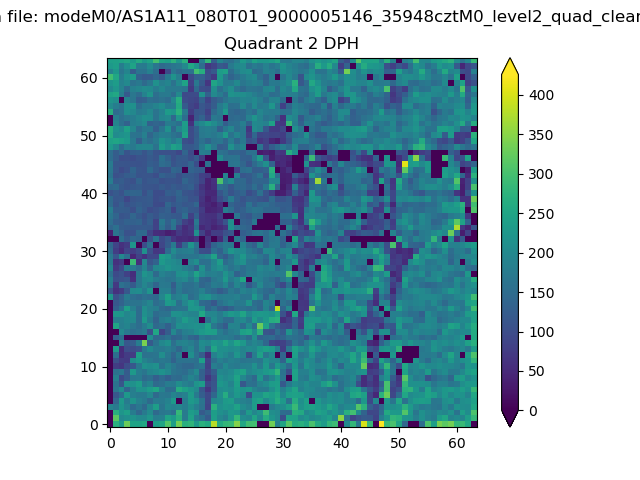 |
Quadrant C |
| Plot type | Count rate plots | Images |
|---|---|---|
| Comparison with Poisson distribution Blue bars denote a histogram of data divided into 1 sec bins. Red curve is a Poisson curve with rate = median count rate of data. |
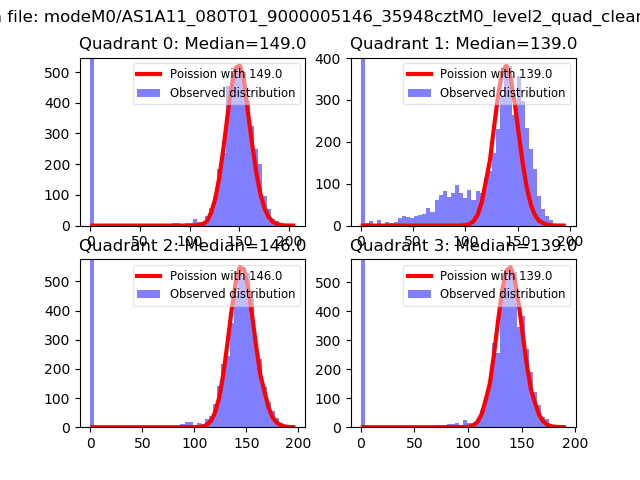 |
 |
| Quadrant-wise count rates Data is divided into 100 sec bins |
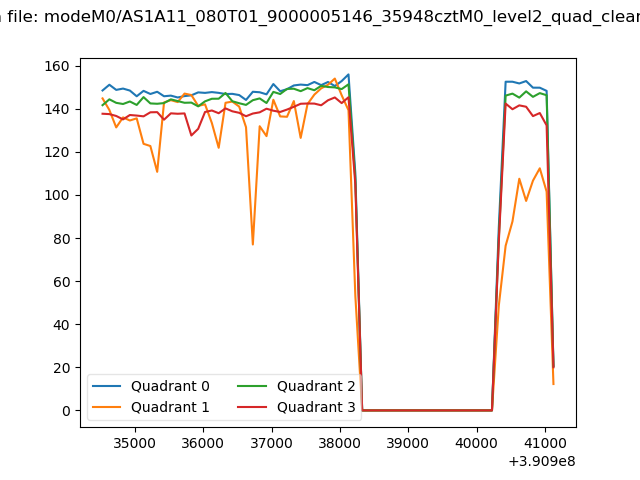 |
|
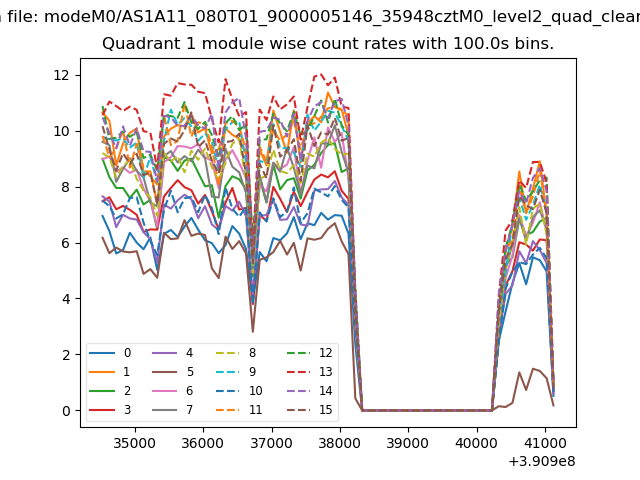
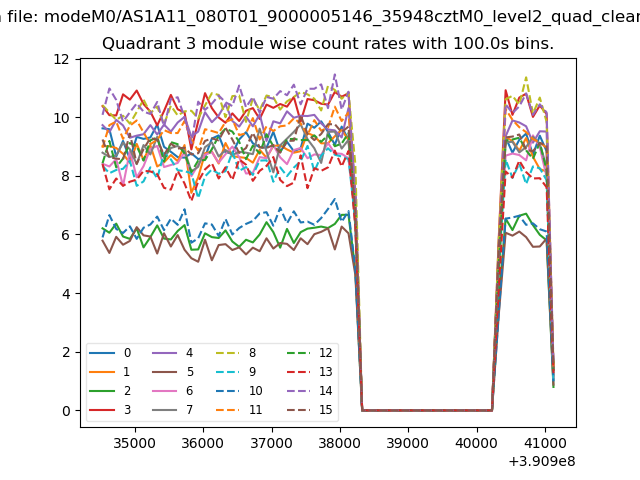
| Module-wise count rates for Quadrant A Data is divided into 100 sec bins |
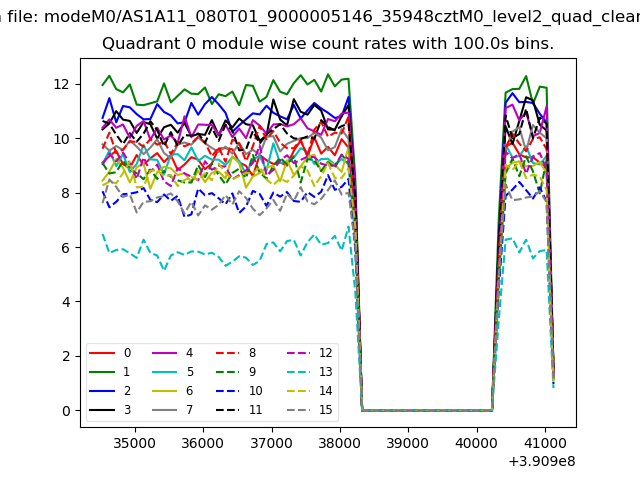 |
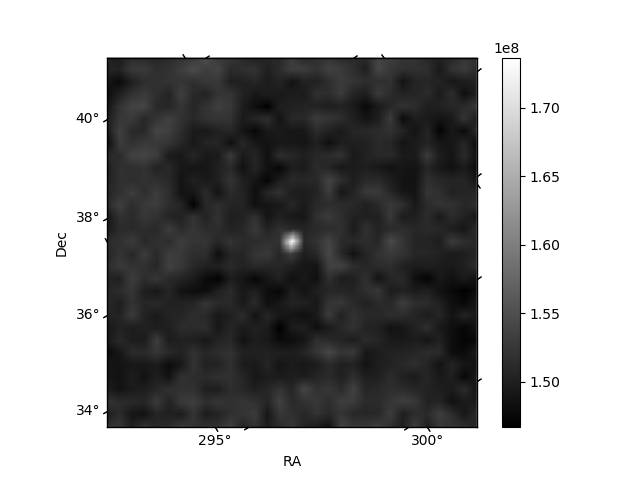 |
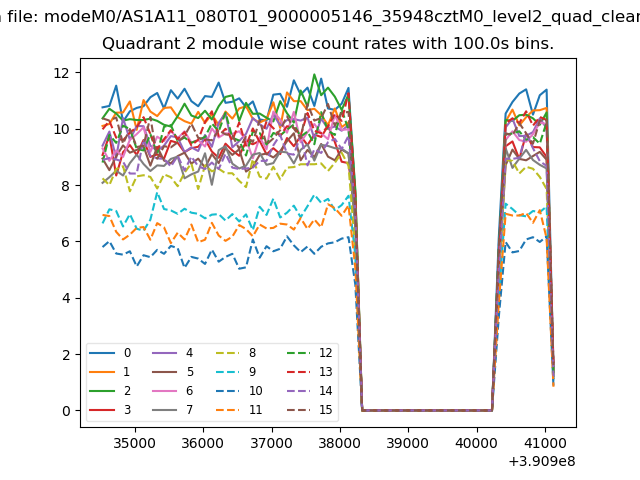
| Module-wise count rates for Quadrant B Data is divided into 100 sec bins |
 |
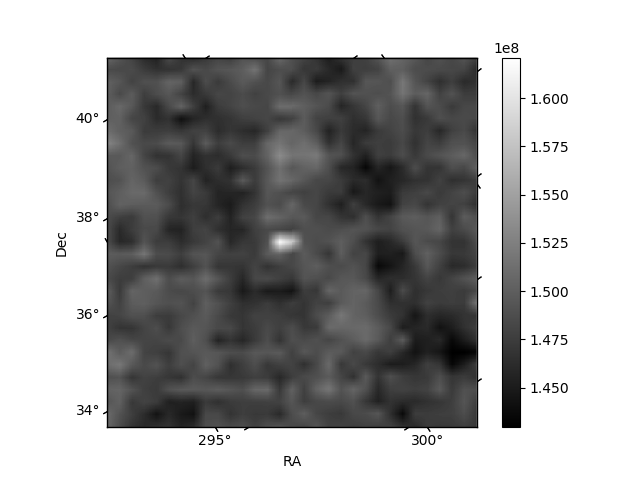 |
| Module-wise count rates for Quadrant C Data is divided into 100 sec bins |
 |
 |
| Module-wise count rates for Quadrant D Data is divided into 100 sec bins |
 |
 |
| Parameter | Plot |
|---|---|
| CZT HV Monitor | 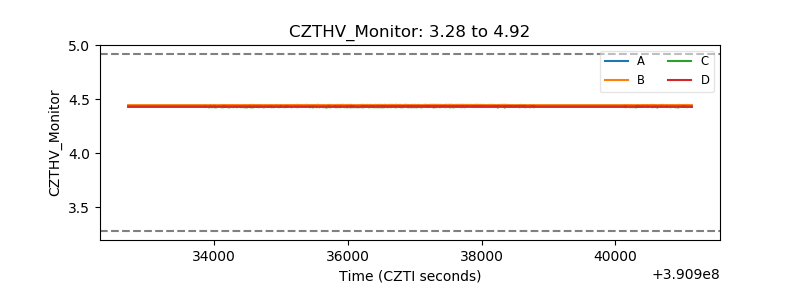 |
| D_VDD | 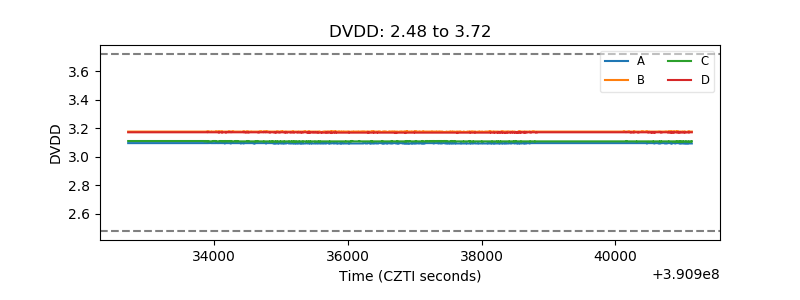 |
| Temperature 1 | 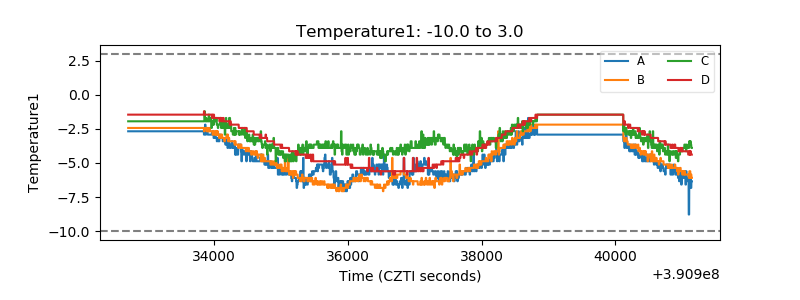 |
| Veto HV Monitor | 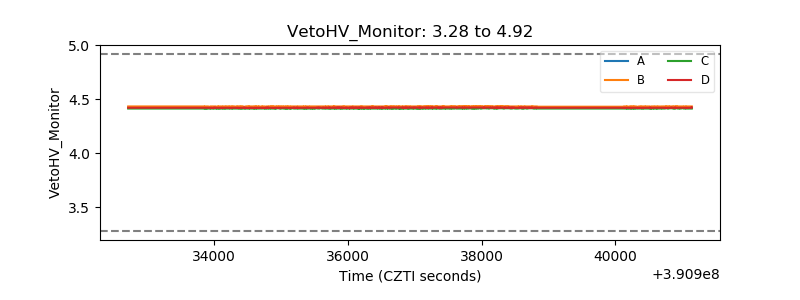 |
| Veto LLD | 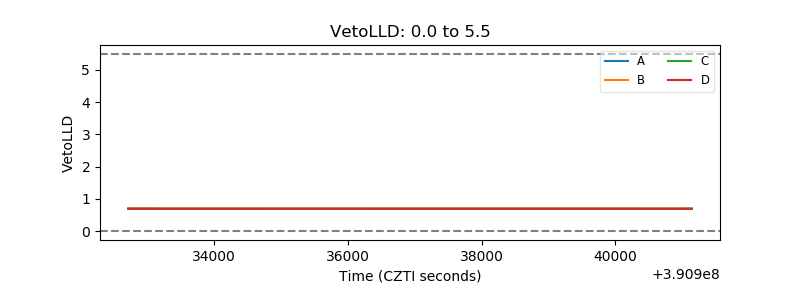 |
| Alpha Counter | 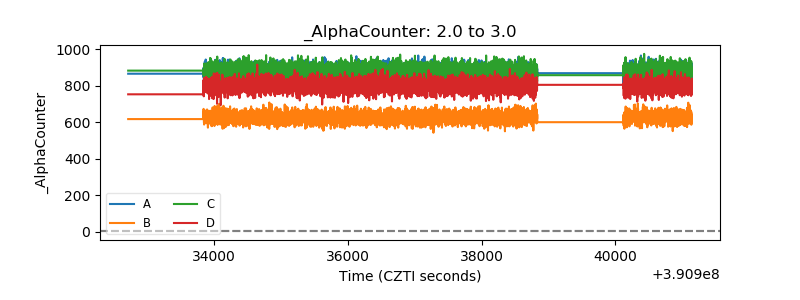 |
| _CPM_Rate | 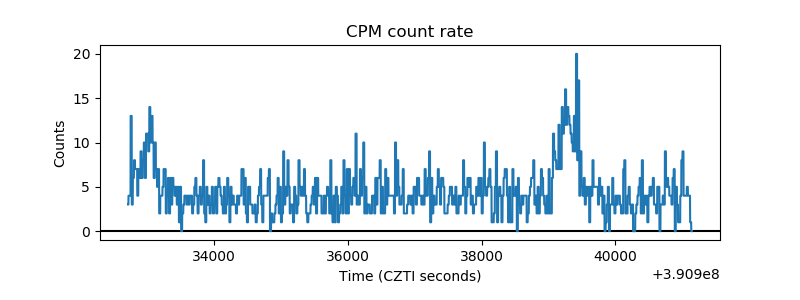 |
| CZT Counter | 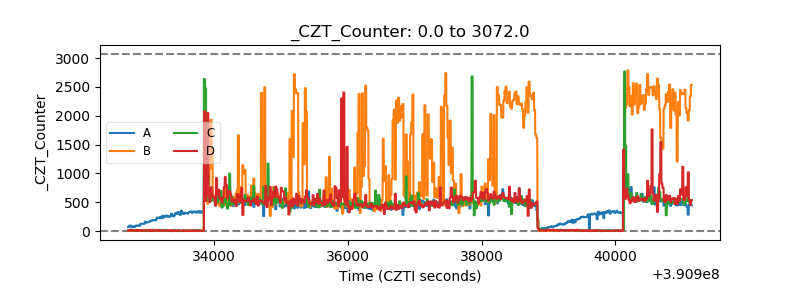 |
| +2.5 Volts monitor | 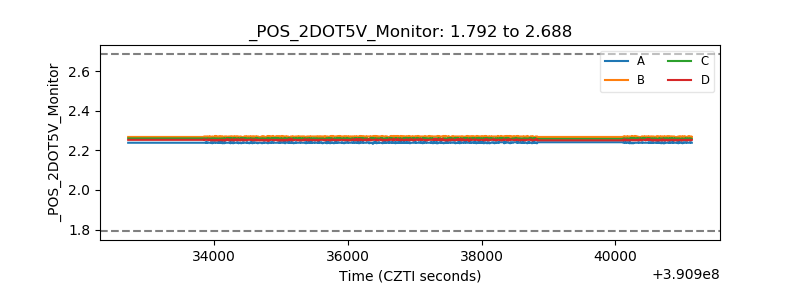 |
| +5 Volts monitor | 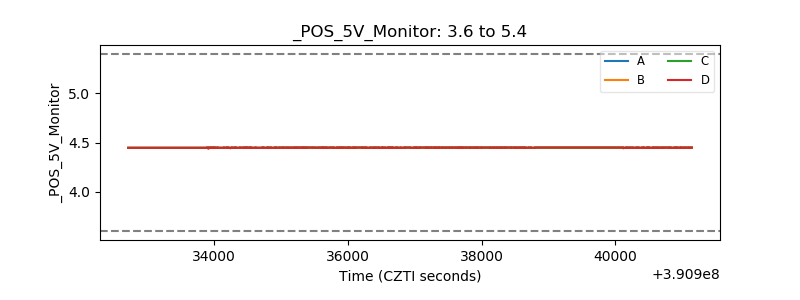 |
| _ROLL_ROT | 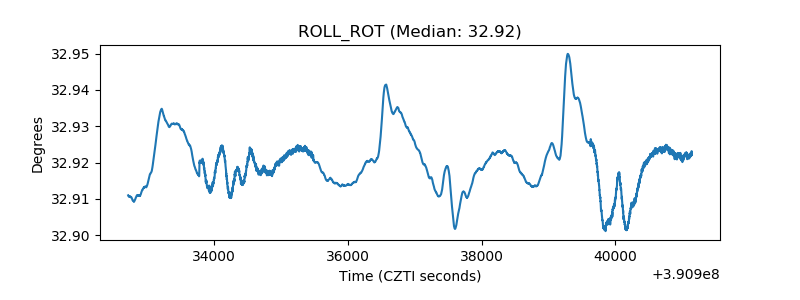 |
| _Roll_DEC | 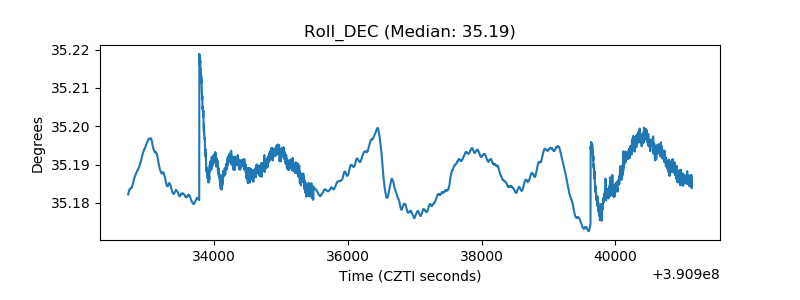 |
| _Roll_RA | 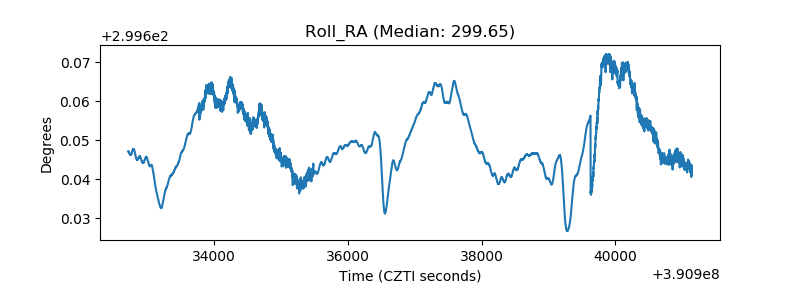 |
| Veto Counter | 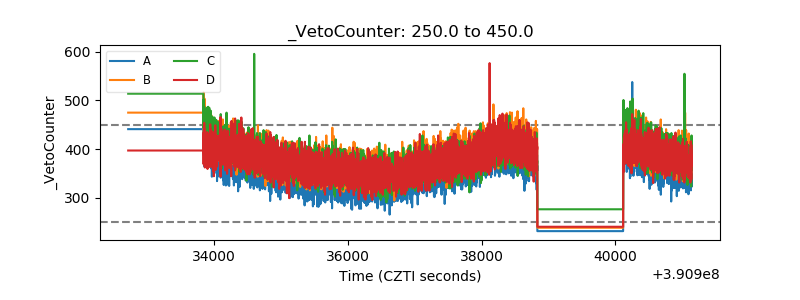 |