| Param | Original file | Final file |
|---|---|---|
| Filename | modeM0/AS1A11_080T01_9000005146_35946cztM0_level2.evt | modeM0/AS1A11_080T01_9000005146_35946cztM0_level2_quad_clean.evt |
| Size (bytes) | 463,080,960 | 74,704,320 |
| Size | 441.6 MB | 71.2 MB |
| Events in quadrant A | 2,756,035 | 487,197 |
| Events in quadrant B | 3,713,221 | 476,228 |
| Events in quadrant C | 3,053,100 | 473,308 |
| Events in quadrant D | 4,127,742 | 439,654 |
| Mode M9 | |||
|---|---|---|---|
| Quadrant | BADHDUFLAG | Total packets | Discarded packets |
| A | 0 | 35 | 0 |
| B | 0 | 35 | 0 |
| C | 0 | 35 | 0 |
| D | 0 | 35 | 0 |
| Mode SS | |||
|---|---|---|---|
| Quadrant | BADHDUFLAG | Total packets | Discarded packets |
| A | 0 | 114 | 0 |
| B | 0 | 114 | 0 |
| C | 0 | 114 | 0 |
| D | 0 | 114 | 0 |
| Mode M0 | |||
|---|---|---|---|
| Quadrant | BADHDUFLAG | Total packets | Discarded packets |
| A | 0 | 11384 | 3 |
| B | 0 | 14506 | 2 |
| C | 0 | 12132 | 2 |
| D | 0 | 15716 | 2 |
| Quadrant | Total seconds | Saturated seconds | Saturation percentage |
|---|---|---|---|
| A | 5511 | 8 | 0.145164% |
| B | 5511 | 312 | 5.661404% |
| C | 5511 | 122 | 2.213754% |
| D | 5511 | 379 | 6.877155% |
Noise dominated data is calculated using 1-second bins in cleaned event files. If a bin has >2000 counts, and if more than 50% of those come from <1% of pixels, then it is considered to be noise-dominated and hence unusable.
| Quadrant | # 1 sec bins | Bins with >0 counts | Bins with >2000 counts | High rate bins dominated by noise | Noise dominated (total time) | Noise dominated (detector-on time) | Marked lightcurve |
|---|---|---|---|---|---|---|---|
| A | 9035 | 5513 | 0 | 0 | 0.00% | 0.00% | 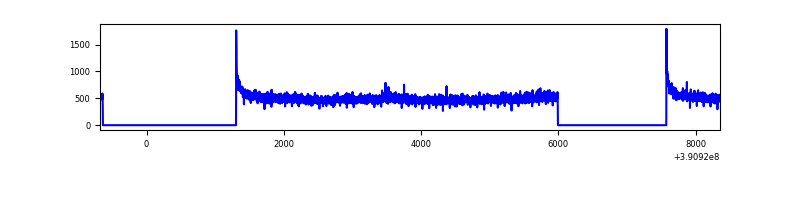 |
| B | 9035 | 5513 | 223 | 223 | 2.47% | 4.04% | 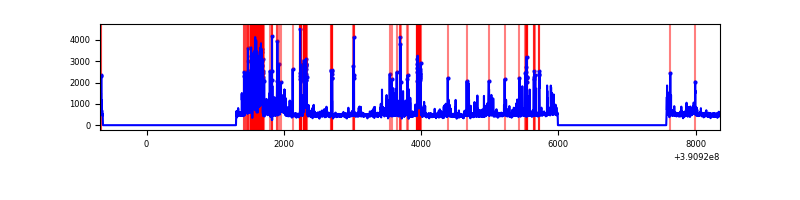 |
| C | 9035 | 5513 | 88 | 88 | 0.97% | 1.60% | 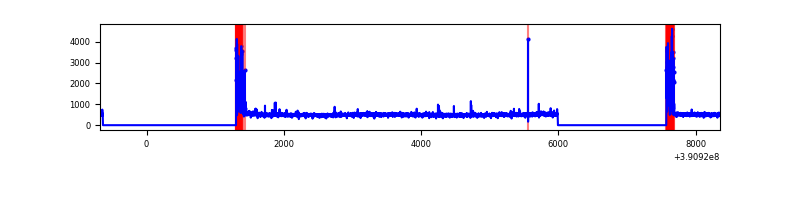 |
| D | 9035 | 5513 | 334 | 334 | 3.70% | 6.06% | 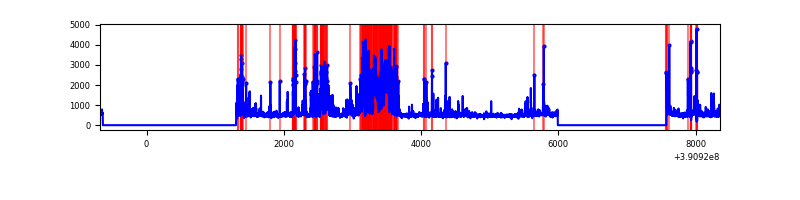 |
Top three noisy pixels from each quadrant. If the there are fewer than three noisy pixels in the level2.evt file, extra rows are filled as -1
| Pixel properties | Quadrant properties | ||||||
|---|---|---|---|---|---|---|---|
| Quadrant | DetID | PixID | Counts | Sigma | Mean | Median | Sigma |
| A | 10 | 83 | 171234 | 1264.57 | 662 | 652 | 134.9 |
| A | 15 | 169 | 22650 | 163.08 | 662 | 652 | 134.9 |
| A | 13 | 254 | 9061 | 62.34 | 662 | 652 | 134.9 |
| B | 5 | 172 | 835365 | 6744.82 | 638 | 624 | 123.8 |
| B | 4 | 171 | 161219 | 1297.63 | 638 | 624 | 123.8 |
| B | 0 | 213 | 100911 | 810.33 | 638 | 624 | 123.8 |
| C | 0 | 10 | 307535 | 2083.46 | 631 | 638 | 147.3 |
| C | 15 | 214 | 229786 | 1555.64 | 631 | 638 | 147.3 |
| C | 14 | 128 | 15990 | 104.22 | 631 | 638 | 147.3 |
| D | 12 | 227 | 740123 | 4820.33 | 623 | 608 | 153.4 |
| D | 13 | 249 | 238790 | 1552.52 | 623 | 608 | 153.4 |
| D | 8 | 195 | 209140 | 1359.26 | 623 | 608 | 153.4 |
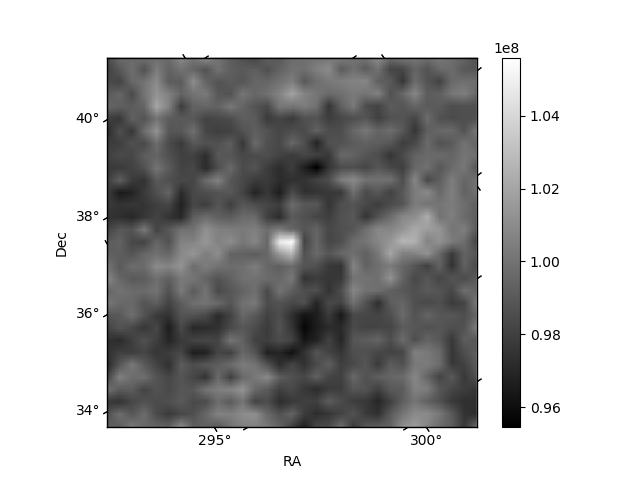
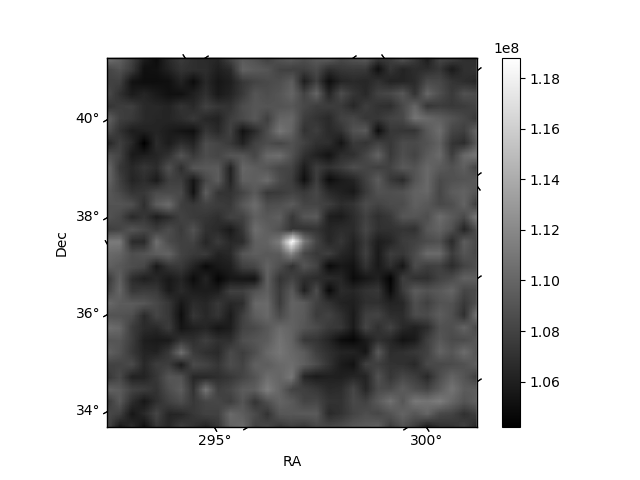
Histogram calculated using DETX and DETY for each event in the final _common_clean file
| Quadrant A | 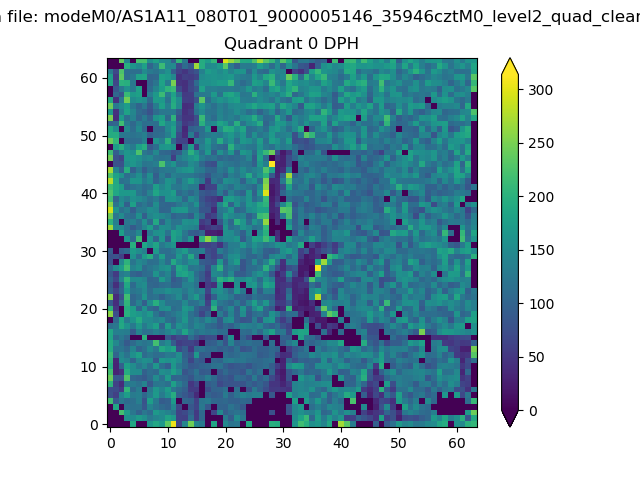 |
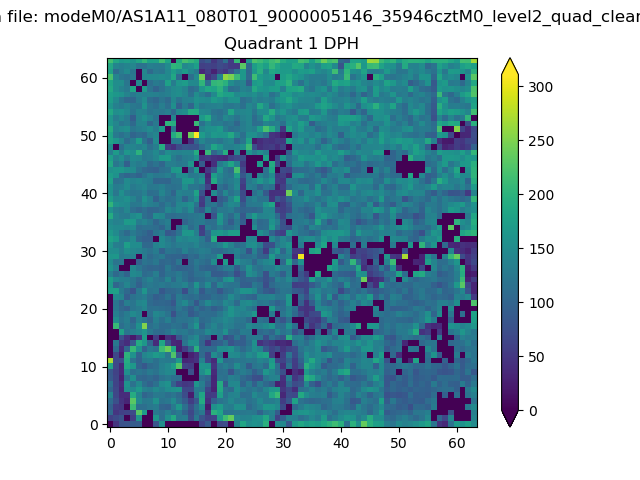 |
Quadrant B |
|---|---|---|---|
| Quadrant D | 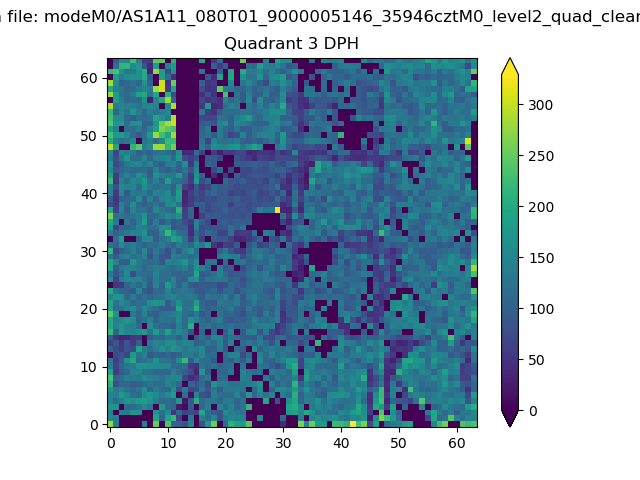 |
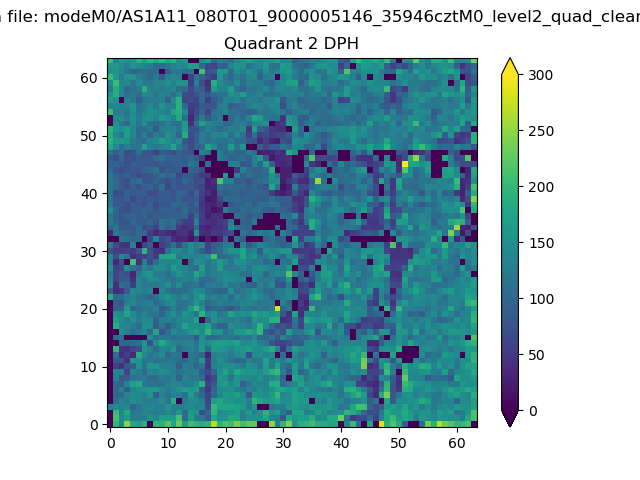 |
Quadrant C |
| Plot type | Count rate plots | Images |
|---|---|---|
| Comparison with Poisson distribution Blue bars denote a histogram of data divided into 1 sec bins. Red curve is a Poisson curve with rate = median count rate of data. |
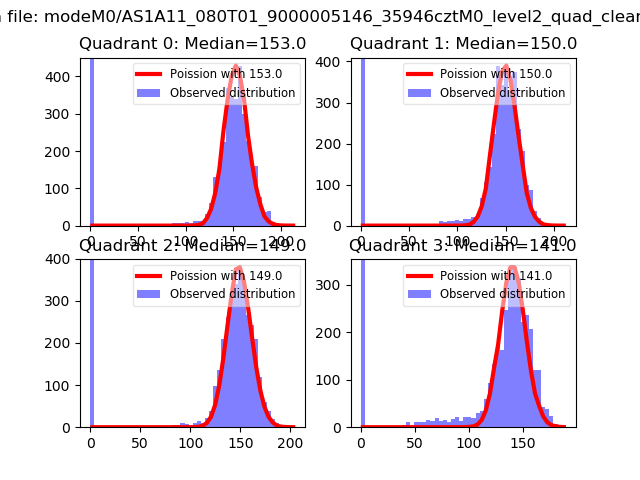 |
 |
| Quadrant-wise count rates Data is divided into 100 sec bins |
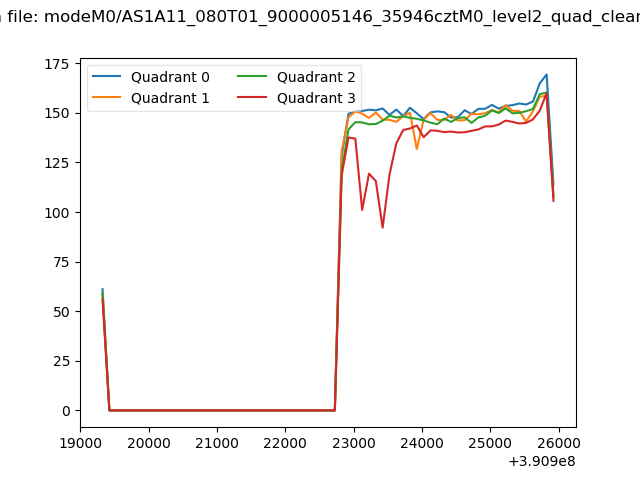 |
|
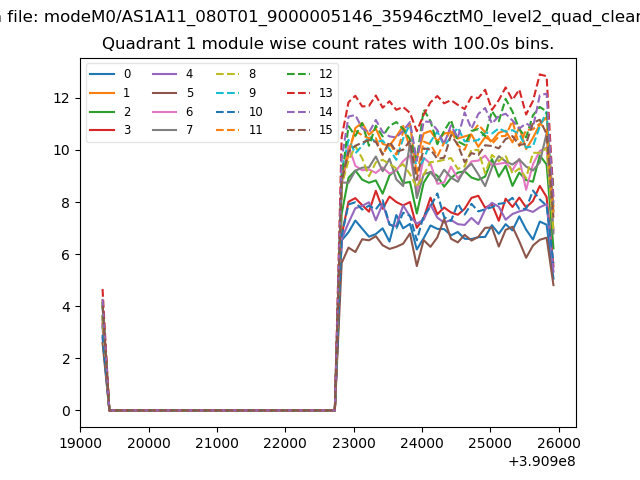
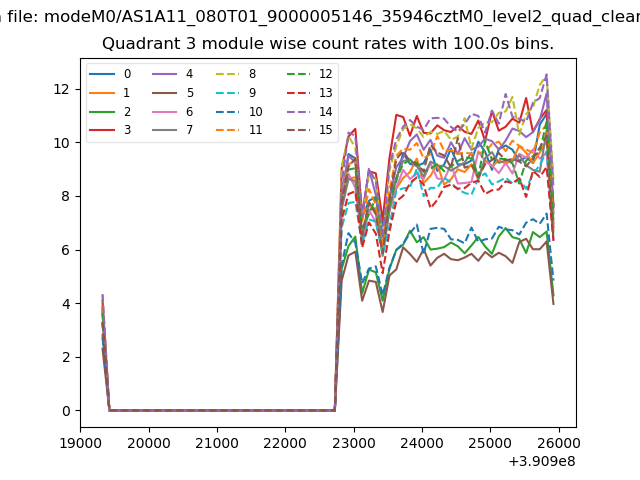
| Module-wise count rates for Quadrant A Data is divided into 100 sec bins |
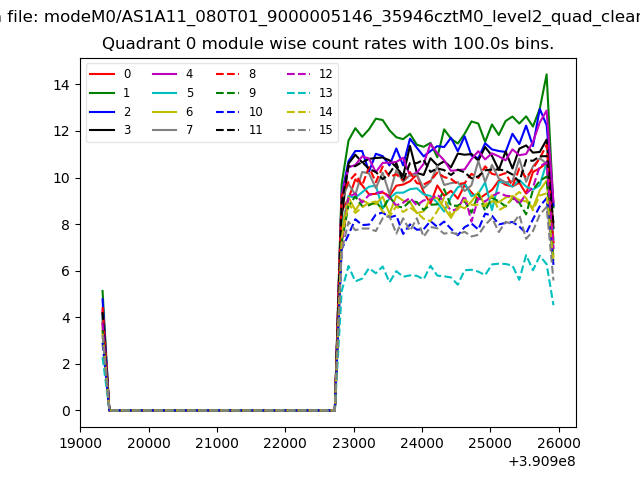 |
 |
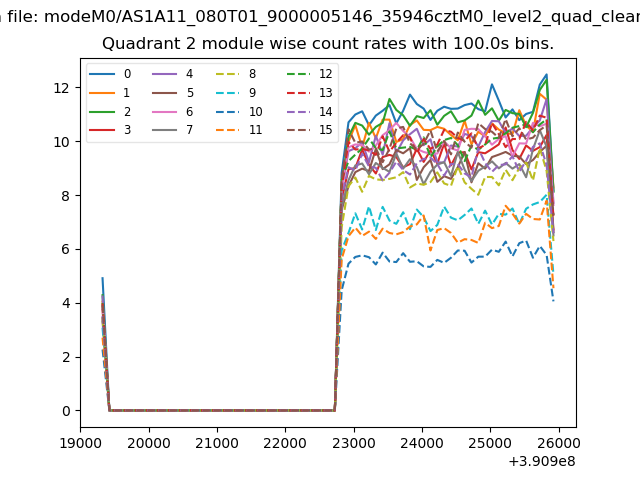
| Module-wise count rates for Quadrant B Data is divided into 100 sec bins |
 |
 |
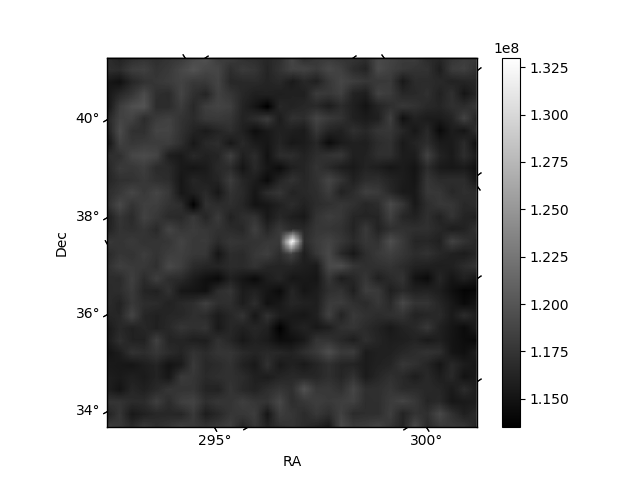
| Module-wise count rates for Quadrant C Data is divided into 100 sec bins |
 |
 |
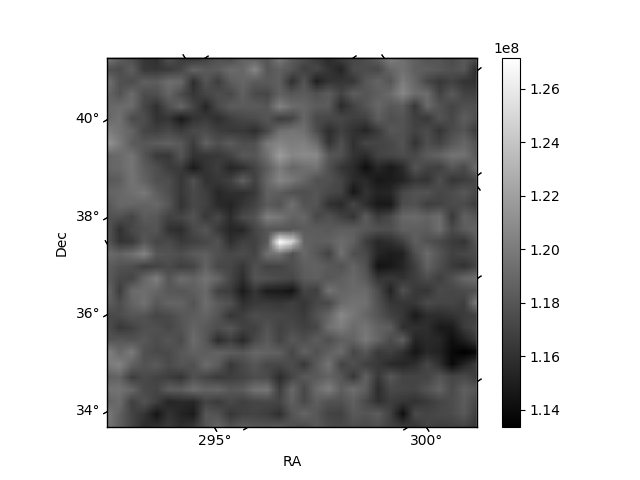
| Module-wise count rates for Quadrant D Data is divided into 100 sec bins |
 |
 |
| Parameter | Plot |
|---|---|
| CZT HV Monitor | 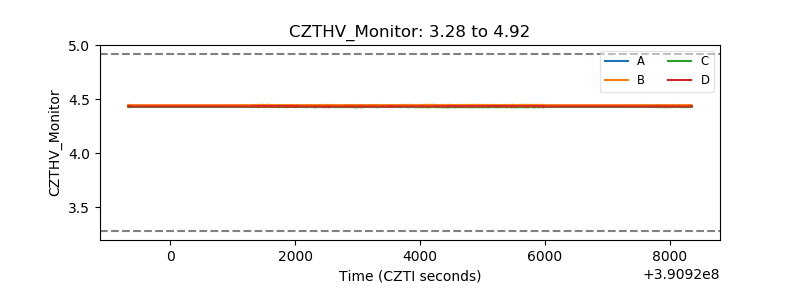 |
| D_VDD | 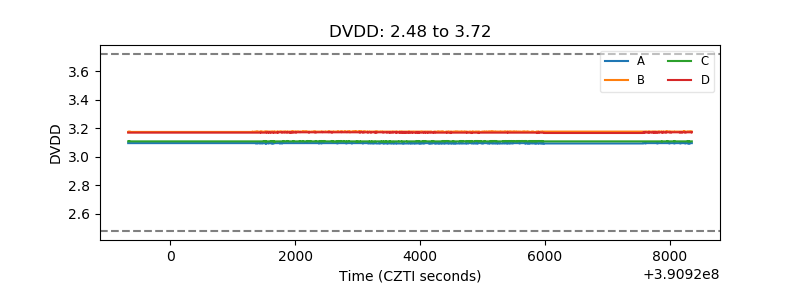 |
| Temperature 1 | 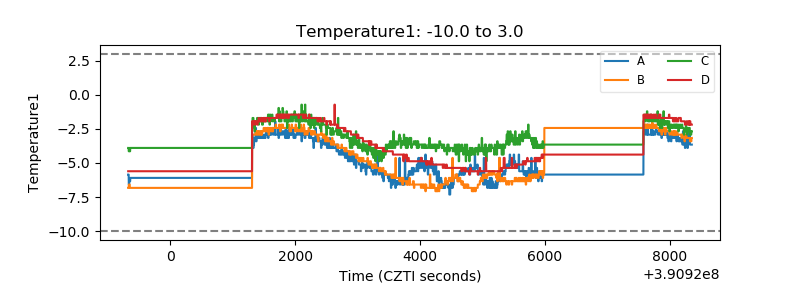 |
| Veto HV Monitor | 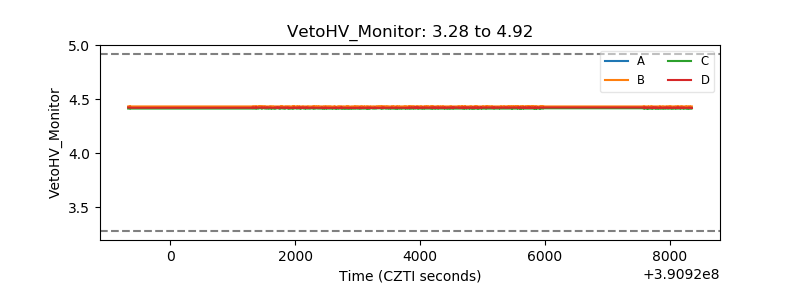 |
| Veto LLD | 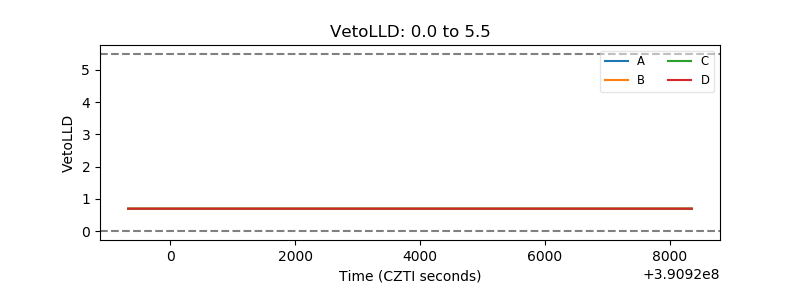 |
| Alpha Counter | 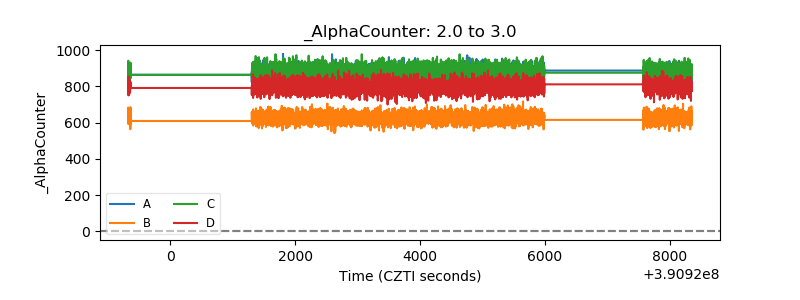 |
| _CPM_Rate | 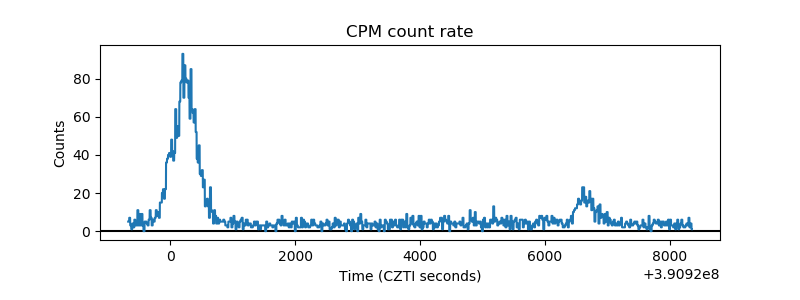 |
| CZT Counter | 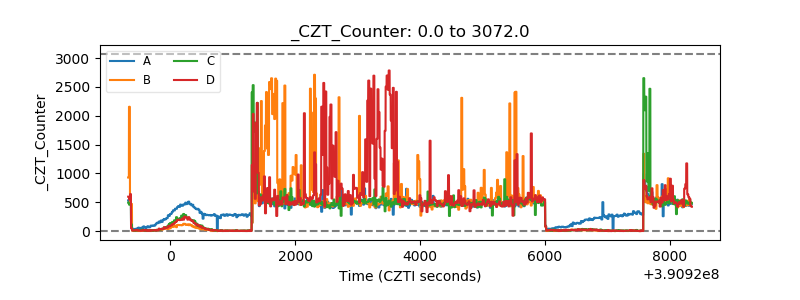 |
| +2.5 Volts monitor | 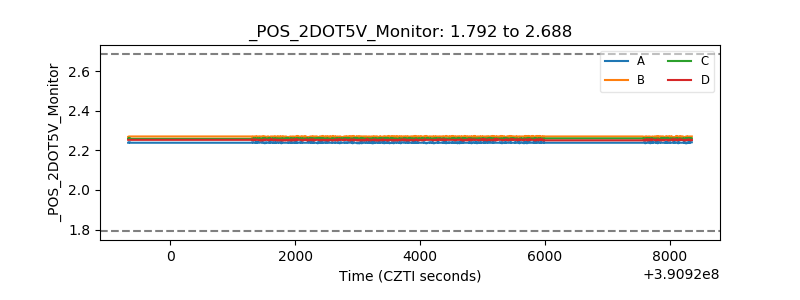 |
| +5 Volts monitor | 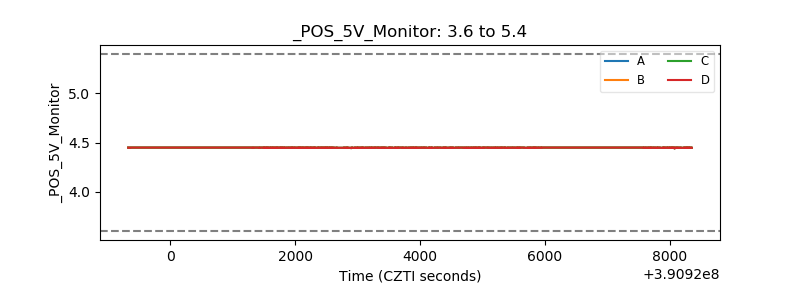 |
| _ROLL_ROT | 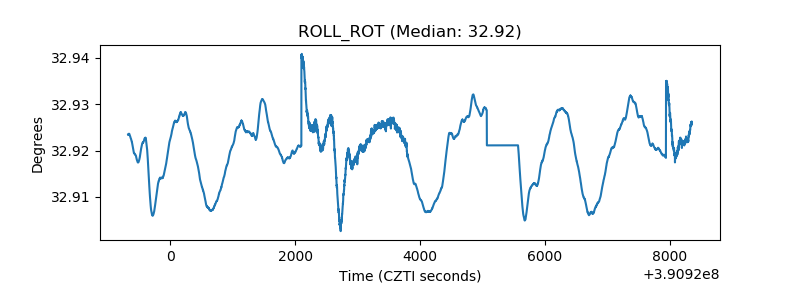 |
| _Roll_DEC | 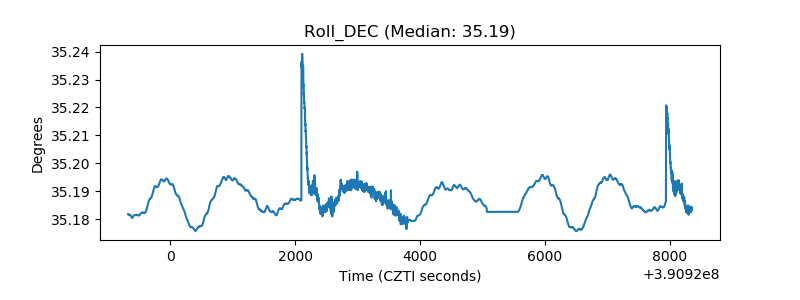 |
| _Roll_RA | 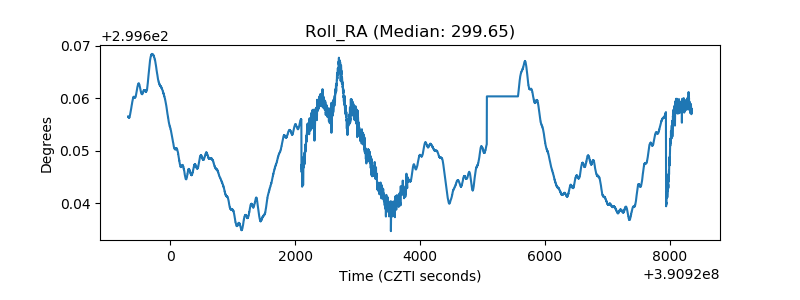 |
| Veto Counter | 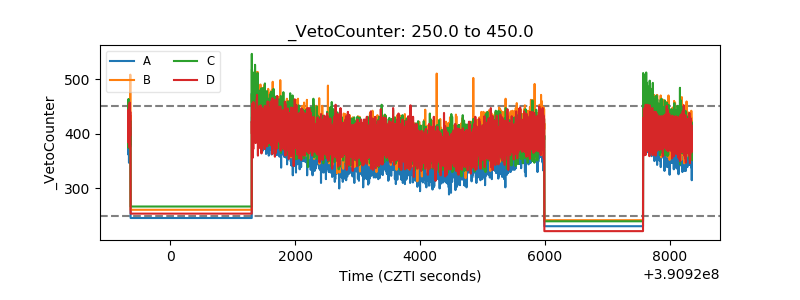 |