| Param | Original file | Final file |
|---|---|---|
| Filename | modeM0/AS1A11_080T01_9000005146_35944cztM0_level2.evt | modeM0/AS1A11_080T01_9000005146_35944cztM0_level2_quad_clean.evt |
| Size (bytes) | 468,020,160 | 54,190,080 |
| Size | 446.3 MB | 51.7 MB |
| Events in quadrant A | 2,782,533 | 339,196 |
| Events in quadrant B | 4,672,638 | 298,188 |
| Events in quadrant C | 2,983,810 | 324,006 |
| Events in quadrant D | 3,383,705 | 316,226 |
| Mode M9 | |||
|---|---|---|---|
| Quadrant | BADHDUFLAG | Total packets | Discarded packets |
| A | 0 | 27 | 0 |
| B | 0 | 27 | 0 |
| C | 0 | 27 | 0 |
| D | 0 | 28 | 0 |
| Mode SS | |||
|---|---|---|---|
| Quadrant | BADHDUFLAG | Total packets | Discarded packets |
| A | 0 | 106 | 0 |
| B | 0 | 106 | 0 |
| C | 0 | 106 | 0 |
| D | 0 | 106 | 0 |
| Mode M0 | |||
|---|---|---|---|
| Quadrant | BADHDUFLAG | Total packets | Discarded packets |
| A | 0 | 11114 | 3 |
| B | 0 | 17153 | 2 |
| C | 0 | 11676 | 2 |
| D | 0 | 13241 | 2 |
| Quadrant | Total seconds | Saturated seconds | Saturation percentage |
|---|---|---|---|
| A | 5176 | 15 | 0.289799% |
| B | 5176 | 785 | 15.166151% |
| C | 5176 | 85 | 1.642195% |
| D | 5176 | 83 | 1.603555% |
Noise dominated data is calculated using 1-second bins in cleaned event files. If a bin has >2000 counts, and if more than 50% of those come from <1% of pixels, then it is considered to be noise-dominated and hence unusable.
| Quadrant | # 1 sec bins | Bins with >0 counts | Bins with >2000 counts | High rate bins dominated by noise | Noise dominated (total time) | Noise dominated (detector-on time) | Marked lightcurve |
|---|---|---|---|---|---|---|---|
| A | 7298 | 5177 | 8 | 8 | 0.11% | 0.15% | 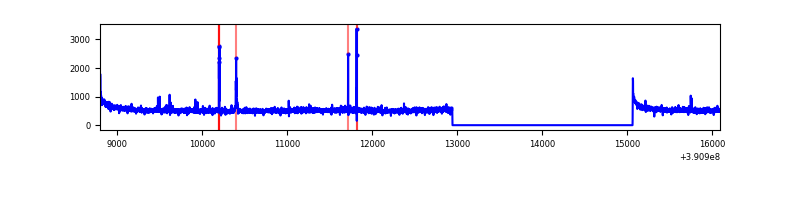 |
| B | 7298 | 5177 | 543 | 543 | 7.44% | 10.49% | 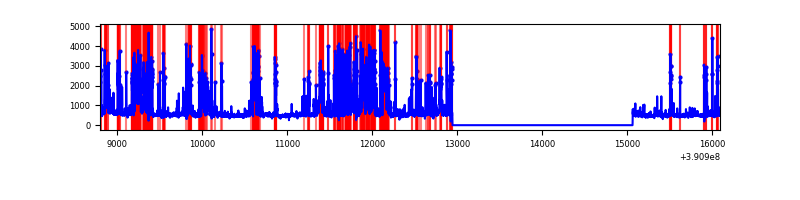 |
| C | 7298 | 5177 | 75 | 75 | 1.03% | 1.45% | 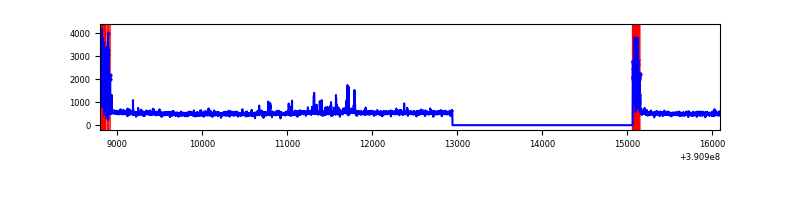 |
| D | 7298 | 5177 | 70 | 70 | 0.96% | 1.35% | 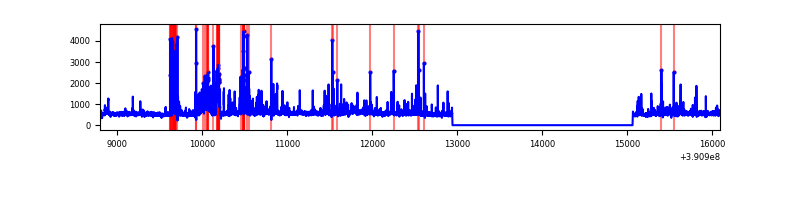 |
Top three noisy pixels from each quadrant. If the there are fewer than three noisy pixels in the level2.evt file, extra rows are filled as -1
| Pixel properties | Quadrant properties | ||||||
|---|---|---|---|---|---|---|---|
| Quadrant | DetID | PixID | Counts | Sigma | Mean | Median | Sigma |
| A | 10 | 83 | 164885 | 1247.71 | 655 | 646 | 131.6 |
| A | 9 | 143 | 49457 | 370.81 | 655 | 646 | 131.6 |
| A | 15 | 169 | 28067 | 208.31 | 655 | 646 | 131.6 |
| B | 5 | 172 | 2130851 | 18715.24 | 596 | 583 | 113.8 |
| B | 4 | 171 | 75437 | 657.62 | 596 | 583 | 113.8 |
| B | 0 | 213 | 57021 | 495.83 | 596 | 583 | 113.8 |
| C | 0 | 10 | 281312 | 1979.29 | 617 | 622 | 141.8 |
| C | 15 | 214 | 218277 | 1534.8 | 617 | 622 | 141.8 |
| C | 0 | 207 | 57271 | 399.46 | 617 | 622 | 141.8 |
| D | 8 | 195 | 286800 | 1901.1 | 623 | 609 | 150.5 |
| D | 2 | 250 | 158457 | 1048.55 | 623 | 609 | 150.5 |
| D | 12 | 227 | 153084 | 1012.86 | 623 | 609 | 150.5 |
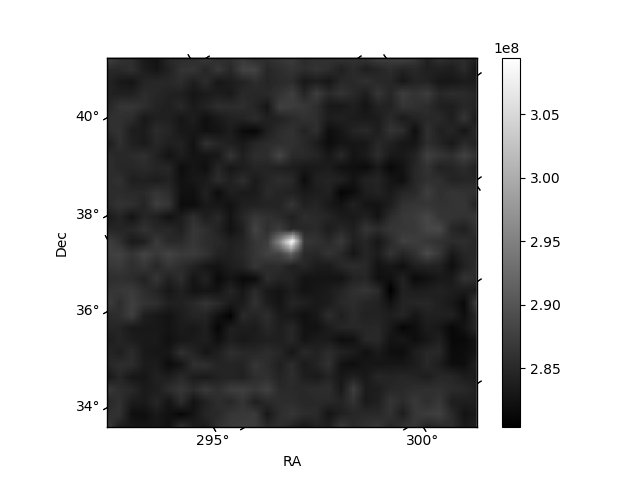
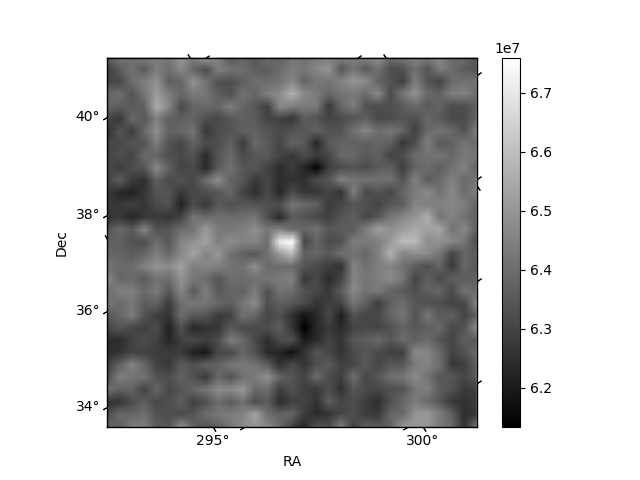
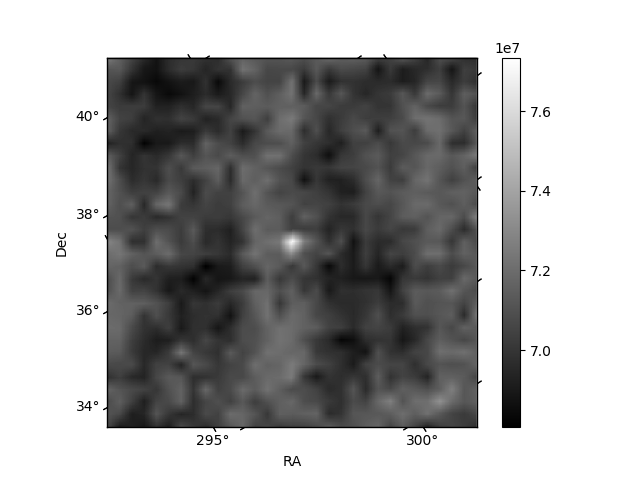
Histogram calculated using DETX and DETY for each event in the final _common_clean file
| Quadrant A | 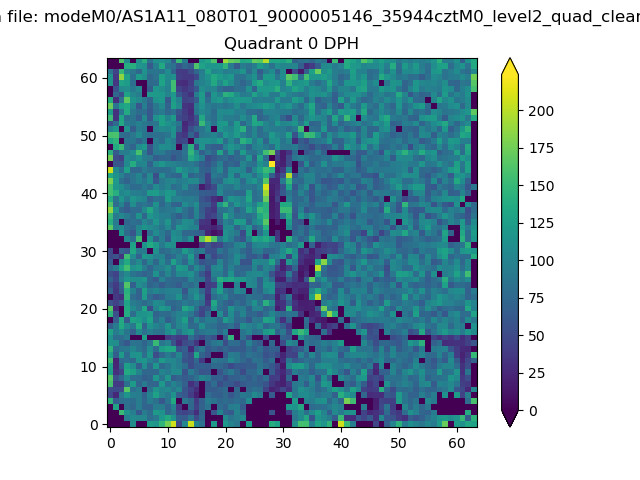 |
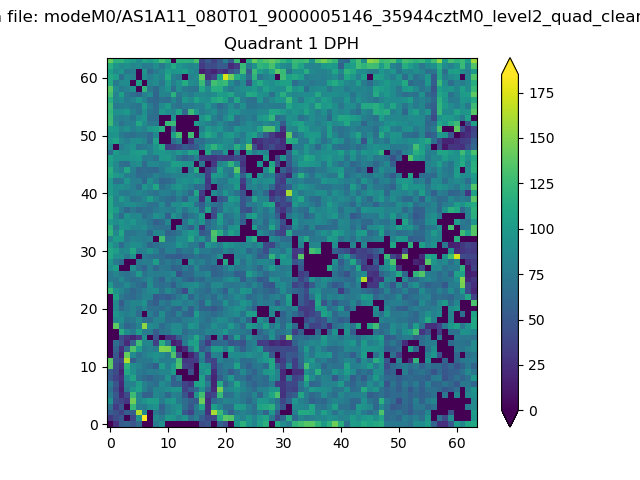 |
Quadrant B |
|---|---|---|---|
| Quadrant D | 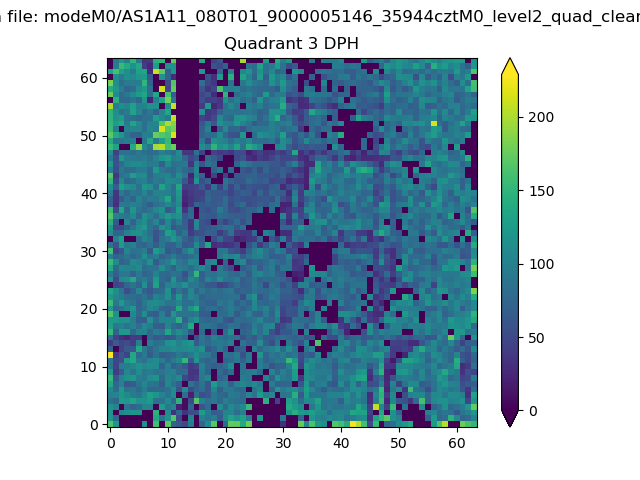 |
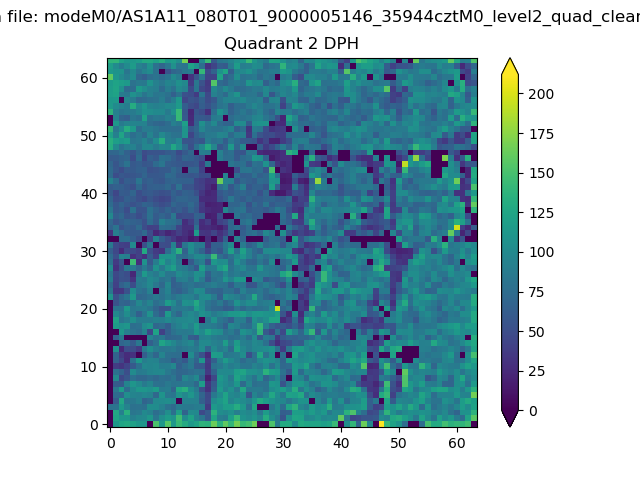 |
Quadrant C |
| Plot type | Count rate plots | Images |
|---|---|---|
| Comparison with Poisson distribution Blue bars denote a histogram of data divided into 1 sec bins. Red curve is a Poisson curve with rate = median count rate of data. |
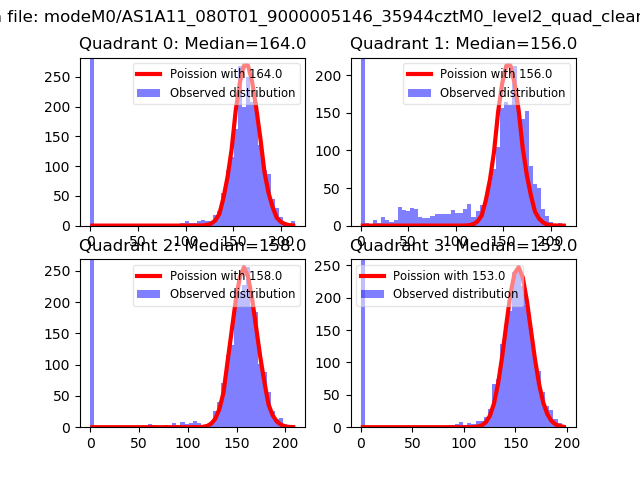 |
 |
| Quadrant-wise count rates Data is divided into 100 sec bins |
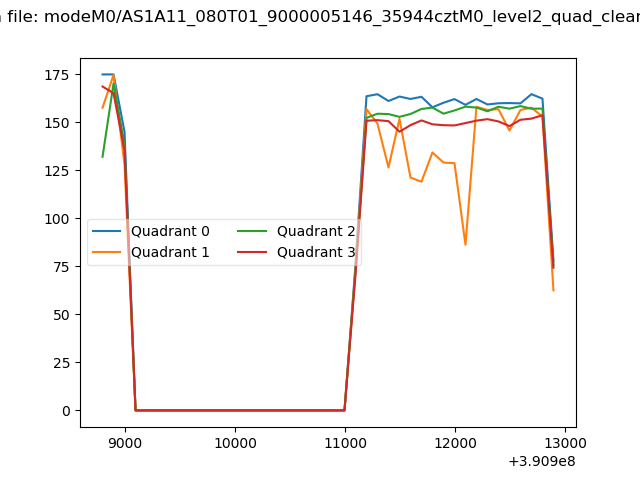 |
|
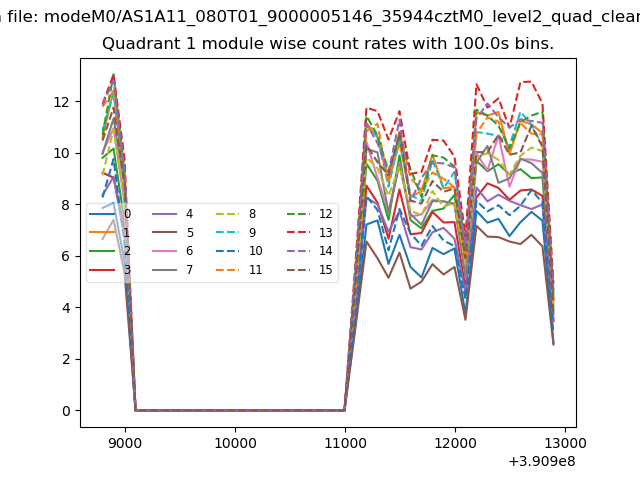
| Module-wise count rates for Quadrant A Data is divided into 100 sec bins |
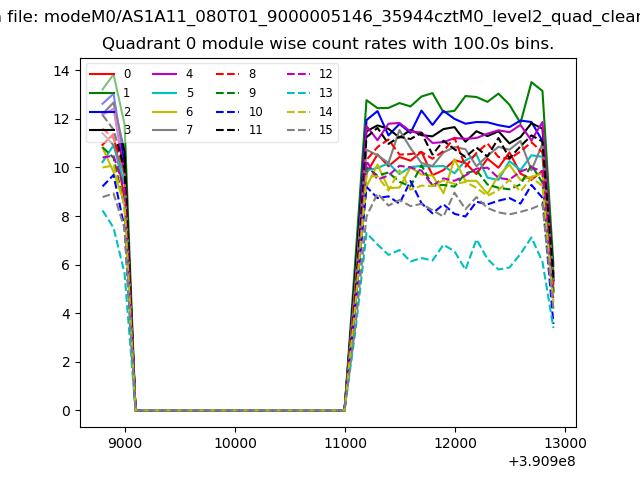 |
 |
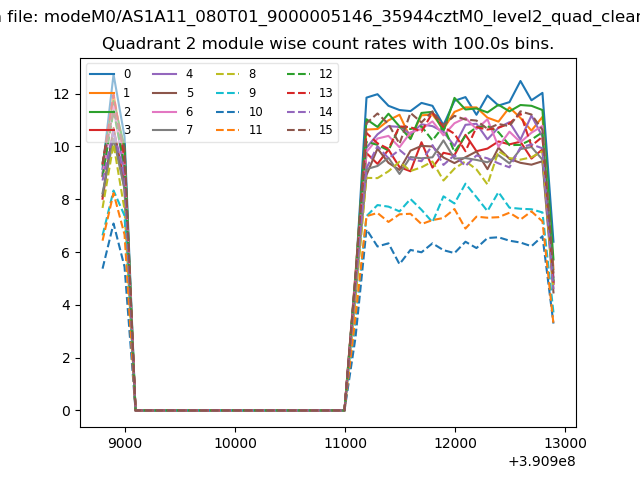
| Module-wise count rates for Quadrant B Data is divided into 100 sec bins |
 |
 |
| Module-wise count rates for Quadrant C Data is divided into 100 sec bins |
 |
 |
| Module-wise count rates for Quadrant D Data is divided into 100 sec bins |
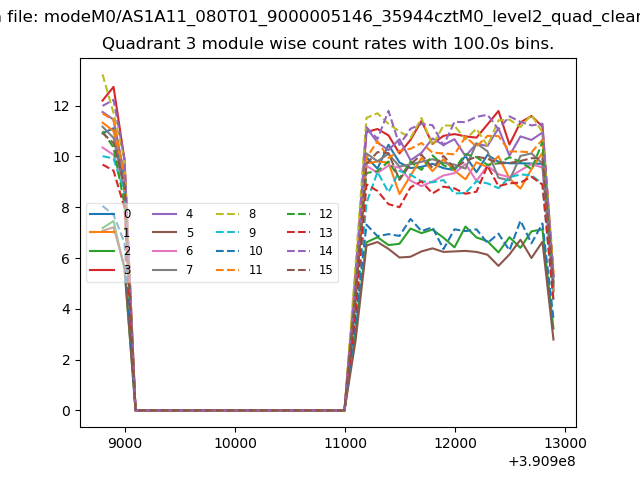 |
 |
| Parameter | Plot |
|---|---|
| CZT HV Monitor |  |
| D_VDD | 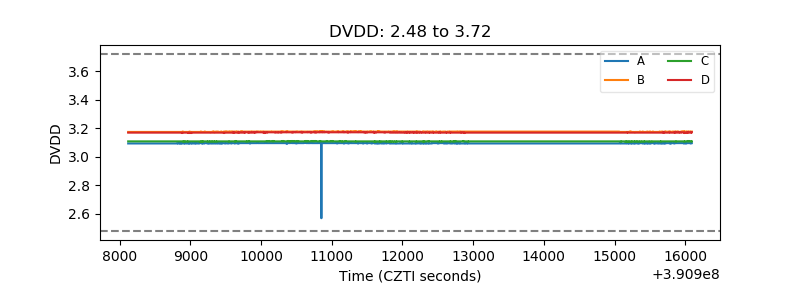 |
| Temperature 1 | 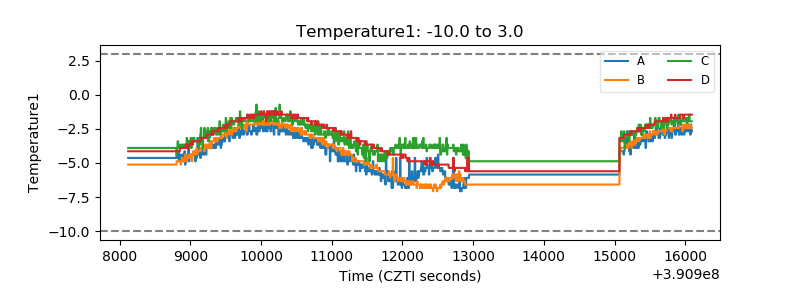 |
| Veto HV Monitor | 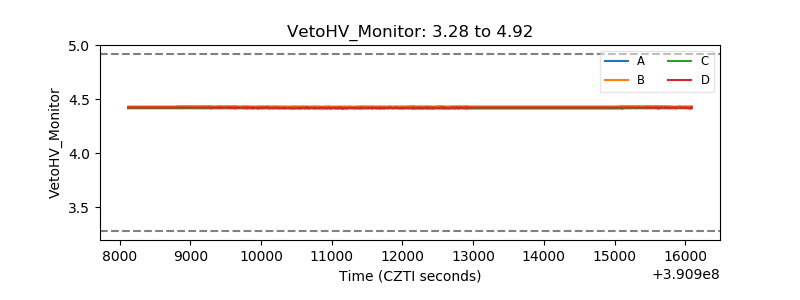 |
| Veto LLD | 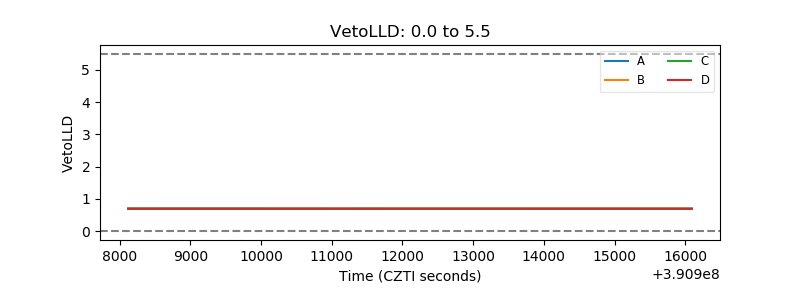 |
| Alpha Counter | 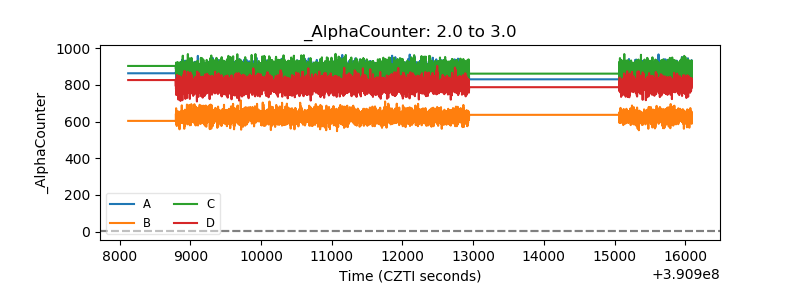 |
| _CPM_Rate | 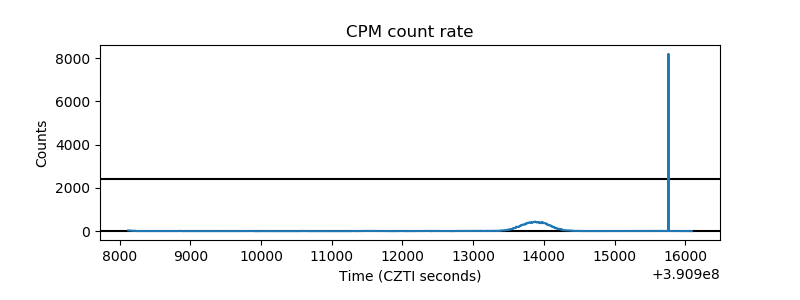 |
| CZT Counter | 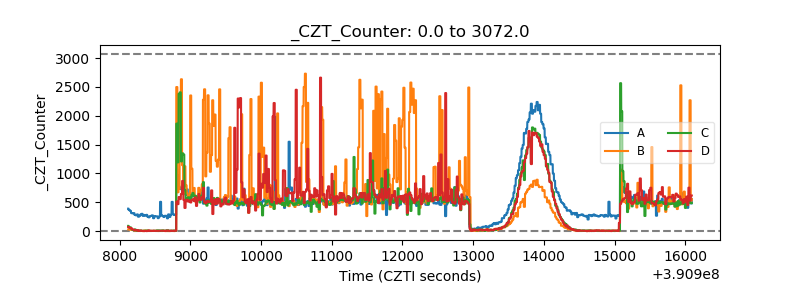 |
| +2.5 Volts monitor | 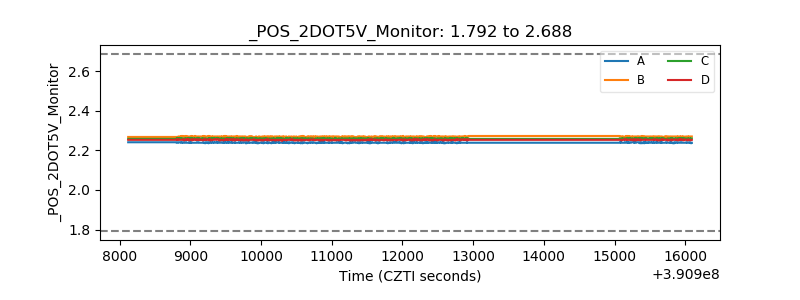 |
| +5 Volts monitor | 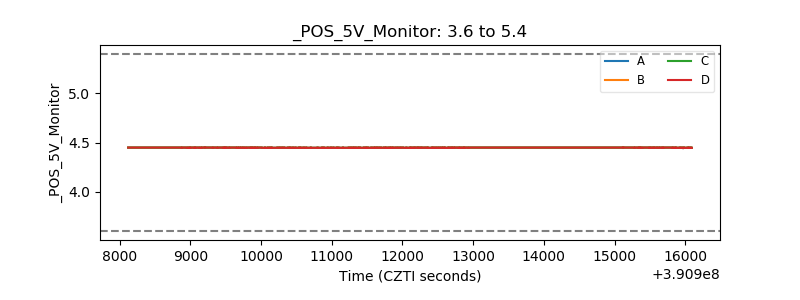 |
| _ROLL_ROT | 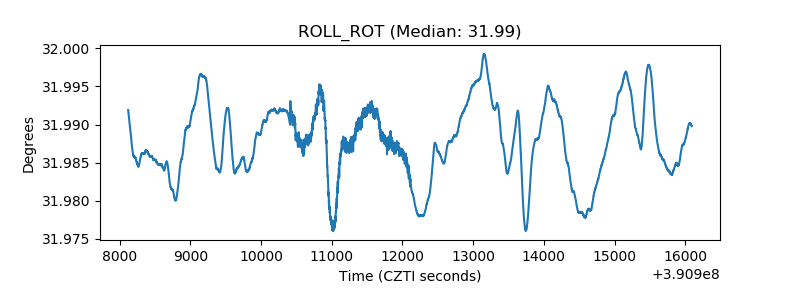 |
| _Roll_DEC | 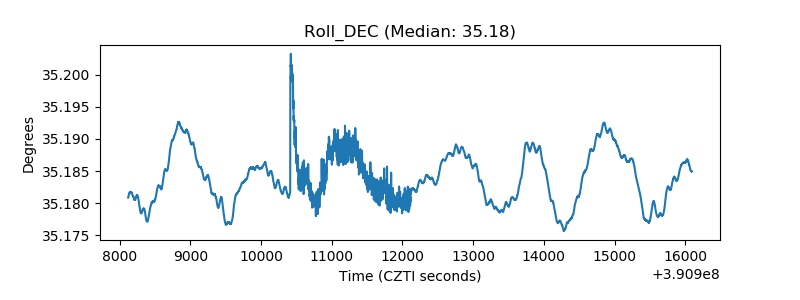 |
| _Roll_RA | 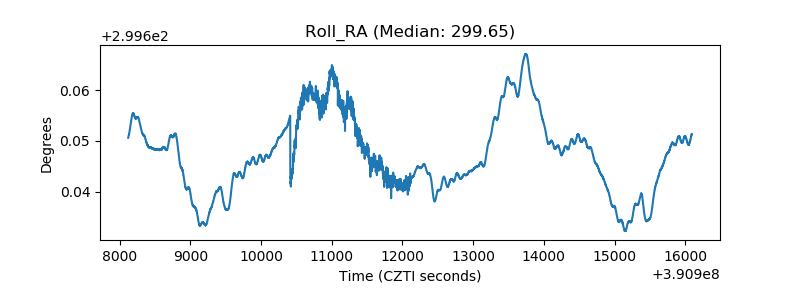 |
| Veto Counter |  |