| Param | Original file | Final file |
|---|---|---|
| Filename | modeM0/AS1A11_080T01_9000005146_35942cztM0_level2.evt | modeM0/AS1A11_080T01_9000005146_35942cztM0_level2_quad_clean.evt |
| Size (bytes) | 444,804,480 | 75,942,720 |
| Size | 424.2 MB | 72.4 MB |
| Events in quadrant A | 3,018,511 | 500,480 |
| Events in quadrant B | 3,516,511 | 496,348 |
| Events in quadrant C | 2,991,137 | 478,999 |
| Events in quadrant D | 3,590,768 | 458,399 |
| Mode M9 | |||
|---|---|---|---|
| Quadrant | BADHDUFLAG | Total packets | Discarded packets |
| A | 0 | 30 | 0 |
| B | 0 | 30 | 0 |
| C | 0 | 30 | 0 |
| D | 0 | 31 | 0 |
| Mode SS | |||
|---|---|---|---|
| Quadrant | BADHDUFLAG | Total packets | Discarded packets |
| A | 0 | 106 | 0 |
| B | 0 | 106 | 0 |
| C | 0 | 106 | 0 |
| D | 0 | 106 | 0 |
| Mode M0 | |||
|---|---|---|---|
| Quadrant | BADHDUFLAG | Total packets | Discarded packets |
| A | 0 | 12033 | 3 |
| B | 0 | 13613 | 2 |
| C | 0 | 11804 | 2 |
| D | 0 | 14069 | 2 |
| Quadrant | Total seconds | Saturated seconds | Saturation percentage |
|---|---|---|---|
| A | 5217 | 22 | 0.421698% |
| B | 5217 | 213 | 4.082806% |
| C | 5217 | 72 | 1.380104% |
| D | 5217 | 125 | 2.396013% |
Noise dominated data is calculated using 1-second bins in cleaned event files. If a bin has >2000 counts, and if more than 50% of those come from <1% of pixels, then it is considered to be noise-dominated and hence unusable.
| Quadrant | # 1 sec bins | Bins with >0 counts | Bins with >2000 counts | High rate bins dominated by noise | Noise dominated (total time) | Noise dominated (detector-on time) | Marked lightcurve |
|---|---|---|---|---|---|---|---|
| A | 7279 | 5218 | 7 | 7 | 0.10% | 0.13% | 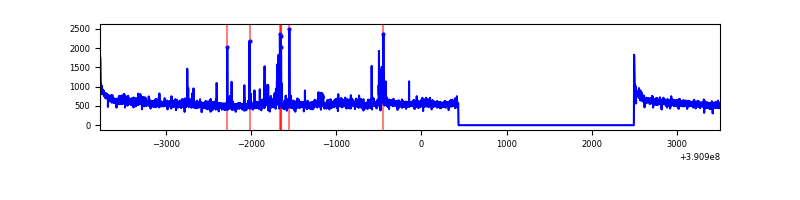 |
| B | 7279 | 5218 | 125 | 125 | 1.72% | 2.40% |  |
| C | 7279 | 5218 | 54 | 54 | 0.74% | 1.03% | 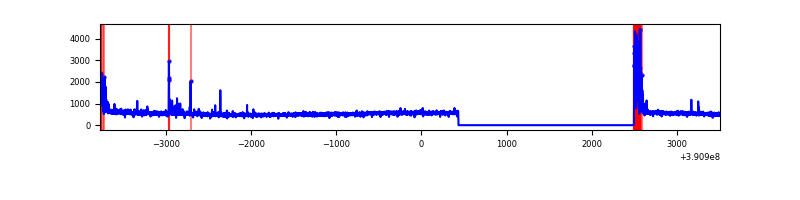 |
| D | 7279 | 5218 | 98 | 98 | 1.35% | 1.88% | 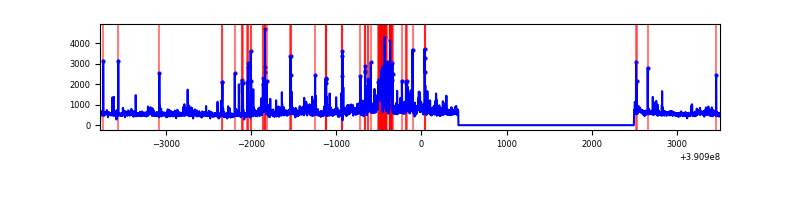 |
Top three noisy pixels from each quadrant. If the there are fewer than three noisy pixels in the level2.evt file, extra rows are filled as -1
| Pixel properties | Quadrant properties | ||||||
|---|---|---|---|---|---|---|---|
| Quadrant | DetID | PixID | Counts | Sigma | Mean | Median | Sigma |
| A | 15 | 169 | 166431 | 1207.17 | 683 | 673 | 137.3 |
| A | 10 | 83 | 164695 | 1194.53 | 683 | 673 | 137.3 |
| A | 9 | 143 | 37080 | 265.14 | 683 | 673 | 137.3 |
| B | 5 | 172 | 479733 | 3828.75 | 662 | 650 | 125.1 |
| B | 4 | 171 | 261714 | 2086.38 | 662 | 650 | 125.1 |
| B | 0 | 213 | 59071 | 466.89 | 662 | 650 | 125.1 |
| C | 0 | 10 | 227824 | 1535.82 | 640 | 647 | 147.9 |
| C | 15 | 214 | 219372 | 1478.68 | 640 | 647 | 147.9 |
| C | 0 | 207 | 40318 | 268.19 | 640 | 647 | 147.9 |
| D | 8 | 195 | 397172 | 2484.19 | 649 | 631 | 159.6 |
| D | 13 | 249 | 183065 | 1142.89 | 649 | 631 | 159.6 |
| D | 1 | 52 | 177544 | 1108.3 | 649 | 631 | 159.6 |
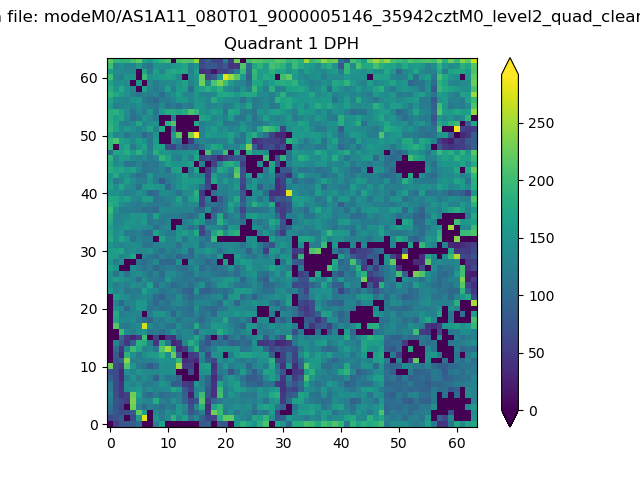
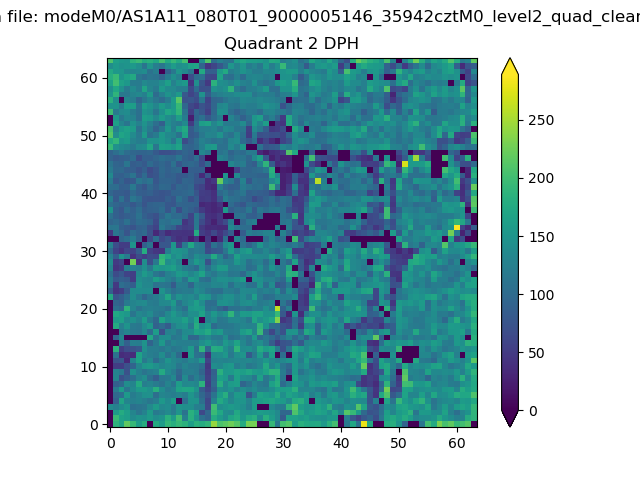
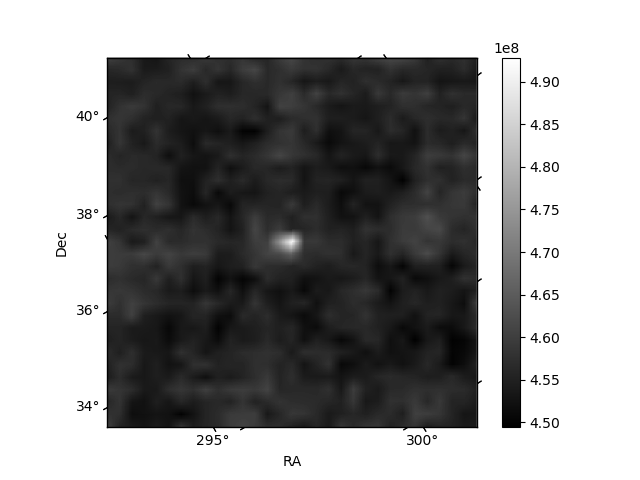
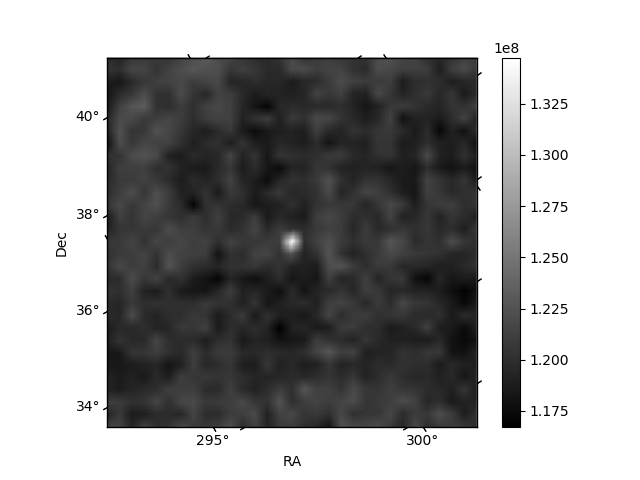
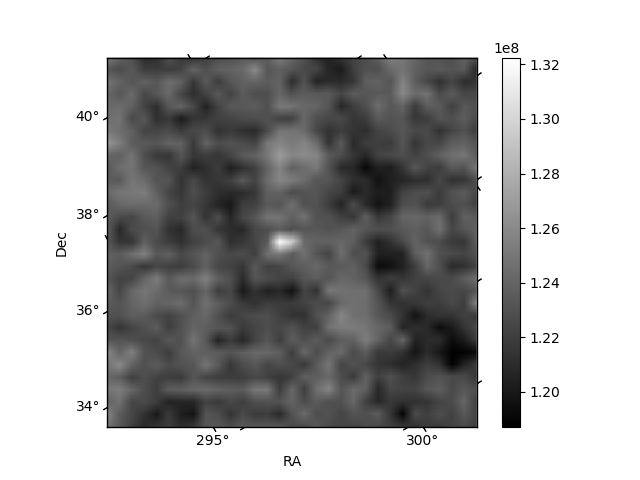
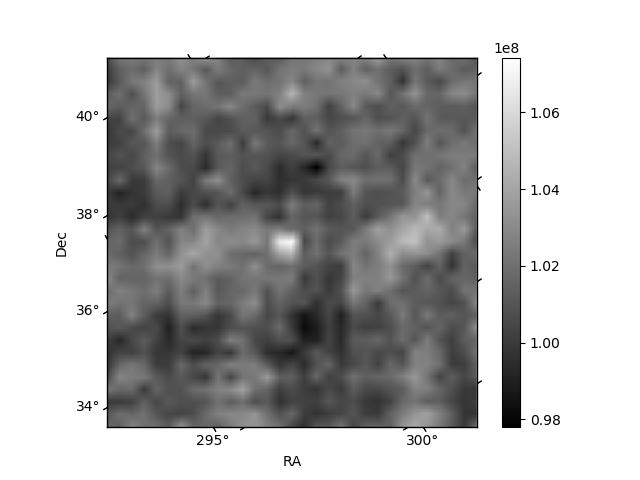
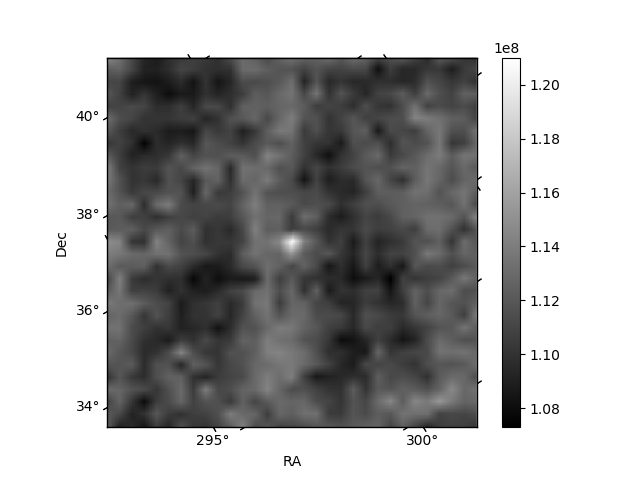
Histogram calculated using DETX and DETY for each event in the final _common_clean file
| Quadrant A | 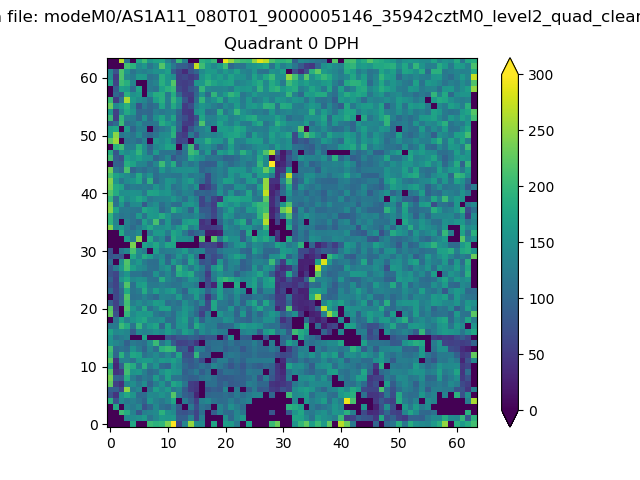 |
 |
Quadrant B |
|---|---|---|---|
| Quadrant D | 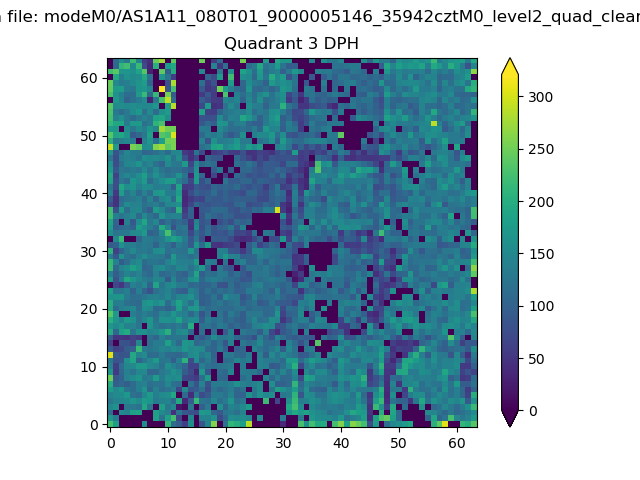 |
 |
Quadrant C |
| Plot type | Count rate plots | Images |
|---|---|---|
| Comparison with Poisson distribution Blue bars denote a histogram of data divided into 1 sec bins. Red curve is a Poisson curve with rate = median count rate of data. |
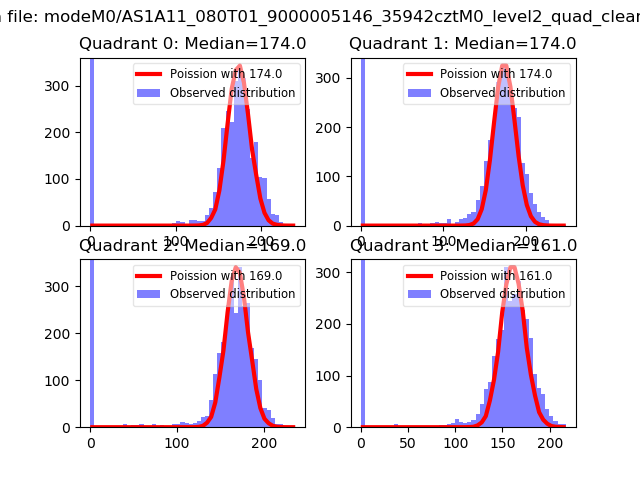 |
 |
| Quadrant-wise count rates Data is divided into 100 sec bins |
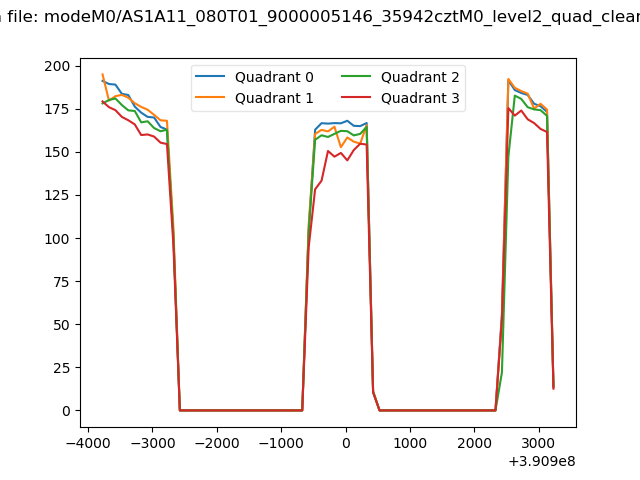 |
|
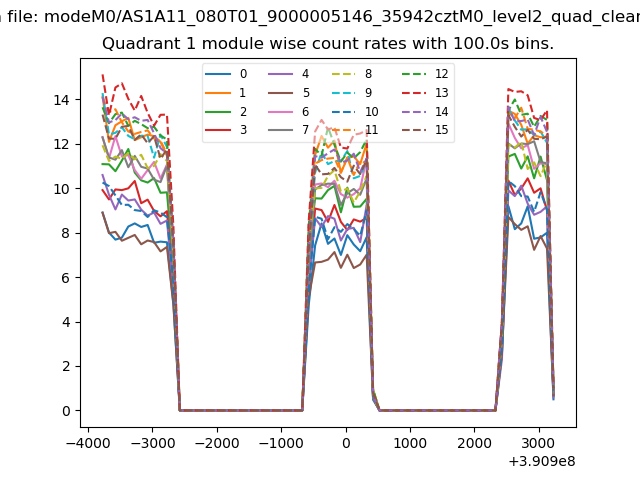
| Module-wise count rates for Quadrant A Data is divided into 100 sec bins |
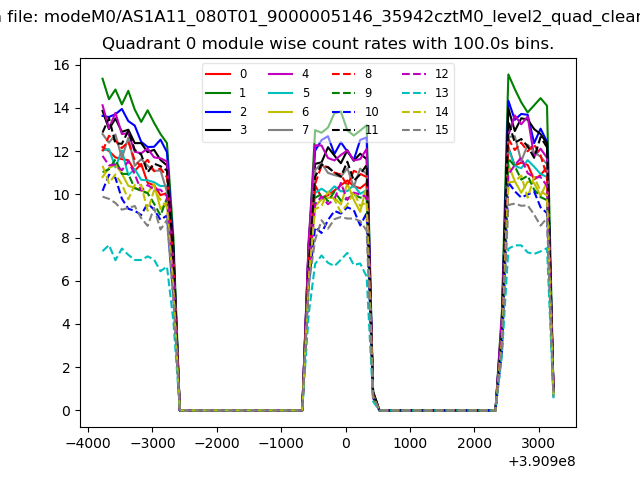 |
 |
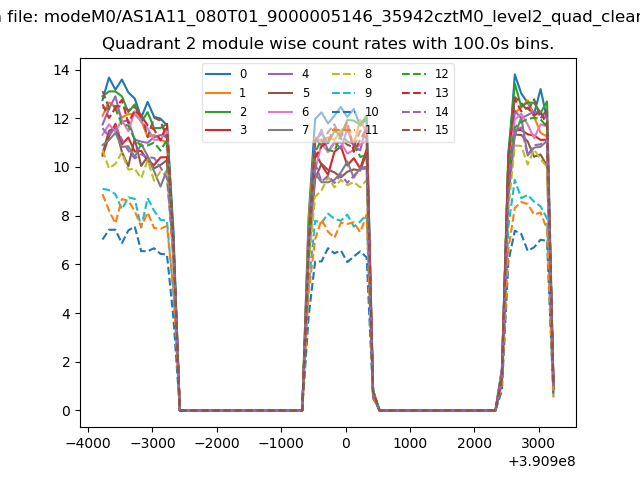
| Module-wise count rates for Quadrant B Data is divided into 100 sec bins |
 |
 |
| Module-wise count rates for Quadrant C Data is divided into 100 sec bins |
 |
 |
| Module-wise count rates for Quadrant D Data is divided into 100 sec bins |
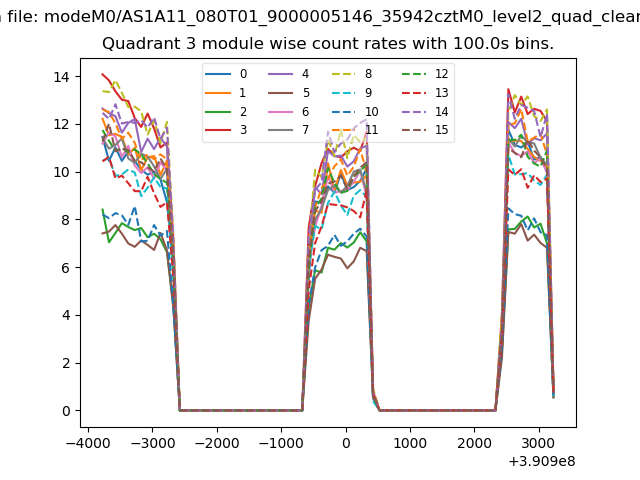 |
 |
| Parameter | Plot |
|---|---|
| CZT HV Monitor | 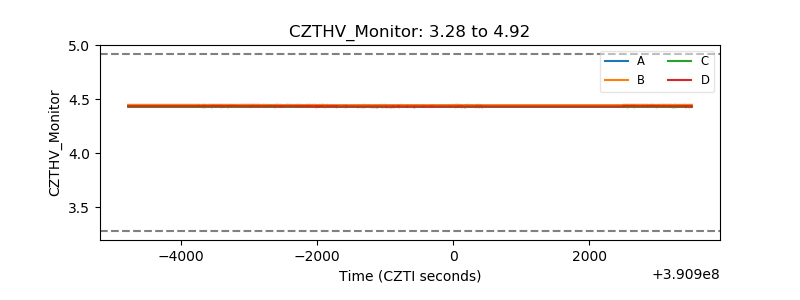 |
| D_VDD | 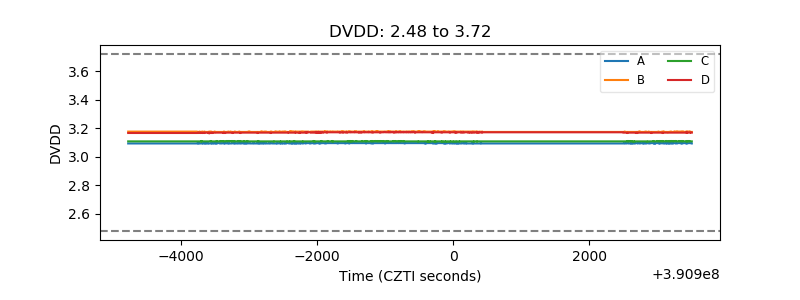 |
| Temperature 1 |  |
| Veto HV Monitor | 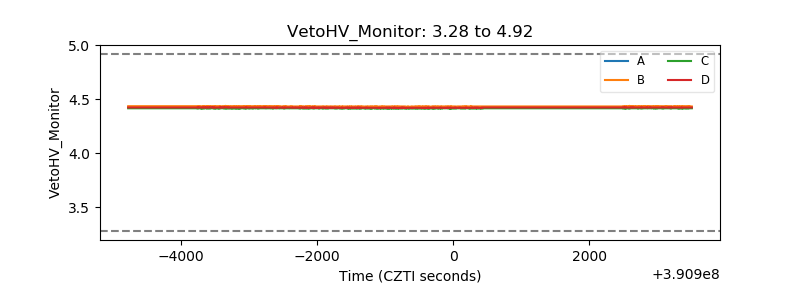 |
| Veto LLD | 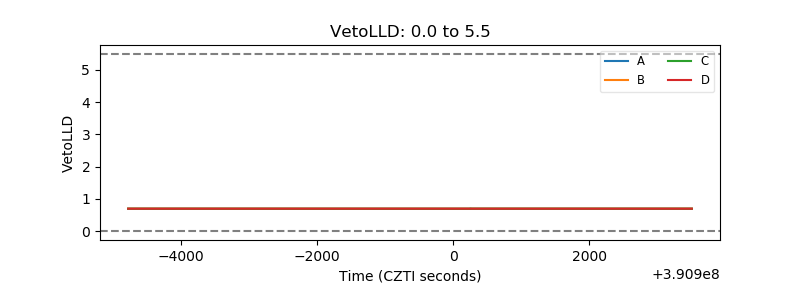 |
| Alpha Counter | 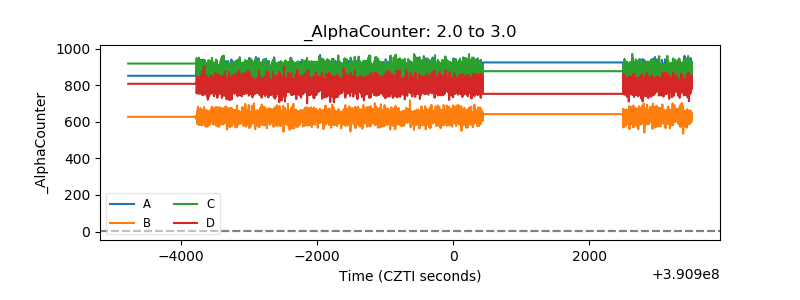 |
| _CPM_Rate | 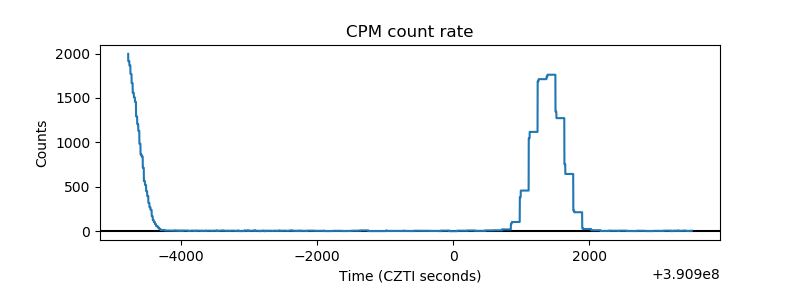 |
| CZT Counter | 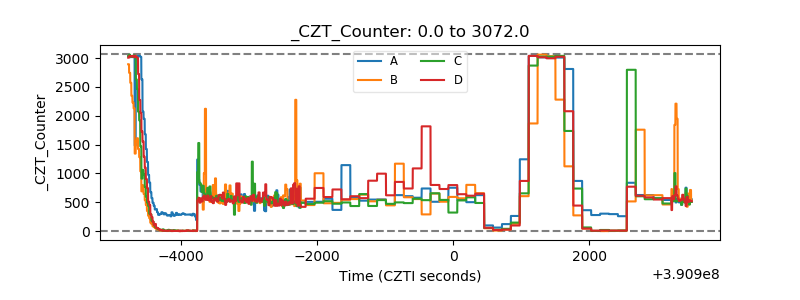 |
| +2.5 Volts monitor | 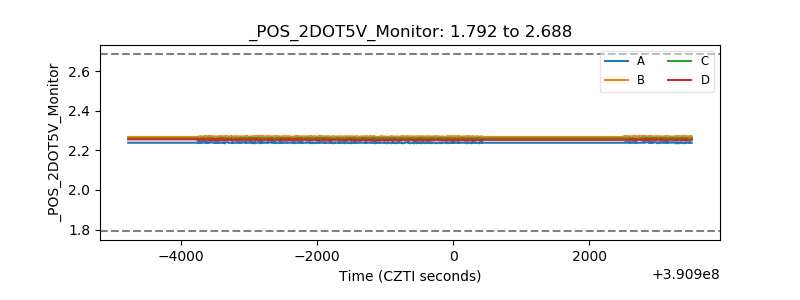 |
| +5 Volts monitor | 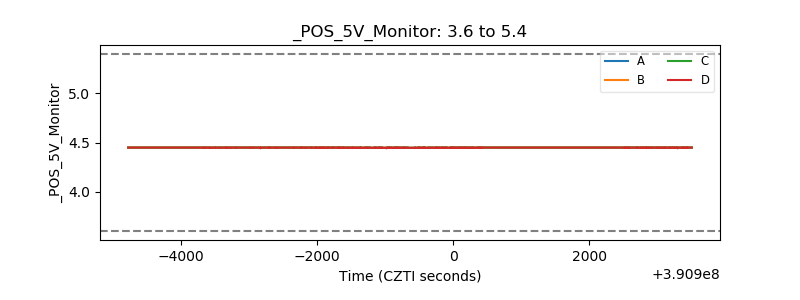 |
| _ROLL_ROT | 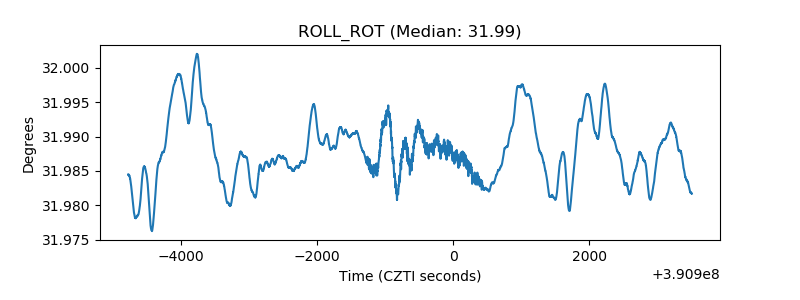 |
| _Roll_DEC | 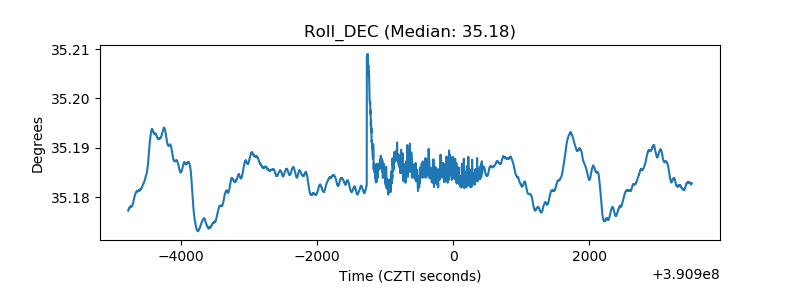 |
| _Roll_RA | 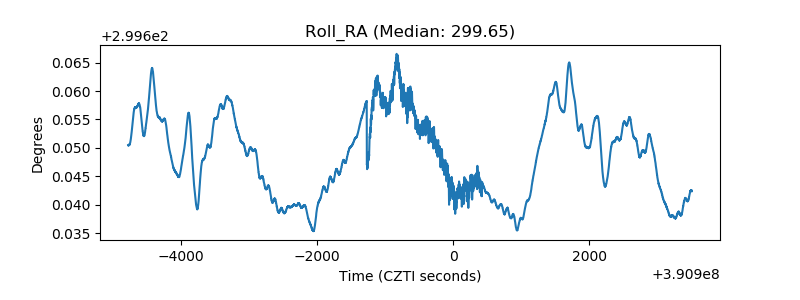 |
| Veto Counter | 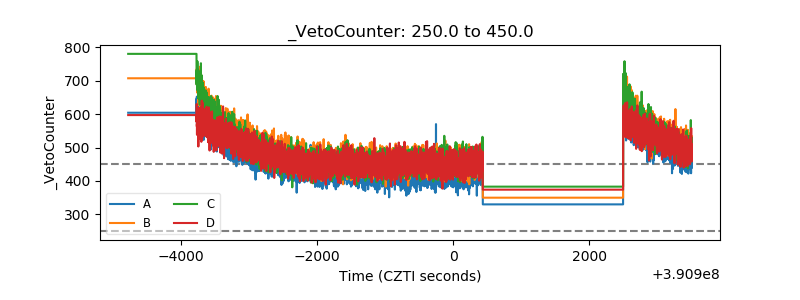 |