| Param | Original file | Final file |
|---|---|---|
| Filename | modeM0/AS1A11_080T01_9000005146_35933cztM0_level2.evt | modeM0/AS1A11_080T01_9000005146_35933cztM0_level2_quad_clean.evt |
| Size (bytes) | 541,592,640 | 98,671,680 |
| Size | 516.5 MB | 94.1 MB |
| Events in quadrant A | 3,352,469 | 655,199 |
| Events in quadrant B | 5,291,993 | 635,392 |
| Events in quadrant C | 3,428,163 | 653,989 |
| Events in quadrant D | 3,916,828 | 618,634 |
| Mode M9 | |||
|---|---|---|---|
| Quadrant | BADHDUFLAG | Total packets | Discarded packets |
| A | 0 | 27 | 0 |
| B | 0 | 27 | 0 |
| C | 0 | 27 | 0 |
| D | 0 | 27 | 0 |
| Mode SS | |||
|---|---|---|---|
| Quadrant | BADHDUFLAG | Total packets | Discarded packets |
| A | 0 | 128 | 0 |
| B | 0 | 128 | 0 |
| C | 0 | 128 | 0 |
| D | 0 | 128 | 0 |
| Mode M0 | |||
|---|---|---|---|
| Quadrant | BADHDUFLAG | Total packets | Discarded packets |
| A | 0 | 13675 | 3 |
| B | 0 | 19603 | 2 |
| C | 0 | 13631 | 2 |
| D | 0 | 15645 | 2 |
| Quadrant | Total seconds | Saturated seconds | Saturation percentage |
|---|---|---|---|
| A | 6078 | 138 | 2.270484% |
| B | 6078 | 904 | 14.873314% |
| C | 6078 | 129 | 2.122409% |
| D | 6078 | 115 | 1.892070% |
Noise dominated data is calculated using 1-second bins in cleaned event files. If a bin has >2000 counts, and if more than 50% of those come from <1% of pixels, then it is considered to be noise-dominated and hence unusable.
| Quadrant | # 1 sec bins | Bins with >0 counts | Bins with >2000 counts | High rate bins dominated by noise | Noise dominated (total time) | Noise dominated (detector-on time) | Marked lightcurve |
|---|---|---|---|---|---|---|---|
| A | 8853 | 6080 | 103 | 103 | 1.16% | 1.69% | 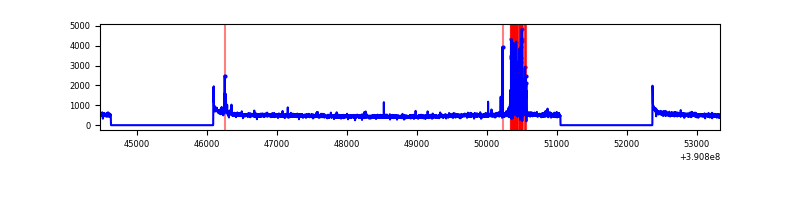 |
| B | 8853 | 6080 | 709 | 709 | 8.01% | 11.66% | 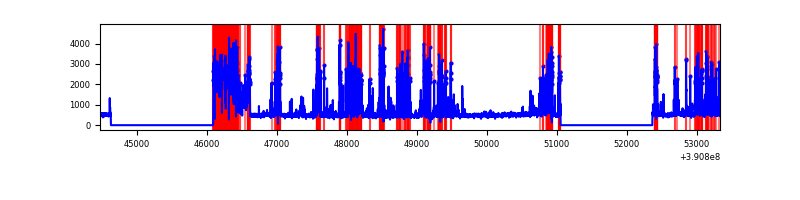 |
| C | 8853 | 6080 | 94 | 94 | 1.06% | 1.55% | 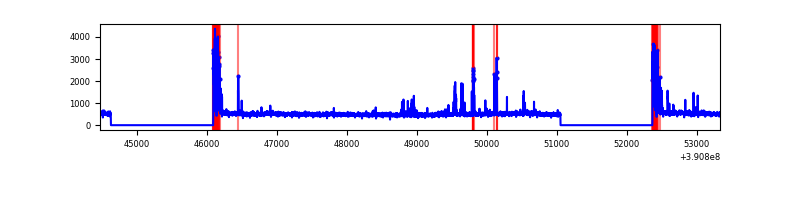 |
| D | 8853 | 6080 | 83 | 83 | 0.94% | 1.37% | 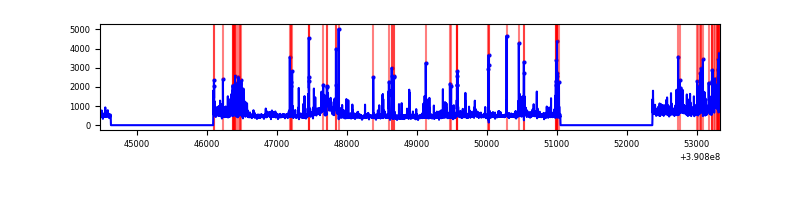 |
Top three noisy pixels from each quadrant. If the there are fewer than three noisy pixels in the level2.evt file, extra rows are filled as -1
| Pixel properties | Quadrant properties | ||||||
|---|---|---|---|---|---|---|---|
| Quadrant | DetID | PixID | Counts | Sigma | Mean | Median | Sigma |
| A | 9 | 143 | 340386 | 2319.06 | 716 | 703 | 146.5 |
| A | 10 | 83 | 177457 | 1206.72 | 716 | 703 | 146.5 |
| A | 15 | 169 | 50883 | 342.59 | 716 | 703 | 146.5 |
| B | 5 | 172 | 2544704 | 19861.63 | 658 | 642 | 128.1 |
| B | 5 | 255 | 119107 | 924.86 | 658 | 642 | 128.1 |
| B | 12 | 111 | 15406 | 115.26 | 658 | 642 | 128.1 |
| C | 0 | 10 | 337773 | 2045.92 | 698 | 706 | 164.8 |
| C | 15 | 214 | 250567 | 1516.6 | 698 | 706 | 164.8 |
| C | 0 | 207 | 117109 | 706.54 | 698 | 706 | 164.8 |
| D | 10 | 118 | 279531 | 1606.84 | 700 | 682 | 173.5 |
| D | 8 | 195 | 272828 | 1568.21 | 700 | 682 | 173.5 |
| D | 1 | 52 | 270214 | 1553.15 | 700 | 682 | 173.5 |
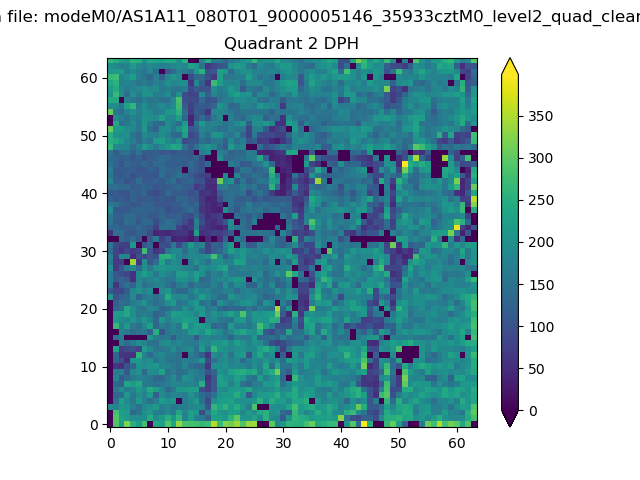
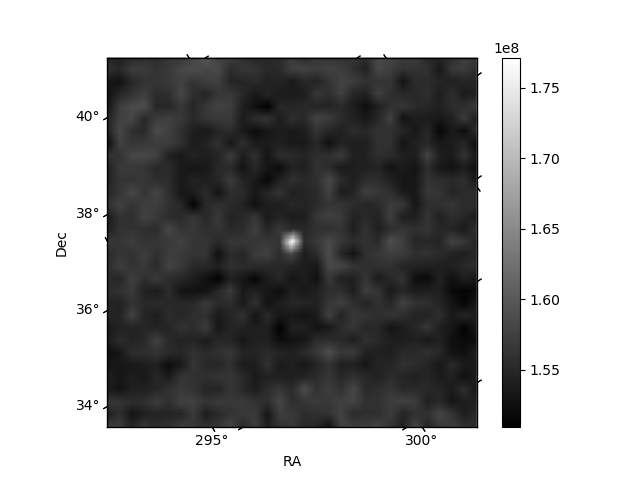
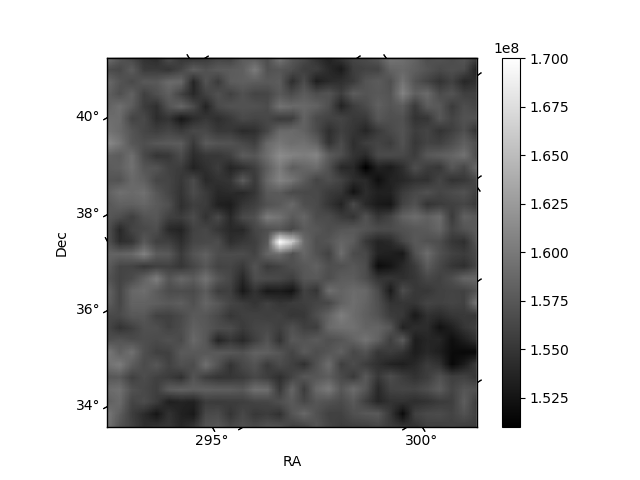
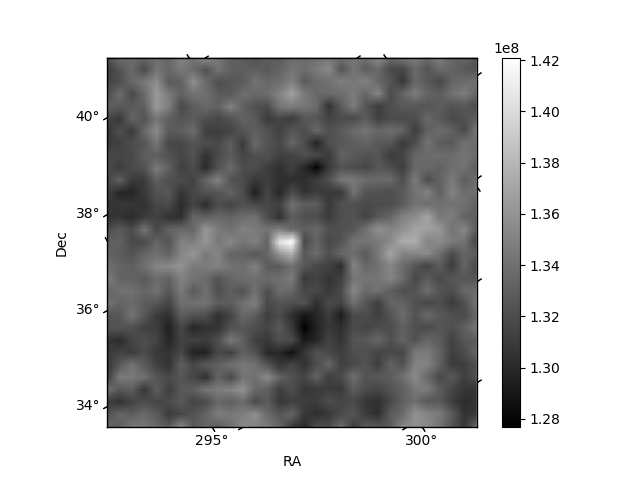
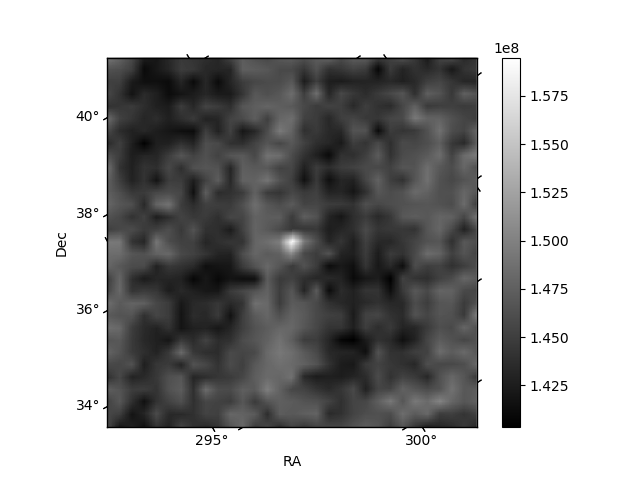
Histogram calculated using DETX and DETY for each event in the final _common_clean file
| Quadrant A | 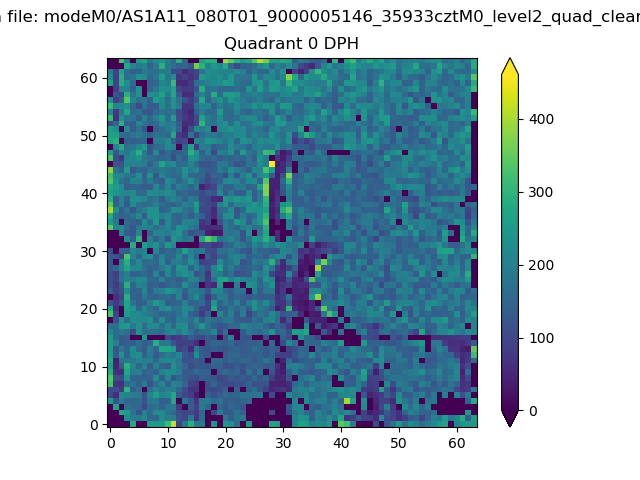 |
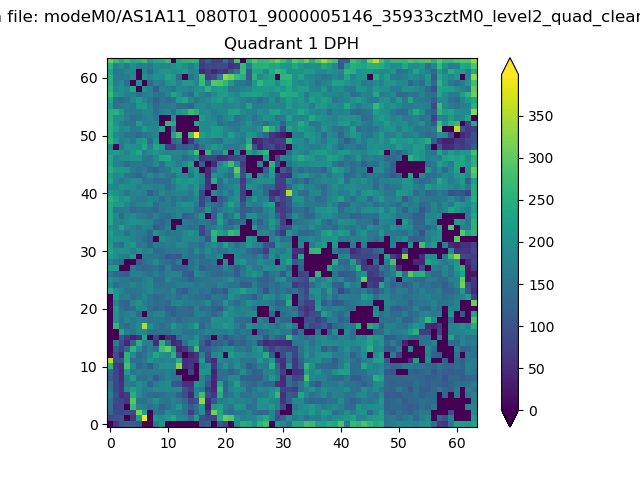 |
Quadrant B |
|---|---|---|---|
| Quadrant D | 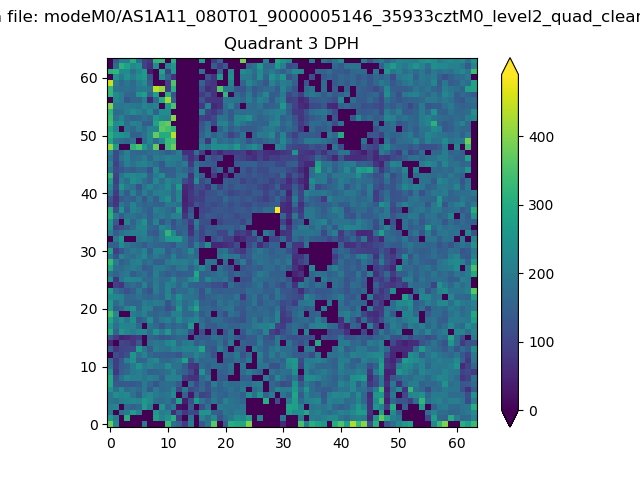 |
 |
Quadrant C |
| Plot type | Count rate plots | Images |
|---|---|---|
| Comparison with Poisson distribution Blue bars denote a histogram of data divided into 1 sec bins. Red curve is a Poisson curve with rate = median count rate of data. |
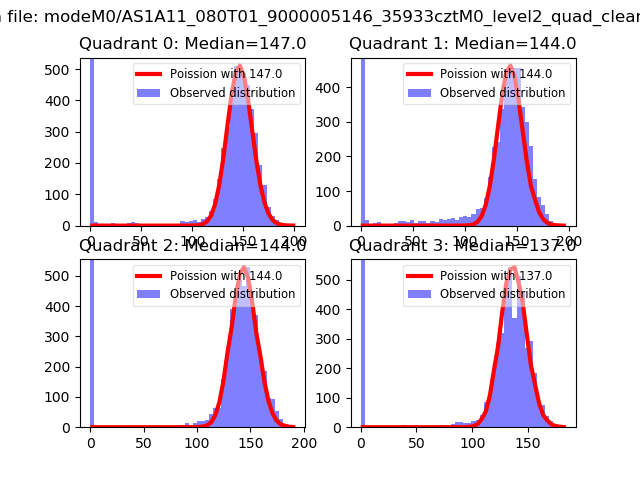 |
 |
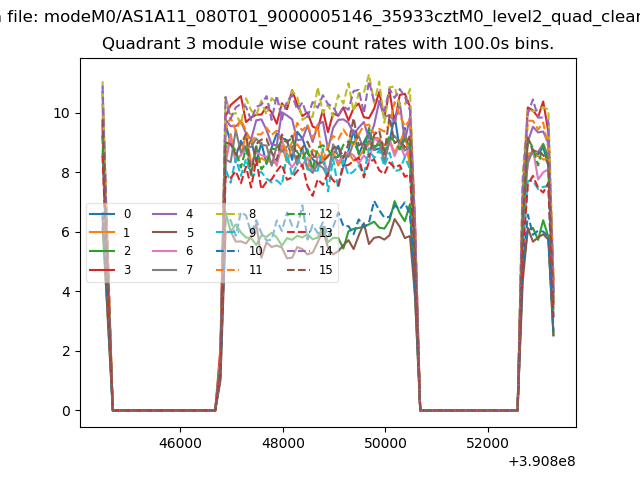
| Quadrant-wise count rates Data is divided into 100 sec bins |
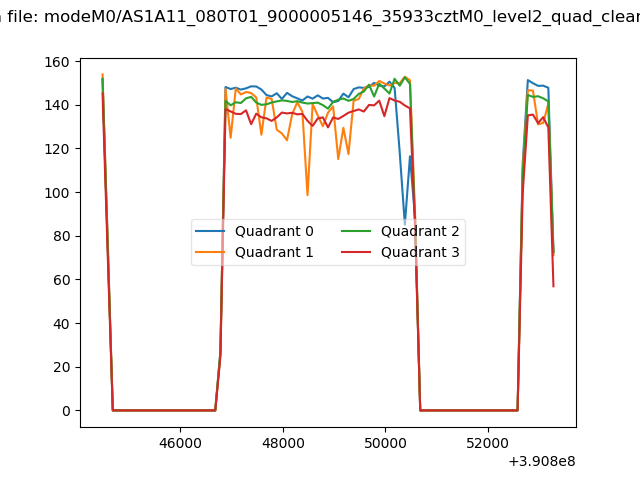 |
|
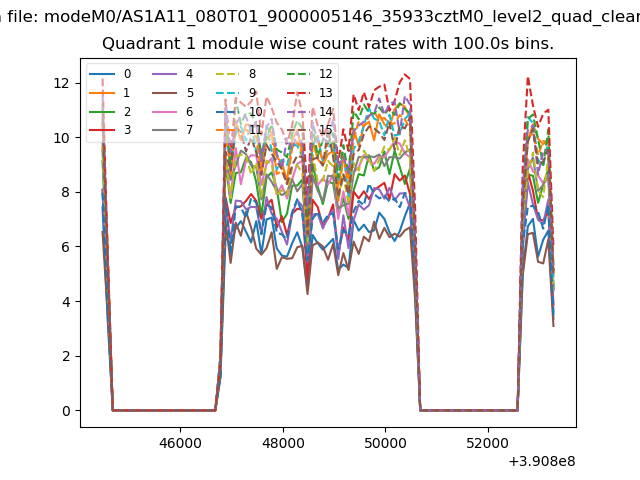
| Module-wise count rates for Quadrant A Data is divided into 100 sec bins |
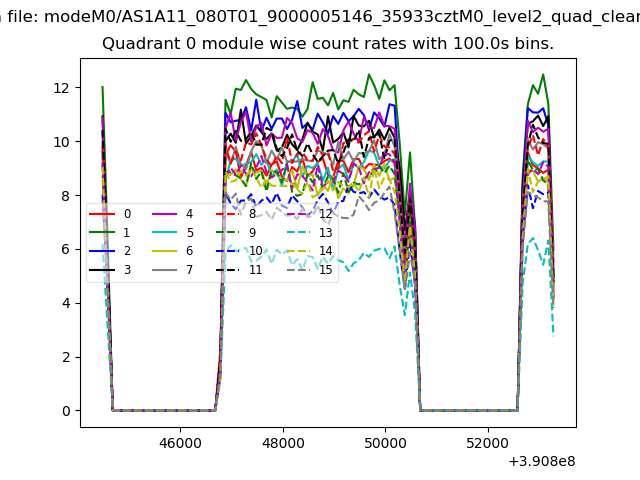 |
 |
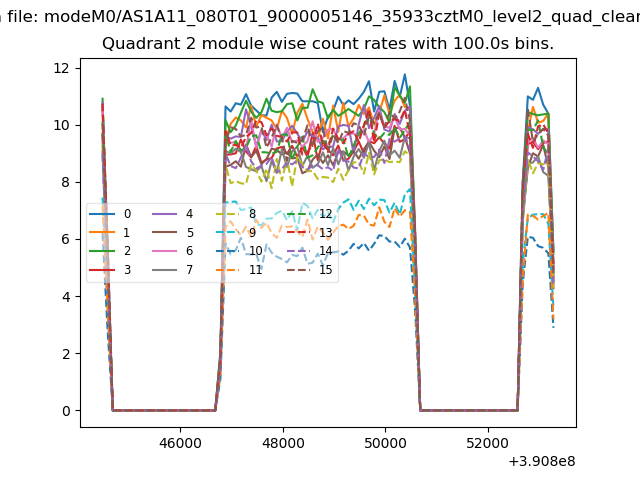
| Module-wise count rates for Quadrant B Data is divided into 100 sec bins |
 |
 |
| Module-wise count rates for Quadrant C Data is divided into 100 sec bins |
 |
 |
| Module-wise count rates for Quadrant D Data is divided into 100 sec bins |
 |
 |
| Parameter | Plot |
|---|---|
| CZT HV Monitor | 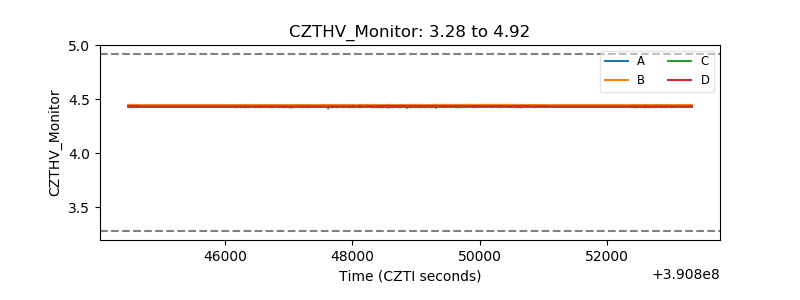 |
| D_VDD | 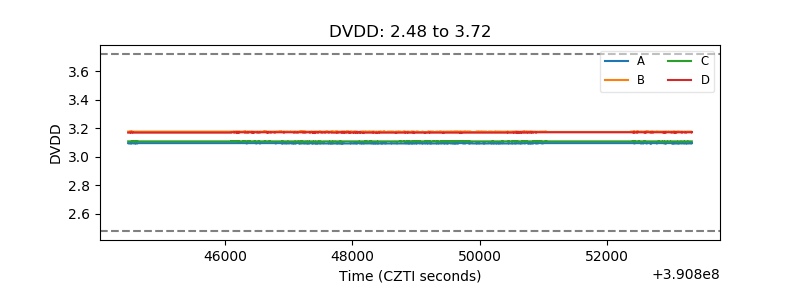 |
| Temperature 1 | 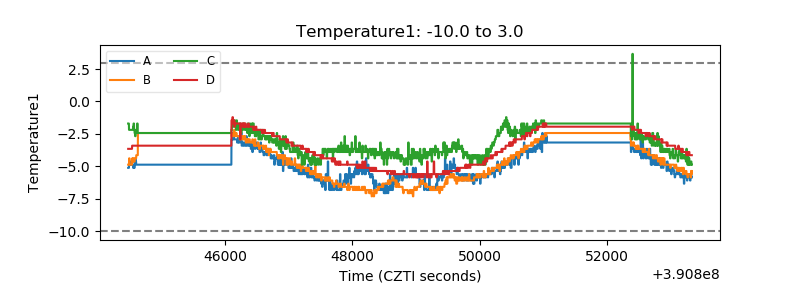 |
| Veto HV Monitor |  |
| Veto LLD | 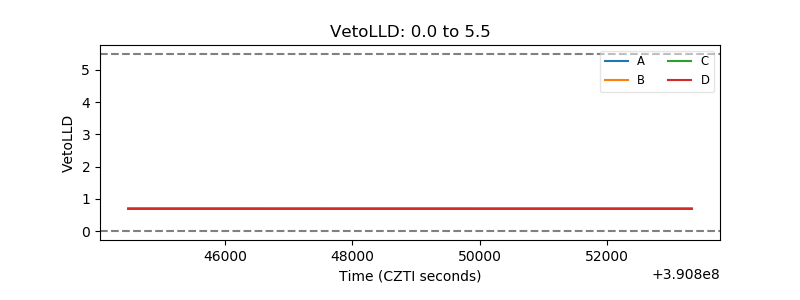 |
| Alpha Counter | 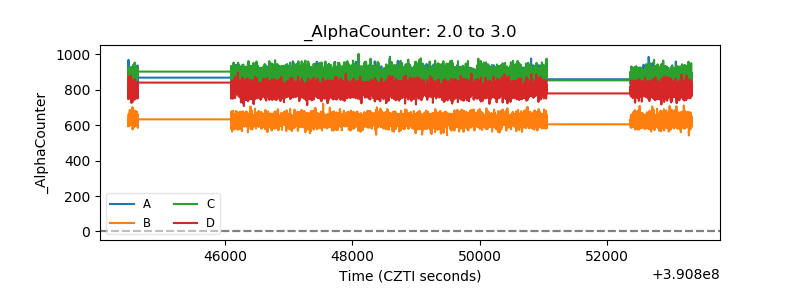 |
| _CPM_Rate | 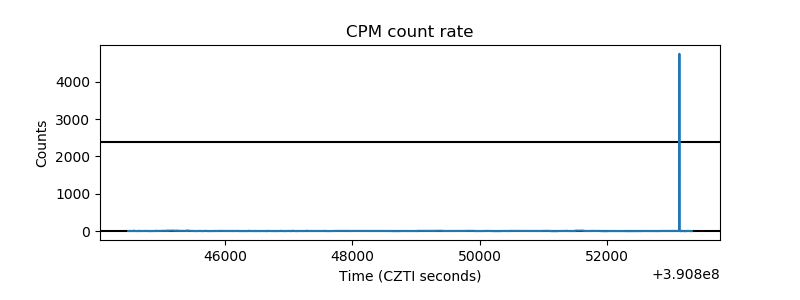 |
| CZT Counter | 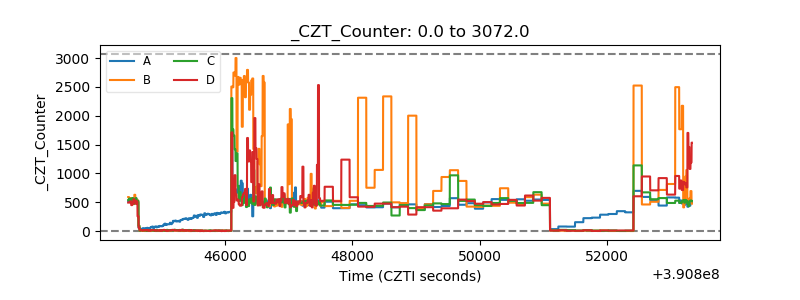 |
| +2.5 Volts monitor | 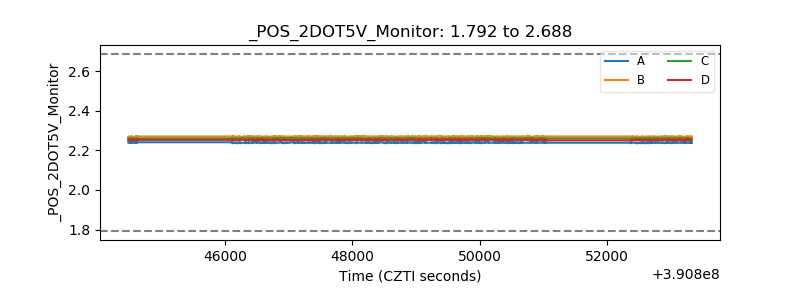 |
| +5 Volts monitor | 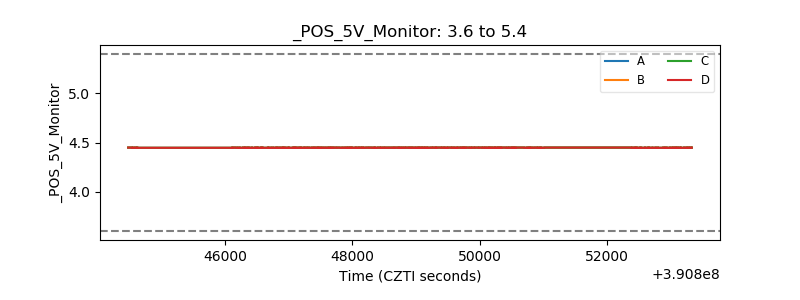 |
| _ROLL_ROT | 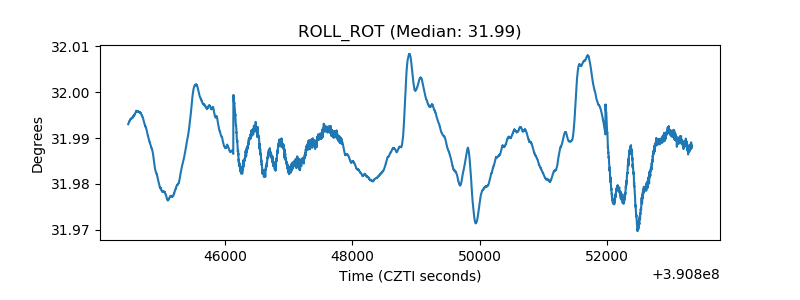 |
| _Roll_DEC | 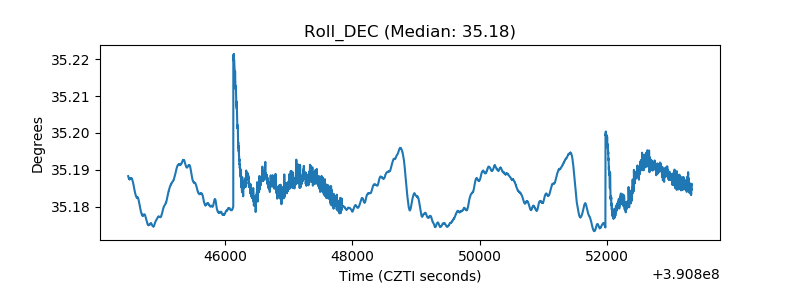 |
| _Roll_RA | 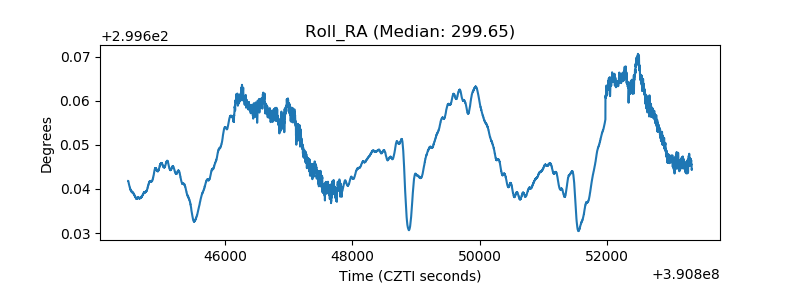 |
| Veto Counter | 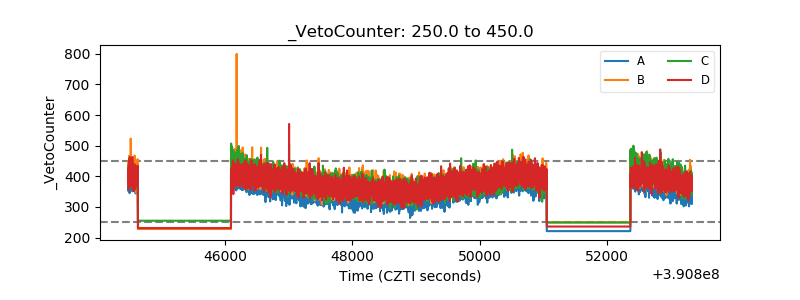 |