| Param | Original file | Final file |
|---|---|---|
| Filename | modeM0/AS1A11_080T01_9000005146_35929cztM0_level2.evt | modeM0/AS1A11_080T01_9000005146_35929cztM0_level2_quad_clean.evt |
| Size (bytes) | 1,779,788,160 | 212,803,200 |
| Size | 1.7 GB | 202.9 MB |
| Events in quadrant A | 11,310,245 | 1,356,156 |
| Events in quadrant B | 12,150,900 | 1,349,286 |
| Events in quadrant C | 9,987,131 | 1,311,116 |
| Events in quadrant D | 19,258,566 | 1,204,998 |
| Mode M9 | |||
|---|---|---|---|
| Quadrant | BADHDUFLAG | Total packets | Discarded packets |
| A | 0 | 82 | 0 |
| B | 0 | 82 | 0 |
| C | 0 | 82 | 0 |
| D | 0 | 82 | 0 |
| Mode SS | |||
|---|---|---|---|
| Quadrant | BADHDUFLAG | Total packets | Discarded packets |
| A | 0 | 362 | 0 |
| B | 0 | 362 | 0 |
| C | 0 | 362 | 0 |
| D | 0 | 362 | 0 |
| Mode M0 | |||
|---|---|---|---|
| Quadrant | BADHDUFLAG | Total packets | Discarded packets |
| A | 0 | 44055 | 5 |
| B | 0 | 46688 | 4 |
| C | 0 | 39431 | 4 |
| D | 0 | 68554 | 4 |
| Quadrant | Total seconds | Saturated seconds | Saturation percentage |
|---|---|---|---|
| A | 17747 | 317 | 1.786217% |
| B | 17747 | 1153 | 6.496873% |
| C | 17747 | 254 | 1.431228% |
| D | 17747 | 3783 | 21.316279% |
Noise dominated data is calculated using 1-second bins in cleaned event files. If a bin has >2000 counts, and if more than 50% of those come from <1% of pixels, then it is considered to be noise-dominated and hence unusable.
| Quadrant | # 1 sec bins | Bins with >0 counts | Bins with >2000 counts | High rate bins dominated by noise | Noise dominated (total time) | Noise dominated (detector-on time) | Marked lightcurve |
|---|---|---|---|---|---|---|---|
| A | 25938 | 17751 | 211 | 211 | 0.81% | 1.19% | 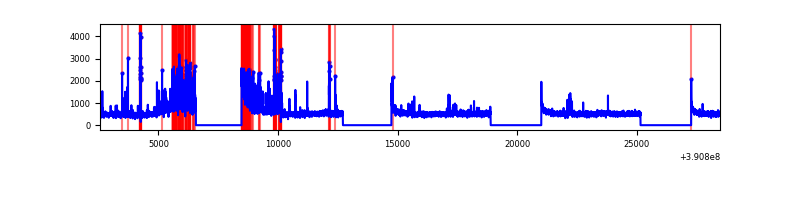 |
| B | 25938 | 17751 | 794 | 794 | 3.06% | 4.47% | 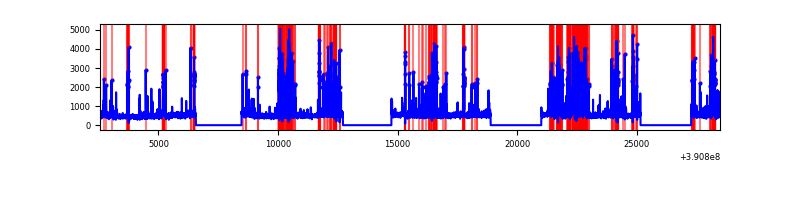 |
| C | 25938 | 17751 | 198 | 198 | 0.76% | 1.12% | 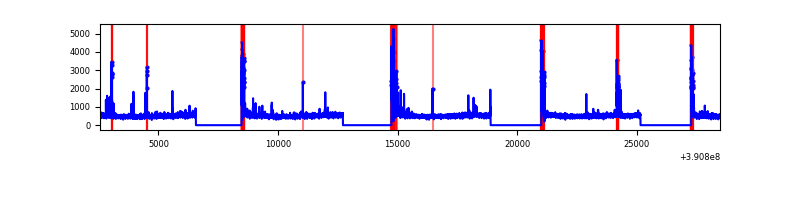 |
| D | 25938 | 17751 | 3554 | 3554 | 13.70% | 20.02% | 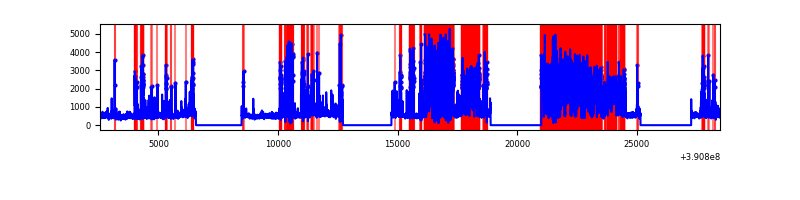 |
Top three noisy pixels from each quadrant. If the there are fewer than three noisy pixels in the level2.evt file, extra rows are filled as -1
| Pixel properties | Quadrant properties | ||||||
|---|---|---|---|---|---|---|---|
| Quadrant | DetID | PixID | Counts | Sigma | Mean | Median | Sigma |
| A | 15 | 169 | 1932547 | 4336.35 | 2251 | 2219 | 445.1 |
| A | 10 | 83 | 435303 | 972.89 | 2251 | 2219 | 445.1 |
| A | 9 | 143 | 188175 | 417.74 | 2251 | 2219 | 445.1 |
| B | 5 | 172 | 3199146 | 8042.64 | 2149 | 2104 | 397.5 |
| B | 5 | 255 | 250715 | 625.42 | 2149 | 2104 | 397.5 |
| B | 0 | 213 | 85903 | 210.81 | 2149 | 2104 | 397.5 |
| C | 0 | 10 | 793891 | 1628.73 | 2132 | 2153 | 486.1 |
| C | 15 | 214 | 733633 | 1504.77 | 2132 | 2153 | 486.1 |
| C | 0 | 207 | 144498 | 292.83 | 2132 | 2153 | 486.1 |
| D | 8 | 230 | 8800165 | 18445.69 | 1964 | 1915 | 477.0 |
| D | 8 | 195 | 635317 | 1327.94 | 1964 | 1915 | 477.0 |
| D | 13 | 249 | 548554 | 1146.04 | 1964 | 1915 | 477.0 |
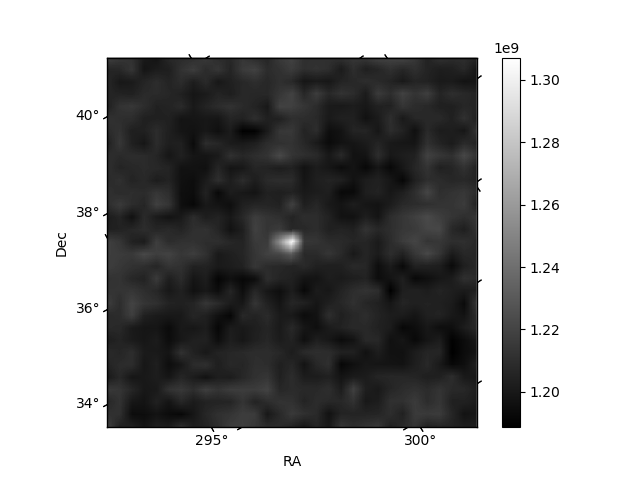
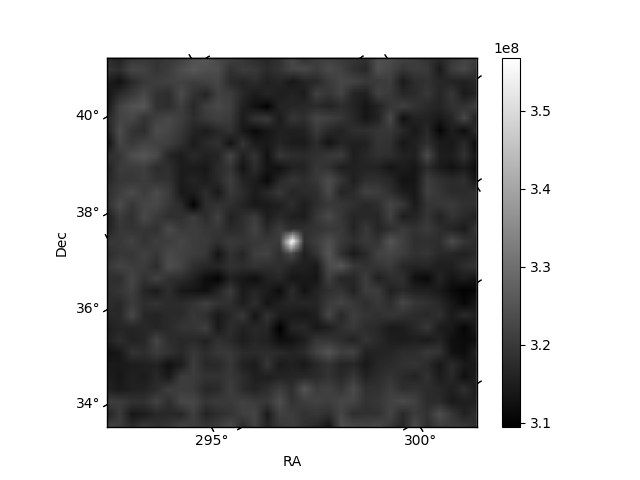
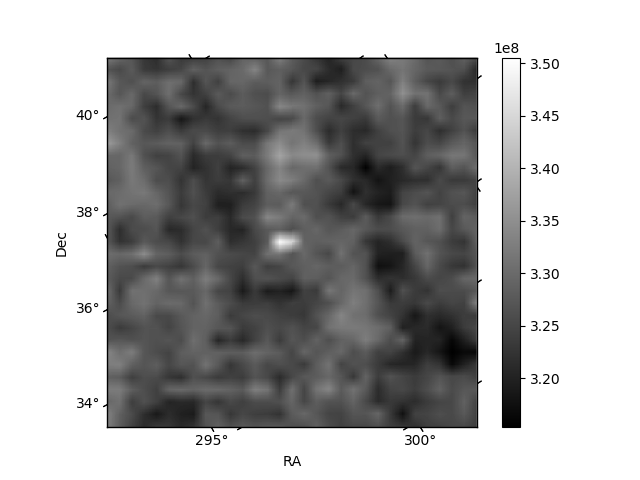
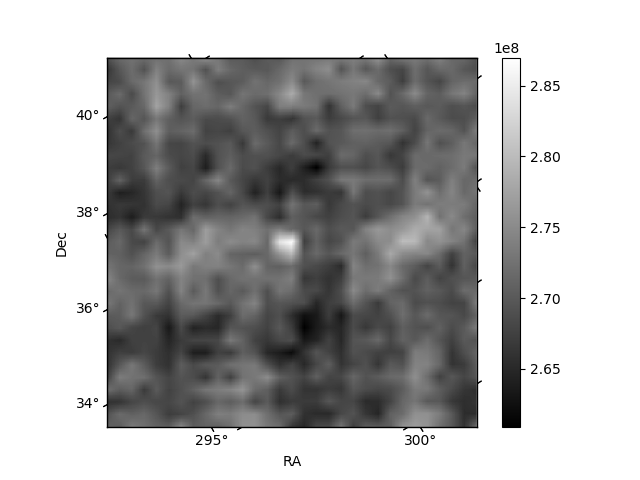
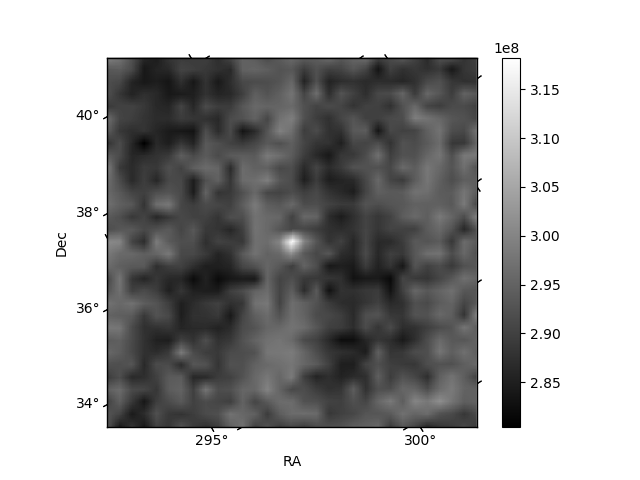
Histogram calculated using DETX and DETY for each event in the final _common_clean file
| Quadrant A | 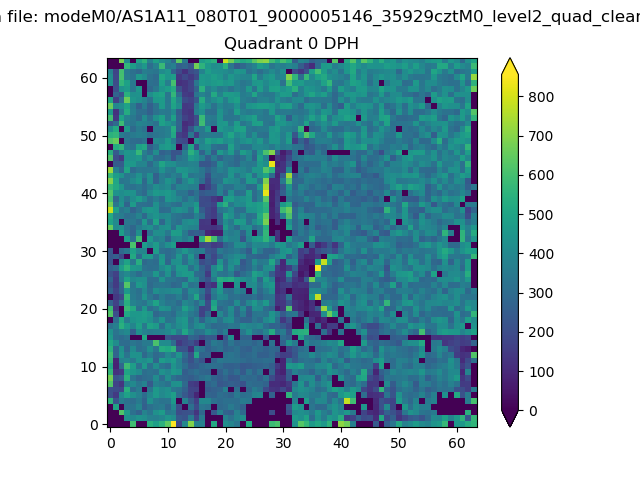 |
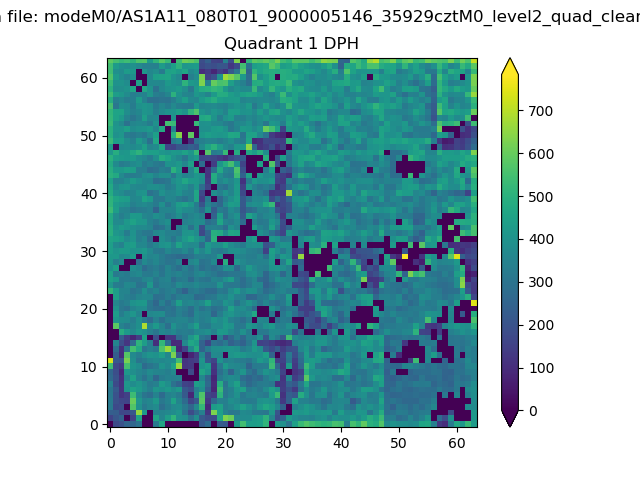 |
Quadrant B |
|---|---|---|---|
| Quadrant D | 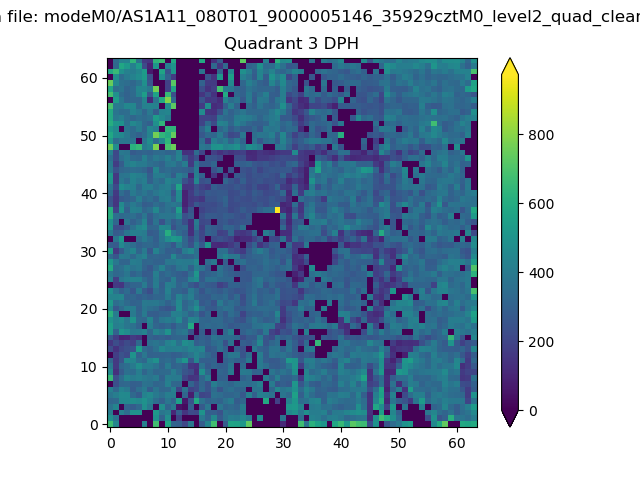 |
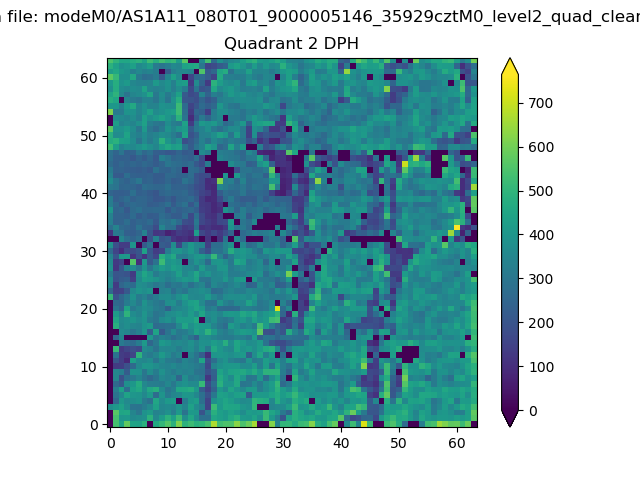 |
Quadrant C |
| Plot type | Count rate plots | Images |
|---|---|---|
| Comparison with Poisson distribution Blue bars denote a histogram of data divided into 1 sec bins. Red curve is a Poisson curve with rate = median count rate of data. |
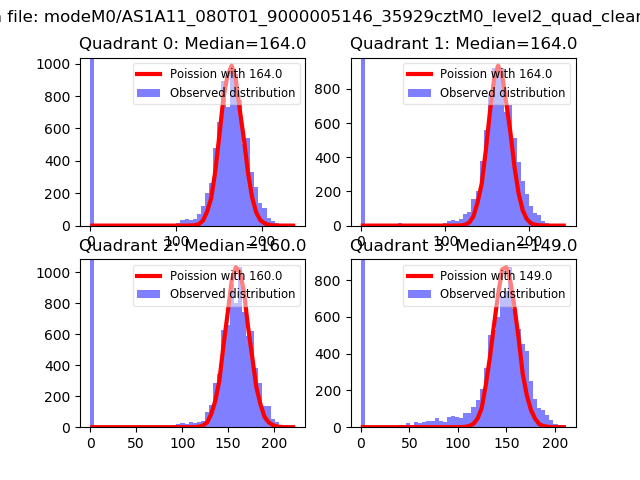 |
 |
| Quadrant-wise count rates Data is divided into 100 sec bins |
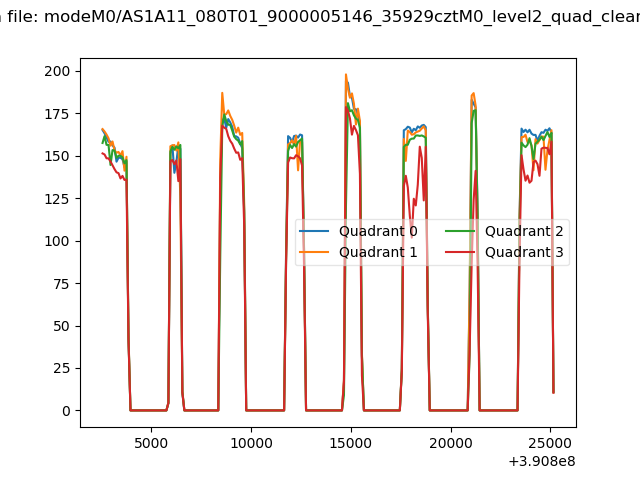 |
|
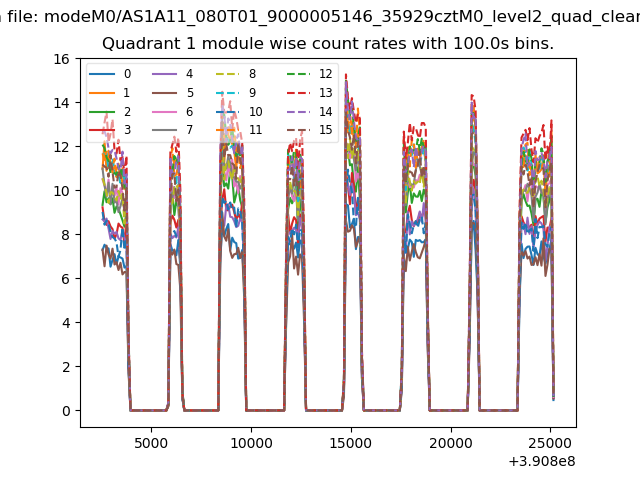
| Module-wise count rates for Quadrant A Data is divided into 100 sec bins |
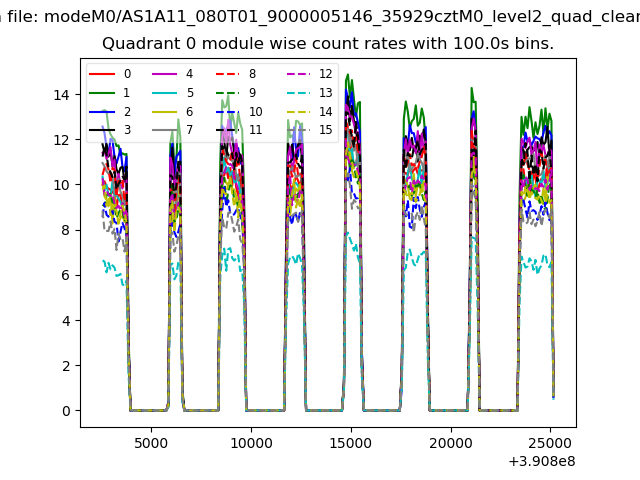 |
 |
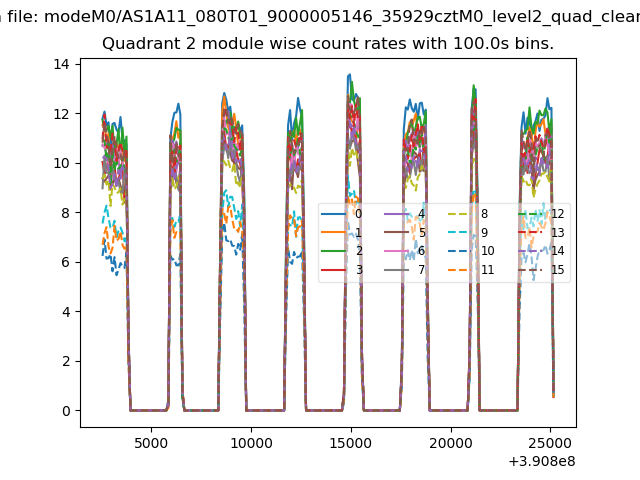
| Module-wise count rates for Quadrant B Data is divided into 100 sec bins |
 |
 |
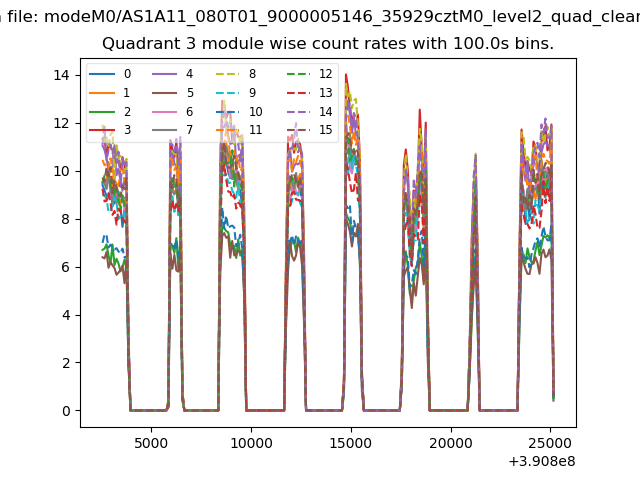
| Module-wise count rates for Quadrant C Data is divided into 100 sec bins |
 |
 |
| Module-wise count rates for Quadrant D Data is divided into 100 sec bins |
 |
 |
| Parameter | Plot |
|---|---|
| CZT HV Monitor | 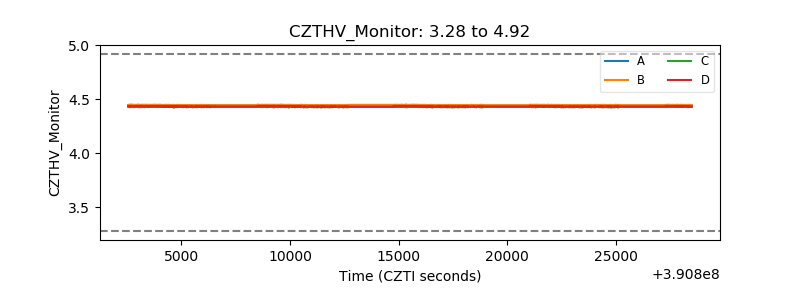 |
| D_VDD | 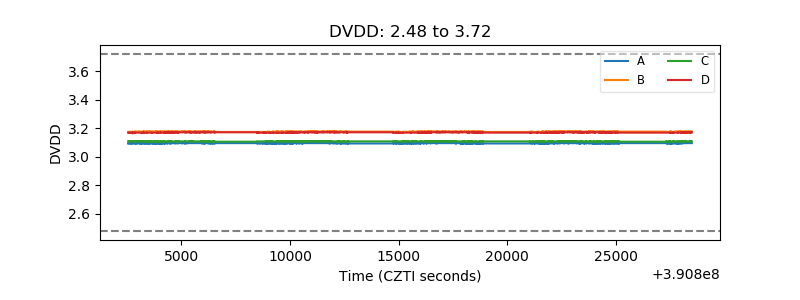 |
| Temperature 1 | 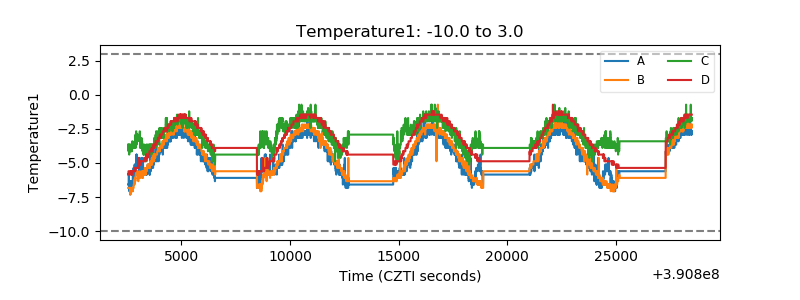 |
| Veto HV Monitor | 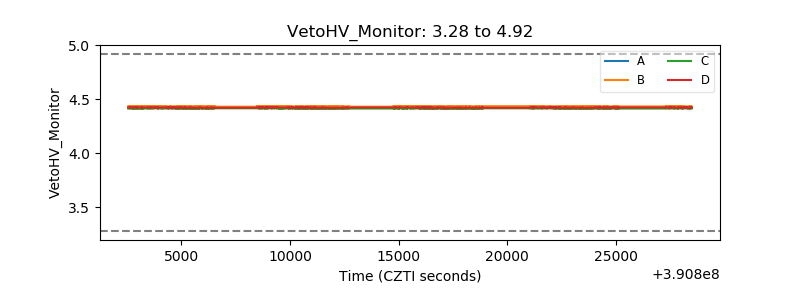 |
| Veto LLD | 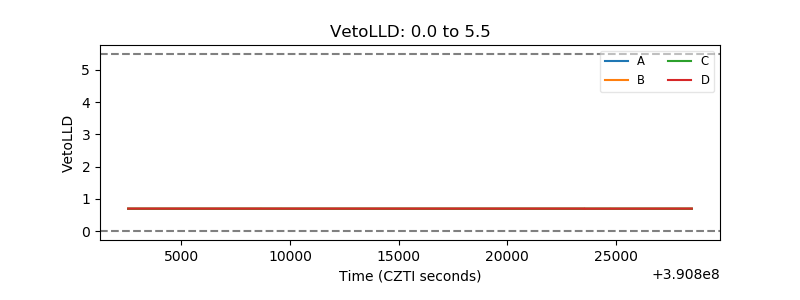 |
| Alpha Counter | 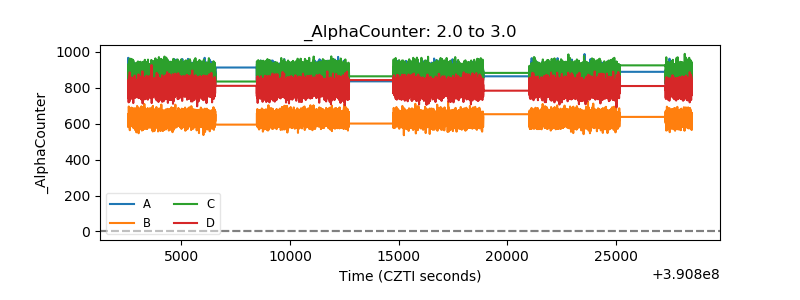 |
| _CPM_Rate | 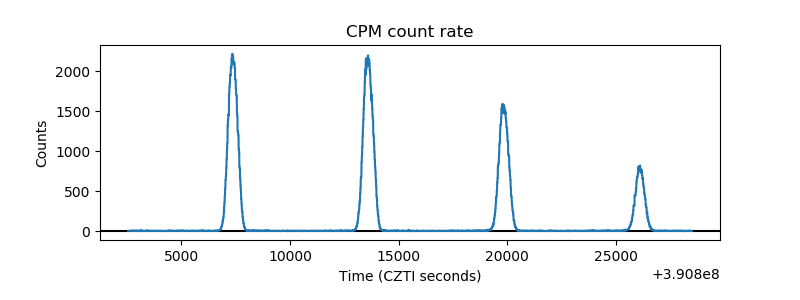 |
| CZT Counter | 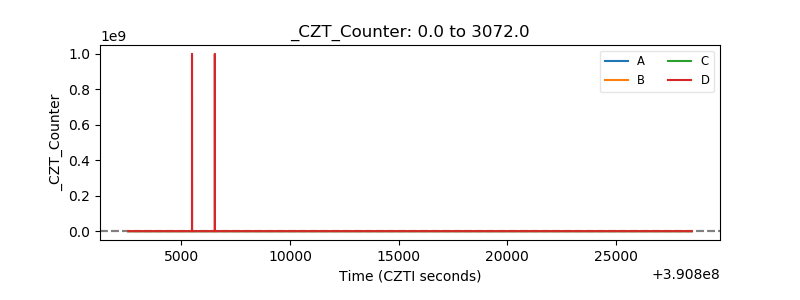 |
| +2.5 Volts monitor | 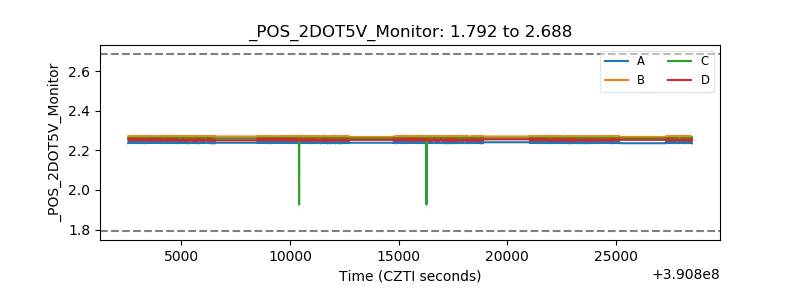 |
| +5 Volts monitor | 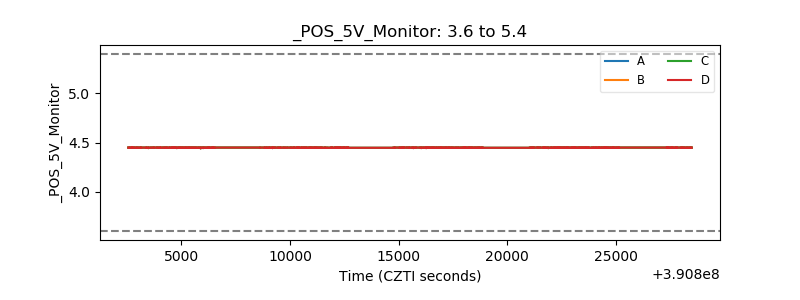 |
| _ROLL_ROT | 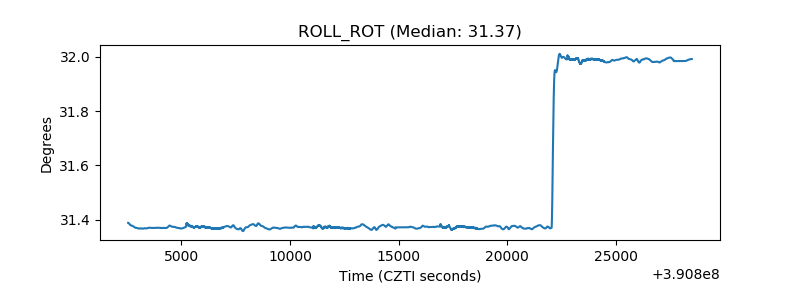 |
| _Roll_DEC | 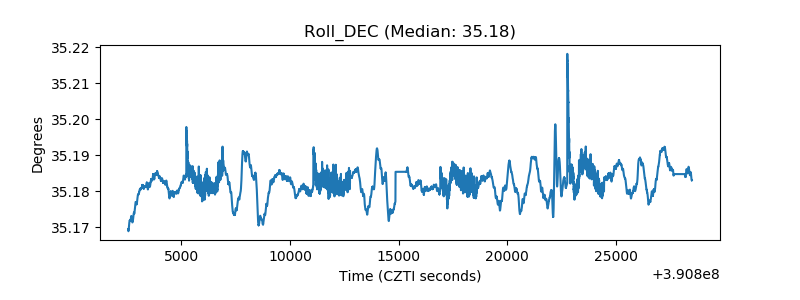 |
| _Roll_RA | 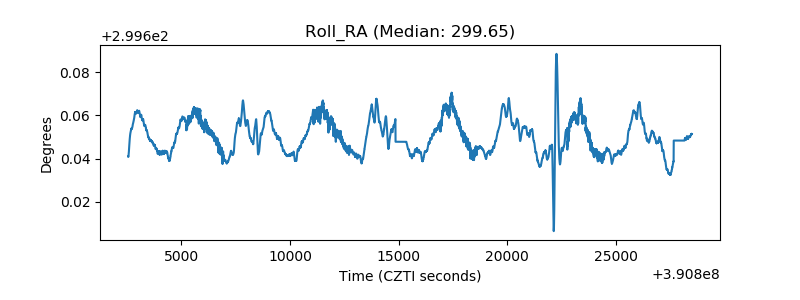 |
| Veto Counter | 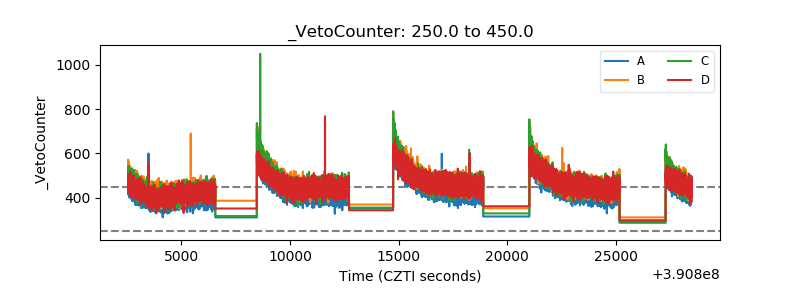 |