| Param | Original file | Final file |
|---|---|---|
| Filename | modeM0/AS1A11_080T01_9000005146_35927cztM0_level2.evt | modeM0/AS1A11_080T01_9000005146_35927cztM0_level2_quad_clean.evt |
| Size (bytes) | 478,598,400 | 77,135,040 |
| Size | 456.4 MB | 73.6 MB |
| Events in quadrant A | 3,806,007 | 505,089 |
| Events in quadrant B | 3,505,048 | 510,022 |
| Events in quadrant C | 3,158,560 | 483,228 |
| Events in quadrant D | 3,669,115 | 470,038 |
| Mode M9 | |||
|---|---|---|---|
| Quadrant | BADHDUFLAG | Total packets | Discarded packets |
| A | 0 | 30 | 0 |
| B | 0 | 30 | 0 |
| C | 0 | 30 | 0 |
| D | 0 | 31 | 0 |
| Mode SS | |||
|---|---|---|---|
| Quadrant | BADHDUFLAG | Total packets | Discarded packets |
| A | 0 | 106 | 0 |
| B | 0 | 106 | 0 |
| C | 0 | 106 | 0 |
| D | 0 | 106 | 0 |
| Mode M0 | |||
|---|---|---|---|
| Quadrant | BADHDUFLAG | Total packets | Discarded packets |
| A | 0 | 14525 | 3 |
| B | 0 | 13512 | 2 |
| C | 0 | 12350 | 2 |
| D | 0 | 14237 | 2 |
| Quadrant | Total seconds | Saturated seconds | Saturation percentage |
|---|---|---|---|
| A | 5249 | 127 | 2.419508% |
| B | 5249 | 289 | 5.505811% |
| C | 5249 | 139 | 2.648123% |
| D | 5249 | 228 | 4.343685% |
Noise dominated data is calculated using 1-second bins in cleaned event files. If a bin has >2000 counts, and if more than 50% of those come from <1% of pixels, then it is considered to be noise-dominated and hence unusable.
| Quadrant | # 1 sec bins | Bins with >0 counts | Bins with >2000 counts | High rate bins dominated by noise | Noise dominated (total time) | Noise dominated (detector-on time) | Marked lightcurve |
|---|---|---|---|---|---|---|---|
| A | 7281 | 5250 | 105 | 105 | 1.44% | 2.00% | 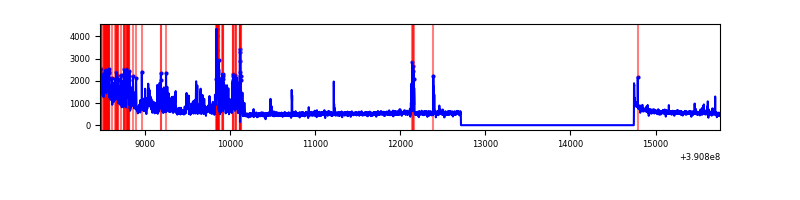 |
| B | 7281 | 5250 | 202 | 202 | 2.77% | 3.85% | 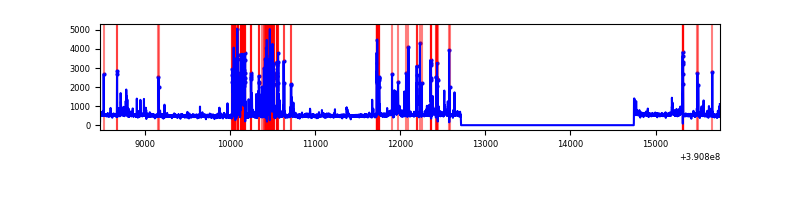 |
| C | 7281 | 5250 | 109 | 109 | 1.50% | 2.08% | 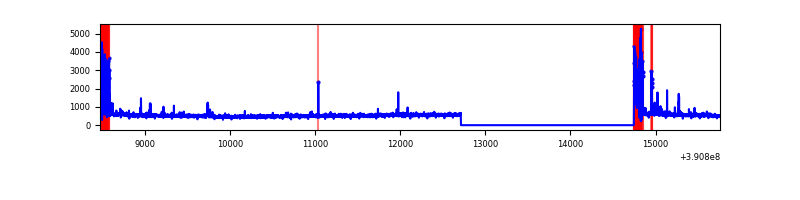 |
| D | 7281 | 5250 | 168 | 168 | 2.31% | 3.20% | 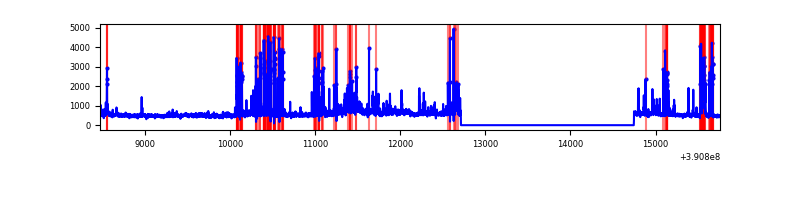 |
Top three noisy pixels from each quadrant. If the there are fewer than three noisy pixels in the level2.evt file, extra rows are filled as -1
| Pixel properties | Quadrant properties | ||||||
|---|---|---|---|---|---|---|---|
| Quadrant | DetID | PixID | Counts | Sigma | Mean | Median | Sigma |
| A | 15 | 169 | 922079 | 6811.75 | 677 | 667 | 135.3 |
| A | 10 | 83 | 162017 | 1192.82 | 677 | 667 | 135.3 |
| A | 9 | 143 | 77565 | 568.49 | 677 | 667 | 135.3 |
| B | 5 | 172 | 769966 | 6358.13 | 649 | 636 | 121.0 |
| B | 5 | 255 | 103383 | 849.15 | 649 | 636 | 121.0 |
| B | 4 | 67 | 38424 | 312.3 | 649 | 636 | 121.0 |
| C | 0 | 10 | 396617 | 2708.58 | 634 | 643 | 146.2 |
| C | 15 | 214 | 221255 | 1509.05 | 634 | 643 | 146.2 |
| C | 0 | 207 | 62912 | 425.94 | 634 | 643 | 146.2 |
| D | 13 | 249 | 371874 | 2403.09 | 637 | 621 | 154.5 |
| D | 8 | 195 | 269880 | 1742.89 | 637 | 621 | 154.5 |
| D | 10 | 118 | 169868 | 1095.52 | 637 | 621 | 154.5 |
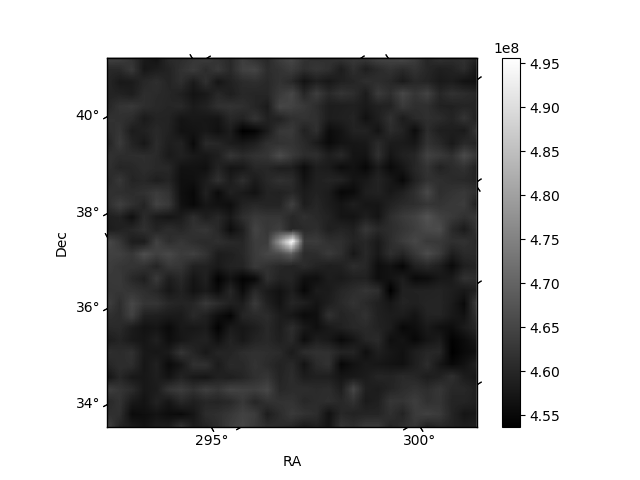
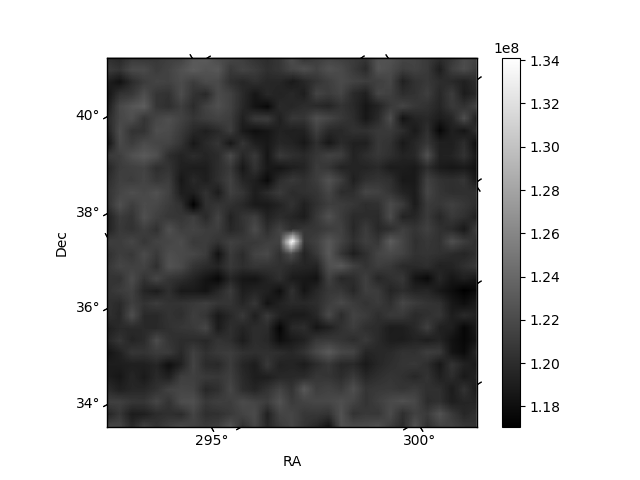
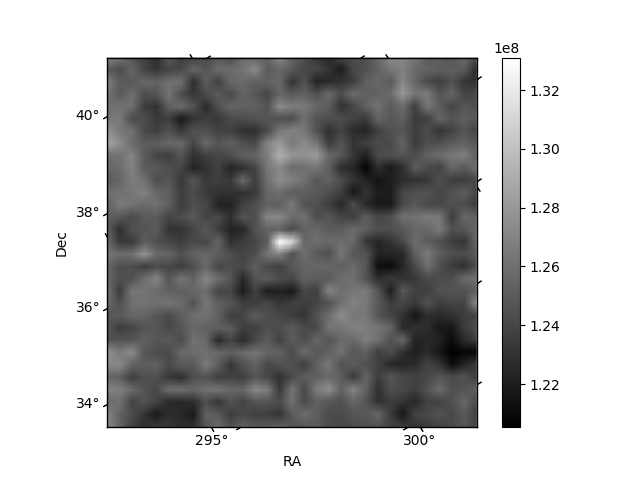
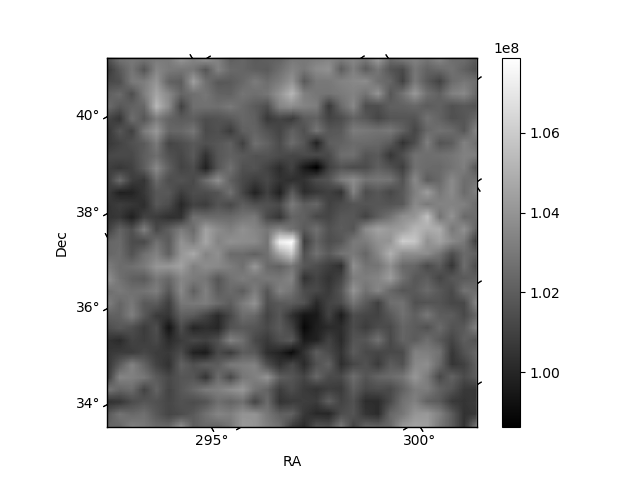
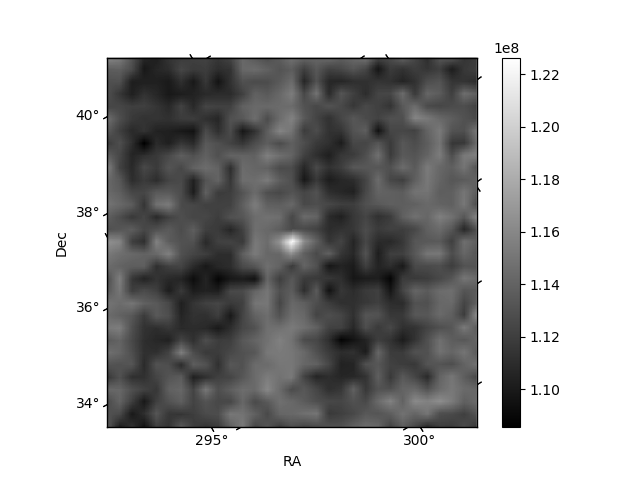
Histogram calculated using DETX and DETY for each event in the final _common_clean file
| Quadrant A | 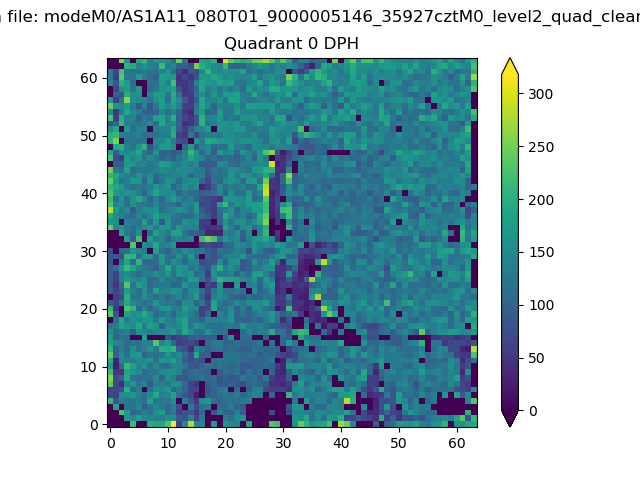 |
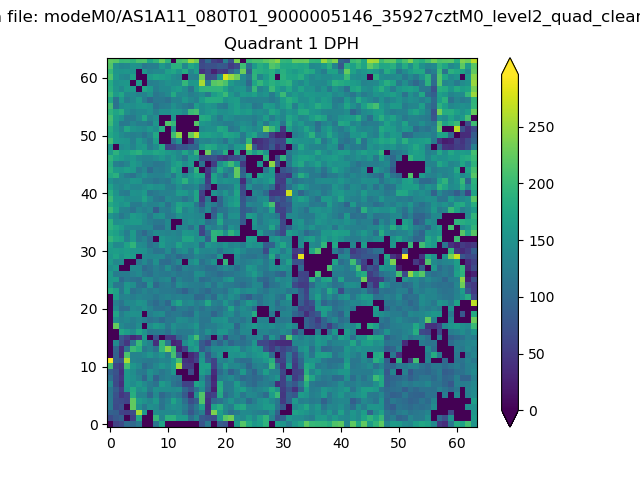 |
Quadrant B |
|---|---|---|---|
| Quadrant D | 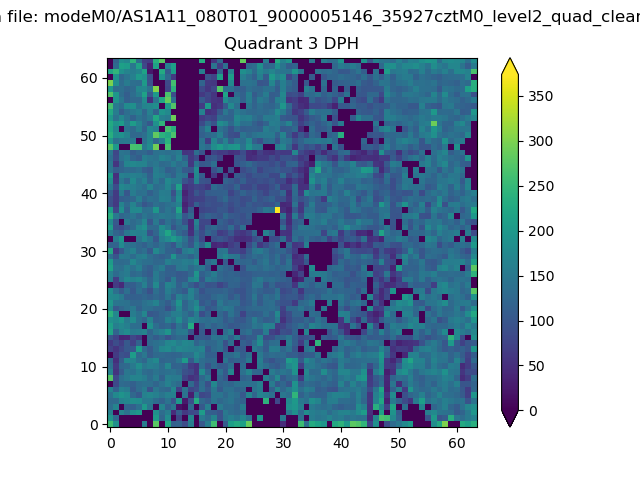 |
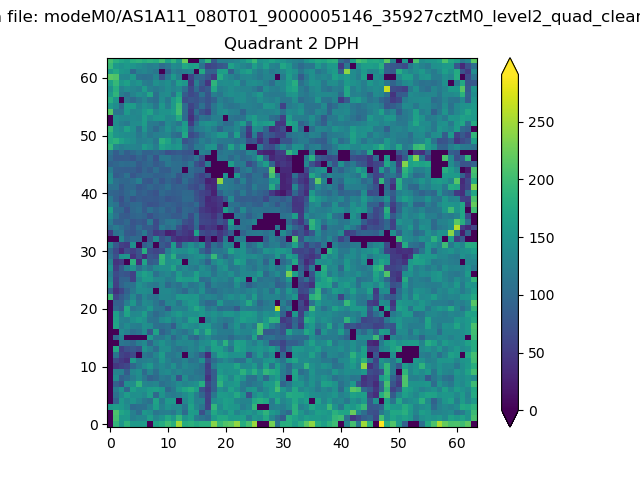 |
Quadrant C |
| Plot type | Count rate plots | Images |
|---|---|---|
| Comparison with Poisson distribution Blue bars denote a histogram of data divided into 1 sec bins. Red curve is a Poisson curve with rate = median count rate of data. |
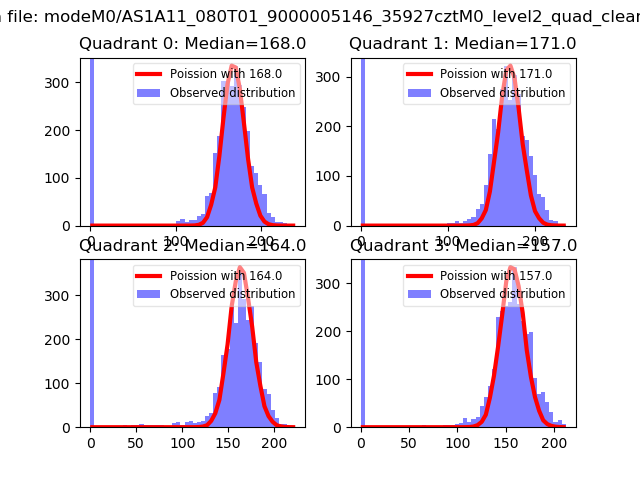 |
 |
| Quadrant-wise count rates Data is divided into 100 sec bins |
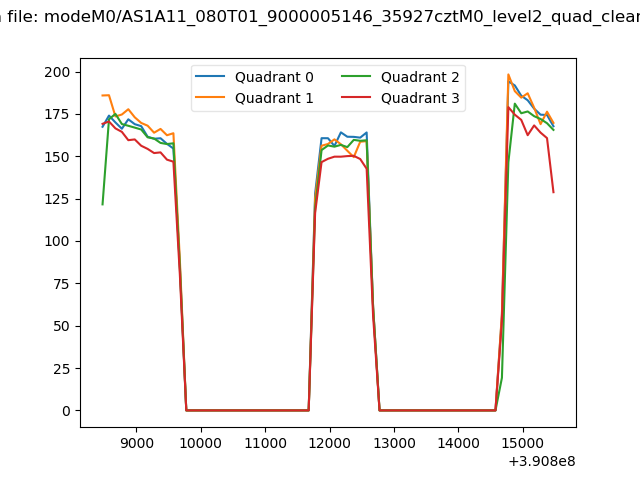 |
|
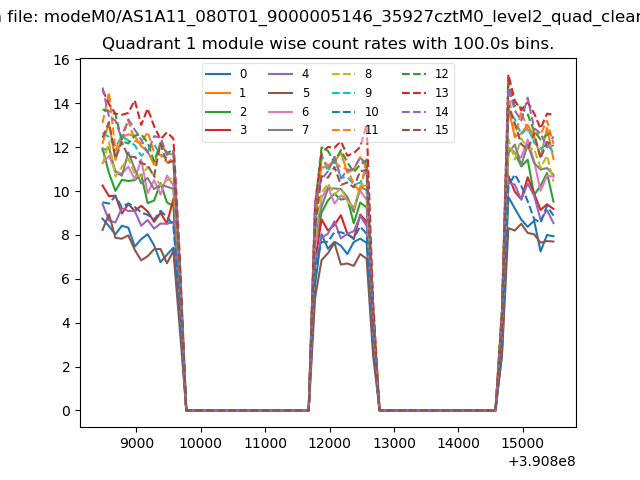
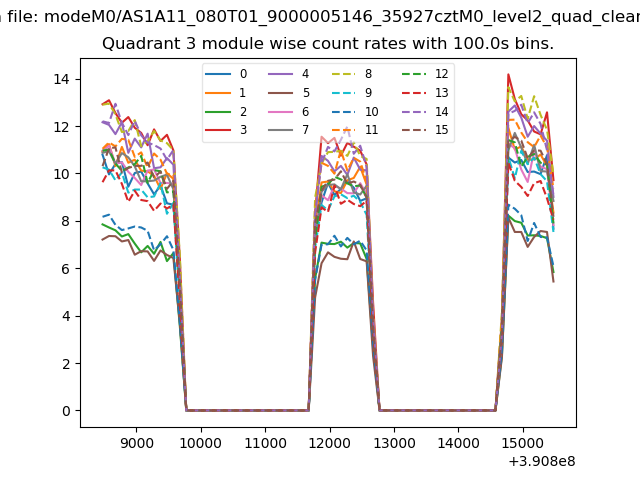
| Module-wise count rates for Quadrant A Data is divided into 100 sec bins |
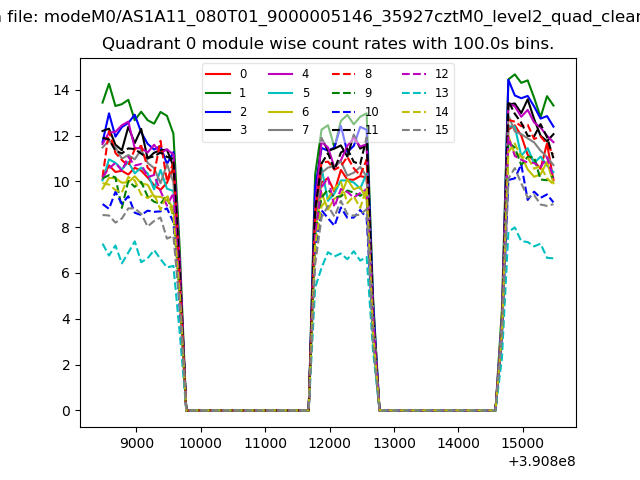 |
 |
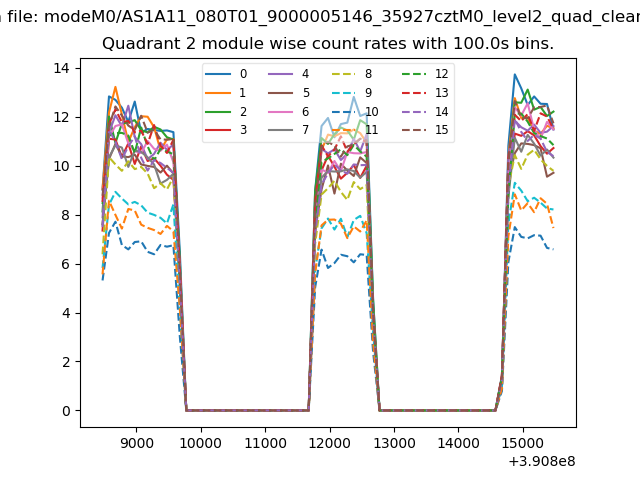
| Module-wise count rates for Quadrant B Data is divided into 100 sec bins |
 |
 |
| Module-wise count rates for Quadrant C Data is divided into 100 sec bins |
 |
 |
| Module-wise count rates for Quadrant D Data is divided into 100 sec bins |
 |
 |
| Parameter | Plot |
|---|---|
| CZT HV Monitor | 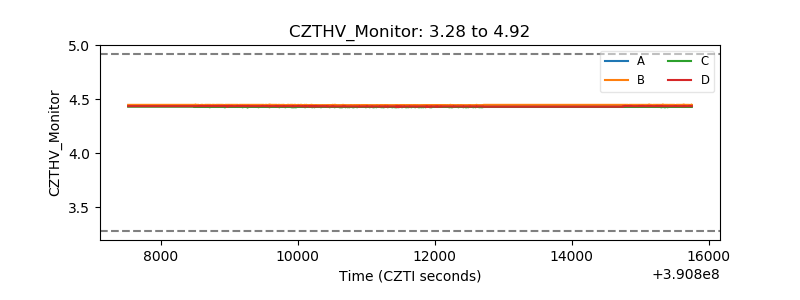 |
| D_VDD | 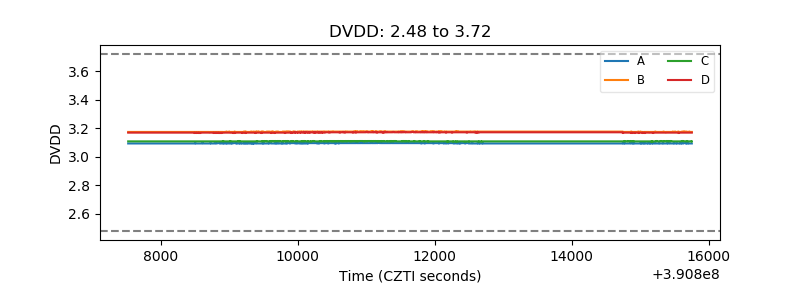 |
| Temperature 1 | 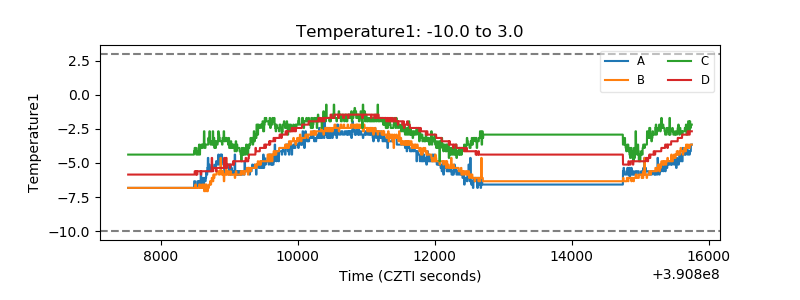 |
| Veto HV Monitor | 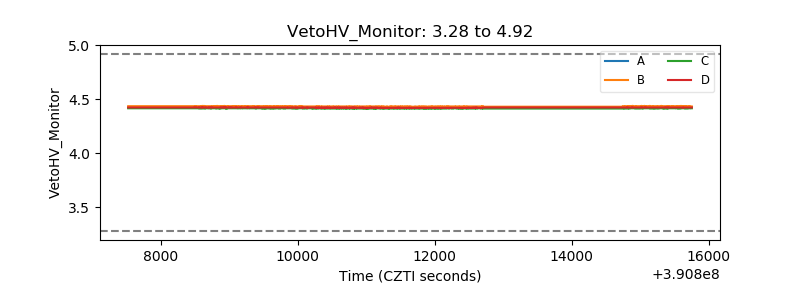 |
| Veto LLD | 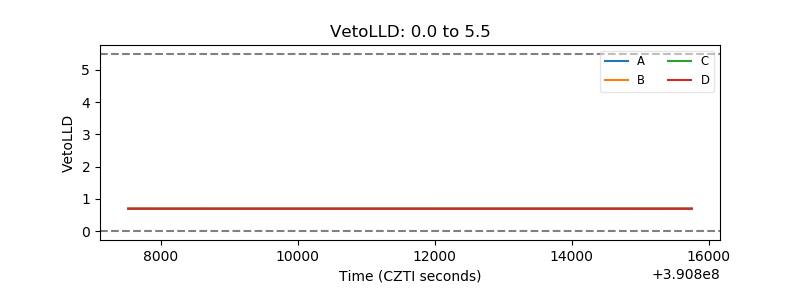 |
| Alpha Counter | 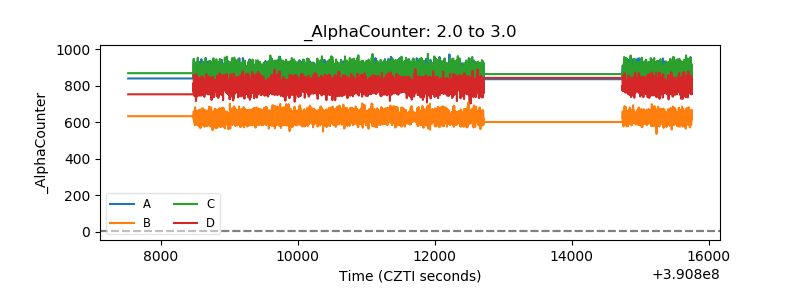 |
| _CPM_Rate | 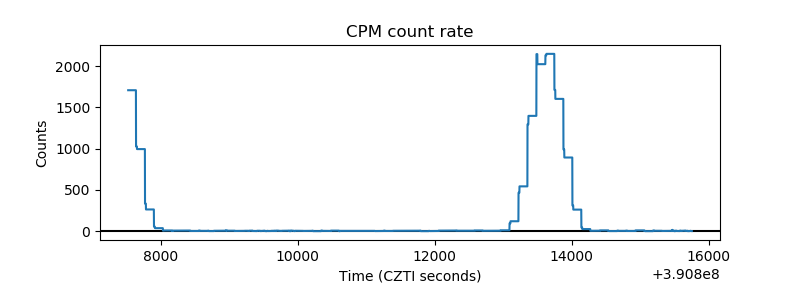 |
| CZT Counter | 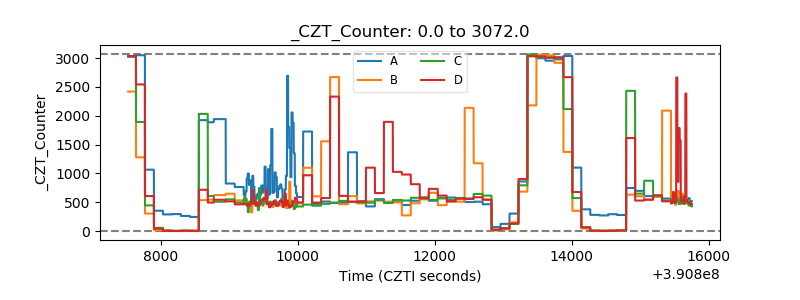 |
| +2.5 Volts monitor | 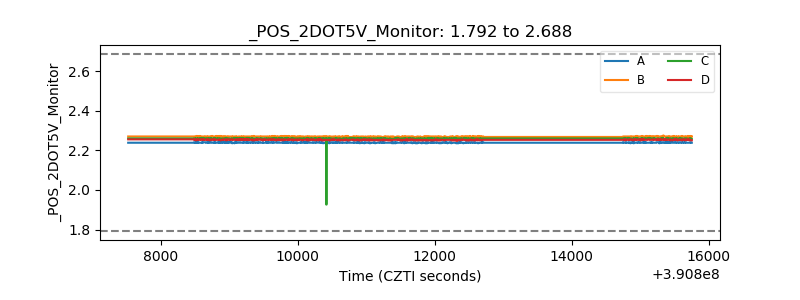 |
| +5 Volts monitor | 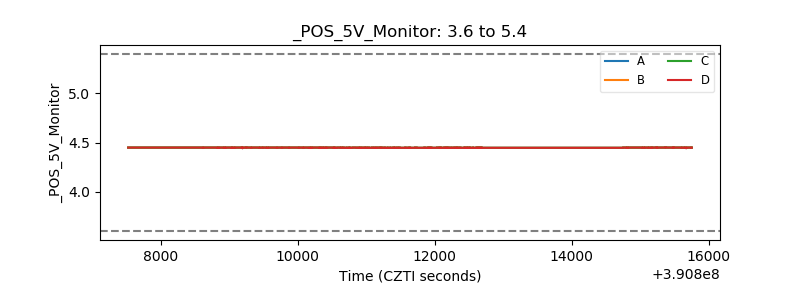 |
| _ROLL_ROT | 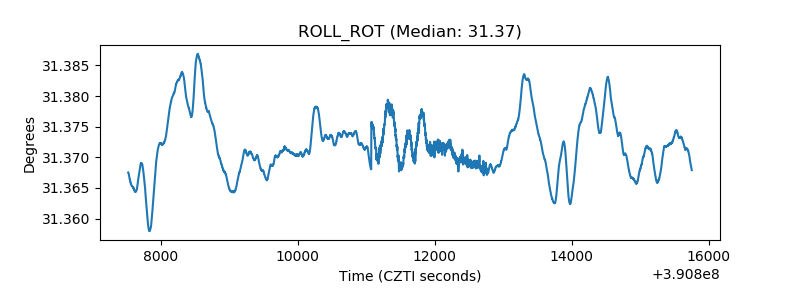 |
| _Roll_DEC | 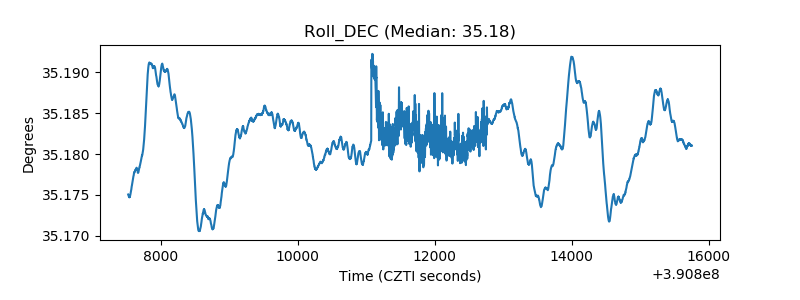 |
| _Roll_RA | 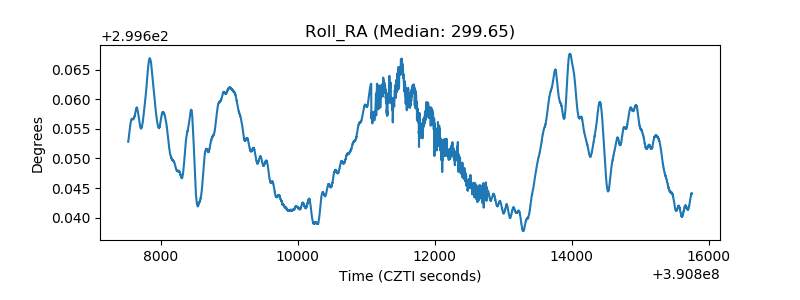 |
| Veto Counter | 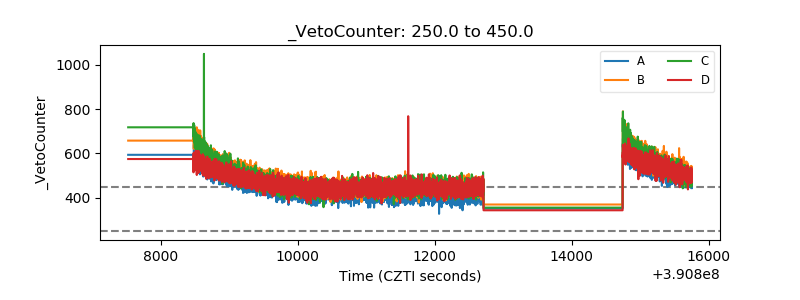 |