| Param | Original file | Final file |
|---|---|---|
| Filename | modeM0/AS1A11_080T01_9000005146_35925cztM0_level2.evt | modeM0/AS1A11_080T01_9000005146_35925cztM0_level2_quad_clean.evt |
| Size (bytes) | 421,058,880 | 79,649,280 |
| Size | 401.6 MB | 76.0 MB |
| Events in quadrant A | 2,795,359 | 520,363 |
| Events in quadrant B | 3,243,230 | 517,280 |
| Events in quadrant C | 3,095,840 | 502,975 |
| Events in quadrant D | 3,243,283 | 486,197 |
| Mode M9 | |||
|---|---|---|---|
| Quadrant | BADHDUFLAG | Total packets | Discarded packets |
| A | 0 | 32 | 0 |
| B | 0 | 32 | 0 |
| C | 0 | 32 | 0 |
| D | 0 | 33 | 0 |
| Mode SS | |||
|---|---|---|---|
| Quadrant | BADHDUFLAG | Total packets | Discarded packets |
| A | 0 | 112 | 0 |
| B | 0 | 112 | 0 |
| C | 0 | 112 | 0 |
| D | 0 | 112 | 0 |
| Mode M0 | |||
|---|---|---|---|
| Quadrant | BADHDUFLAG | Total packets | Discarded packets |
| A | 0 | 11709 | 3 |
| B | 0 | 13144 | 2 |
| C | 0 | 12426 | 2 |
| D | 0 | 13338 | 2 |
| Quadrant | Total seconds | Saturated seconds | Saturation percentage |
|---|---|---|---|
| A | 5502 | 20 | 0.363504% |
| B | 5502 | 171 | 3.107961% |
| C | 5502 | 122 | 2.217375% |
| D | 5502 | 65 | 1.181389% |
Noise dominated data is calculated using 1-second bins in cleaned event files. If a bin has >2000 counts, and if more than 50% of those come from <1% of pixels, then it is considered to be noise-dominated and hence unusable.
| Quadrant | # 1 sec bins | Bins with >0 counts | Bins with >2000 counts | High rate bins dominated by noise | Noise dominated (total time) | Noise dominated (detector-on time) | Marked lightcurve |
|---|---|---|---|---|---|---|---|
| A | 7294 | 5503 | 14 | 14 | 0.19% | 0.25% | 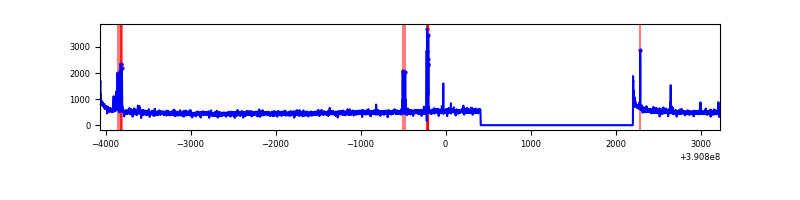 |
| B | 7294 | 5503 | 106 | 106 | 1.45% | 1.93% | 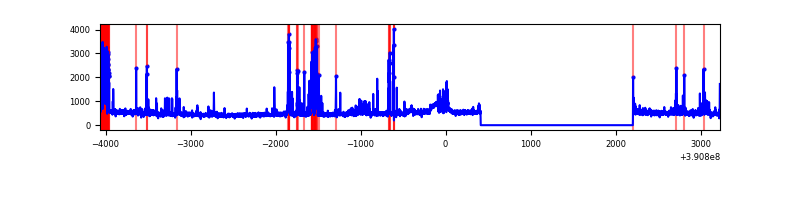 |
| C | 7294 | 5503 | 92 | 92 | 1.26% | 1.67% | 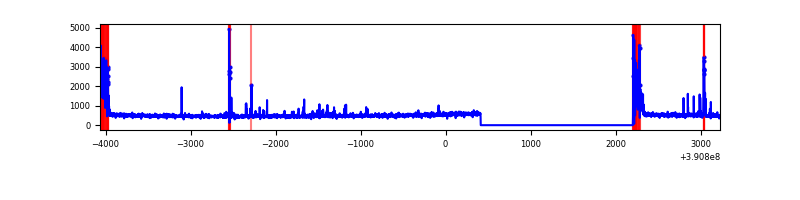 |
| D | 7294 | 5503 | 43 | 43 | 0.59% | 0.78% | 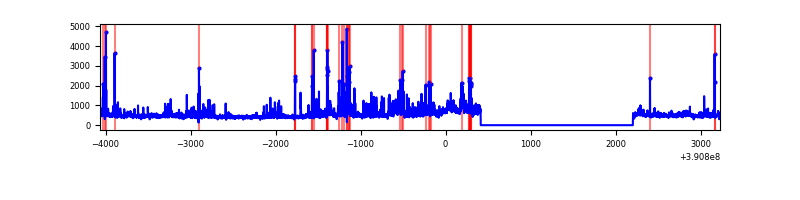 |
Top three noisy pixels from each quadrant. If the there are fewer than three noisy pixels in the level2.evt file, extra rows are filled as -1
| Pixel properties | Quadrant properties | ||||||
|---|---|---|---|---|---|---|---|
| Quadrant | DetID | PixID | Counts | Sigma | Mean | Median | Sigma |
| A | 10 | 83 | 166718 | 1270.61 | 650 | 641 | 130.7 |
| A | 9 | 143 | 98404 | 747.96 | 650 | 641 | 130.7 |
| A | 13 | 254 | 9449 | 67.39 | 650 | 641 | 130.7 |
| B | 5 | 172 | 632562 | 5213.13 | 638 | 624 | 121.2 |
| B | 5 | 255 | 30893 | 249.7 | 638 | 624 | 121.2 |
| B | 0 | 213 | 27911 | 225.1 | 638 | 624 | 121.2 |
| C | 0 | 10 | 322359 | 2234.9 | 620 | 625 | 144.0 |
| C | 15 | 214 | 231261 | 1602.09 | 620 | 625 | 144.0 |
| C | 0 | 207 | 124196 | 858.37 | 620 | 625 | 144.0 |
| D | 1 | 52 | 233713 | 1527.64 | 623 | 608 | 152.6 |
| D | 2 | 250 | 207132 | 1353.44 | 623 | 608 | 152.6 |
| D | 8 | 195 | 165725 | 1082.09 | 623 | 608 | 152.6 |
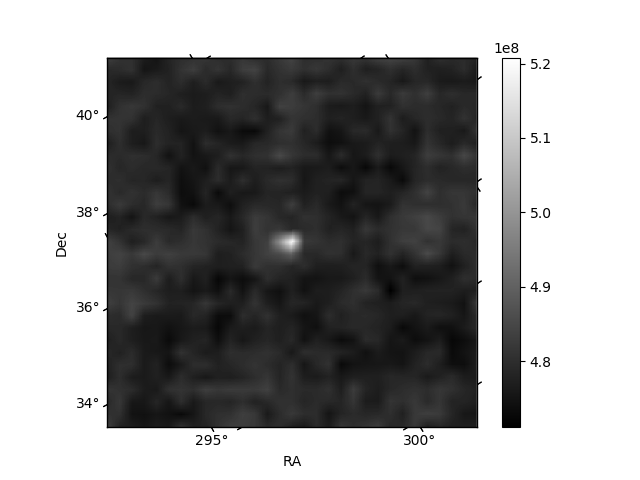
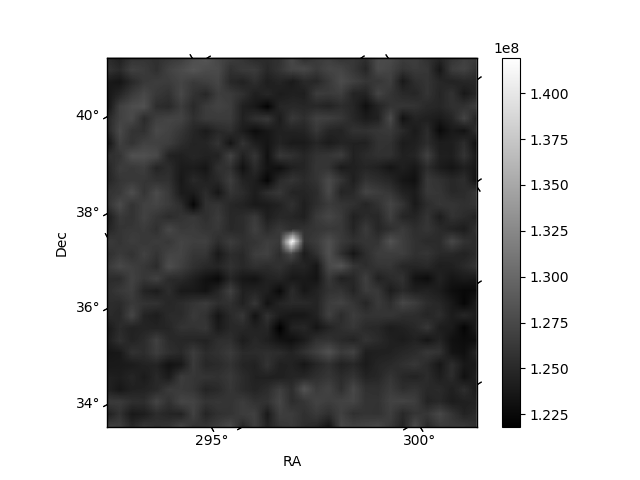
Histogram calculated using DETX and DETY for each event in the final _common_clean file
| Quadrant A | 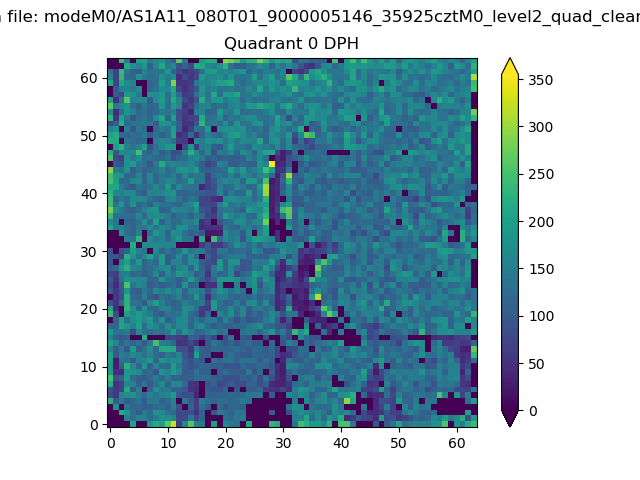 |
 |
Quadrant B |
|---|---|---|---|
| Quadrant D | 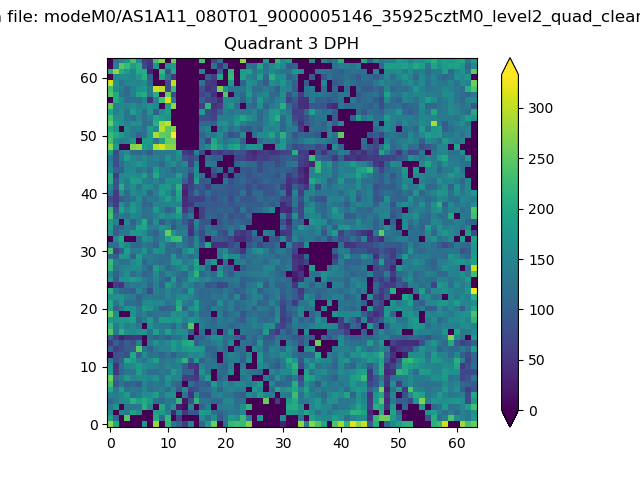 |
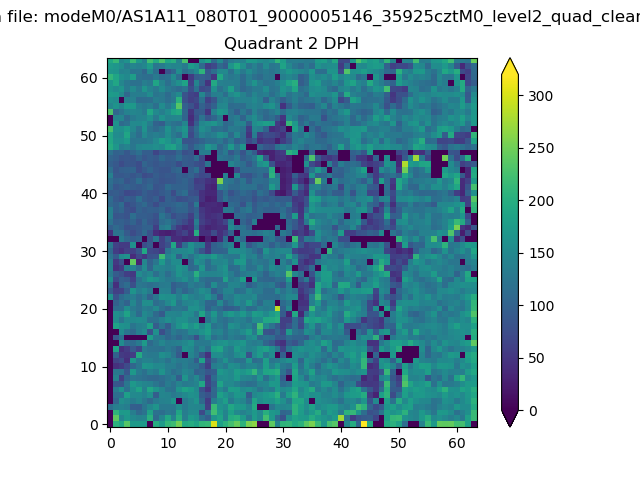 |
Quadrant C |
| Plot type | Count rate plots | Images |
|---|---|---|
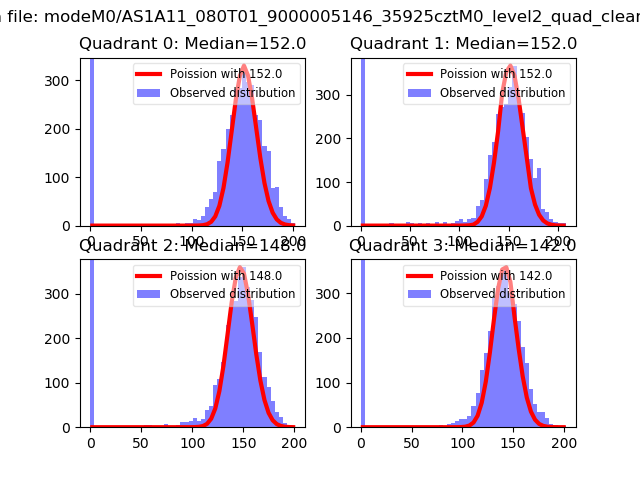
| Comparison with Poisson distribution Blue bars denote a histogram of data divided into 1 sec bins. Red curve is a Poisson curve with rate = median count rate of data. |
 |
 |
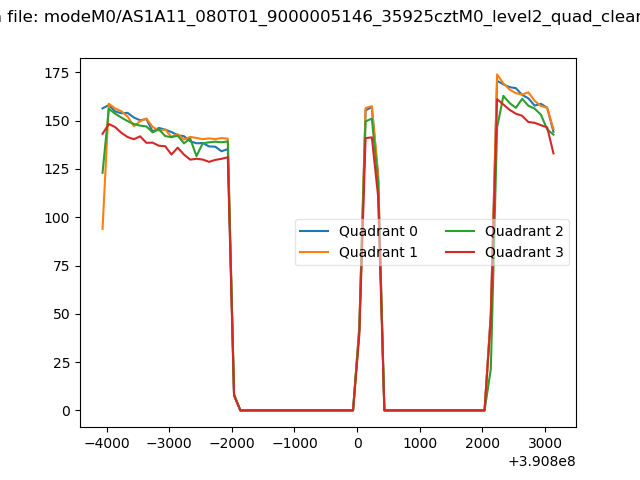
| Quadrant-wise count rates Data is divided into 100 sec bins |
 |
|
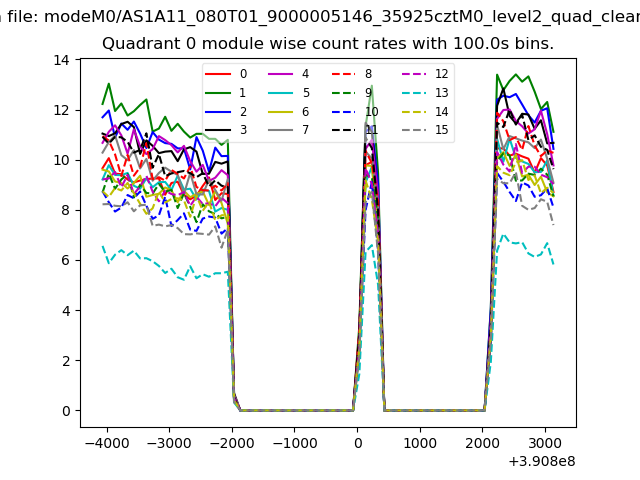
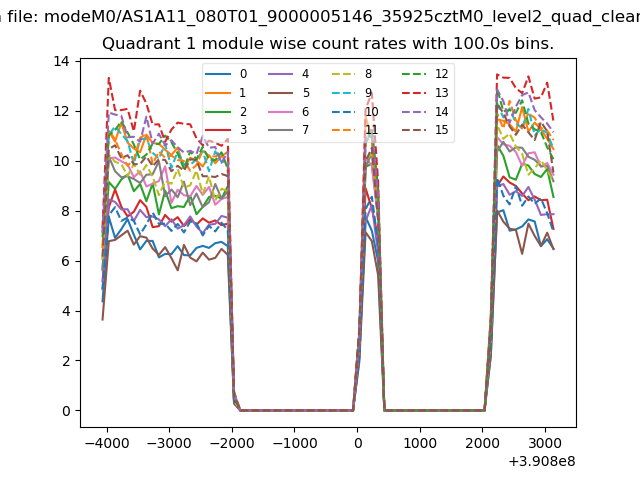
| Module-wise count rates for Quadrant A Data is divided into 100 sec bins |
 |
 |
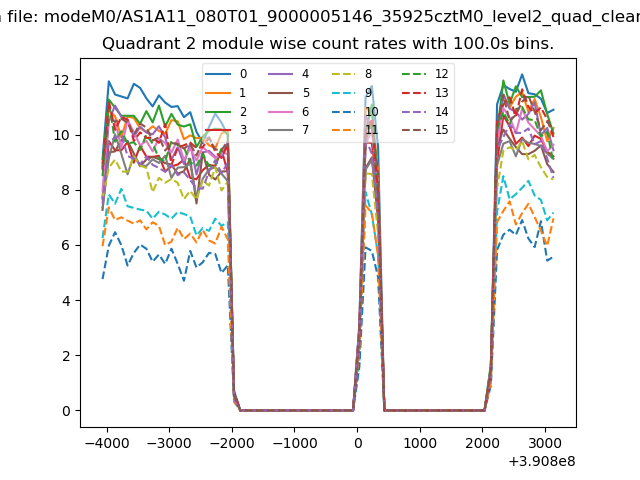
| Module-wise count rates for Quadrant B Data is divided into 100 sec bins |
 |
 |
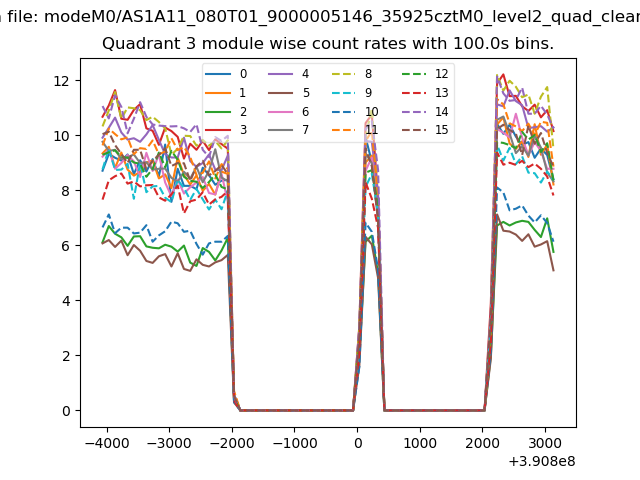
| Module-wise count rates for Quadrant C Data is divided into 100 sec bins |
 |
 |
| Module-wise count rates for Quadrant D Data is divided into 100 sec bins |
 |
 |
| Parameter | Plot |
|---|---|
| CZT HV Monitor | 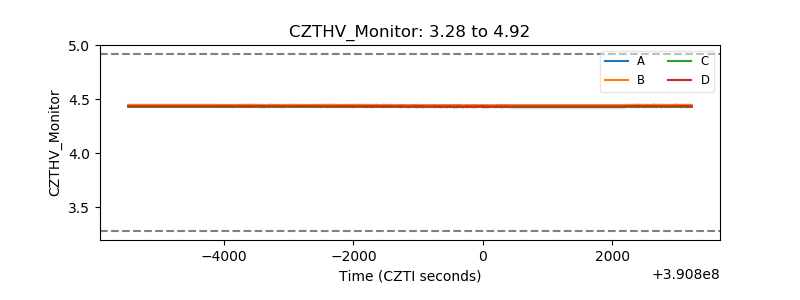 |
| D_VDD | 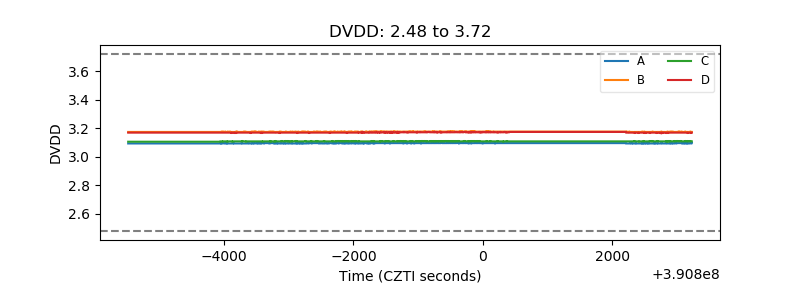 |
| Temperature 1 | 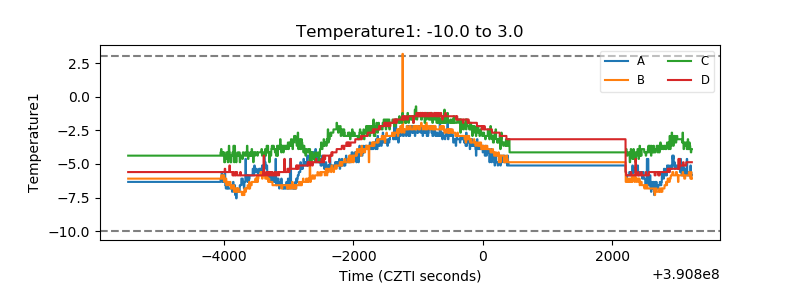 |
| Veto HV Monitor | 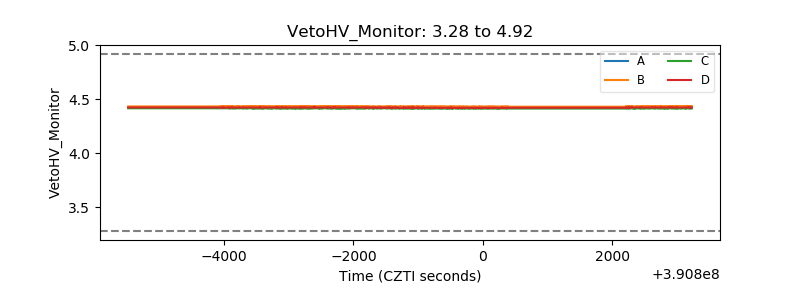 |
| Veto LLD | 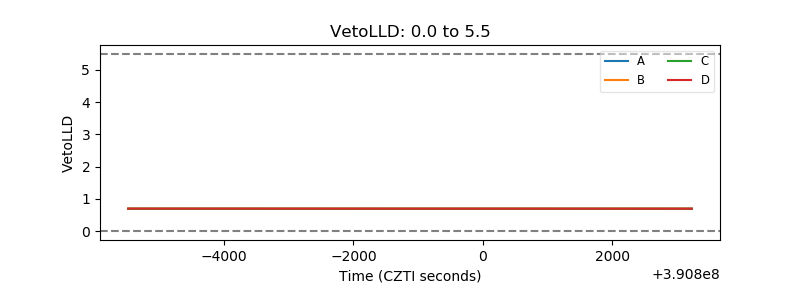 |
| Alpha Counter | 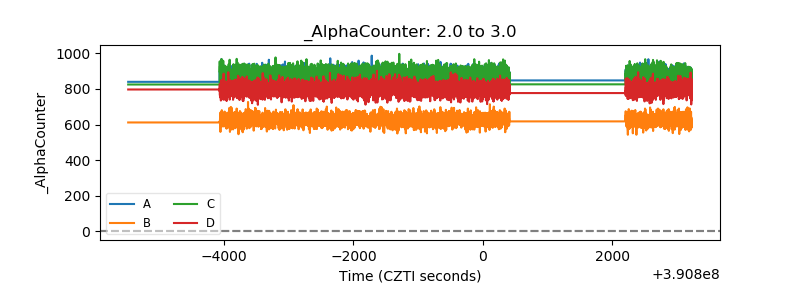 |
| _CPM_Rate | 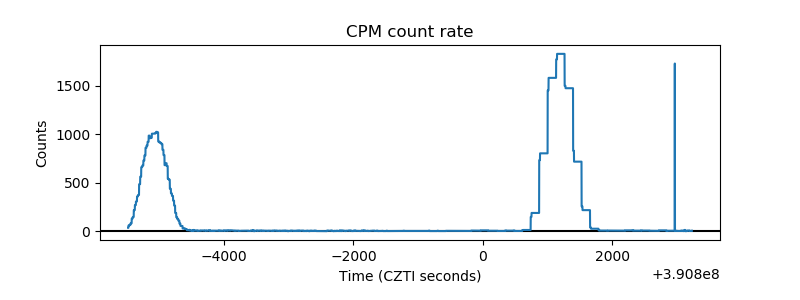 |
| CZT Counter | 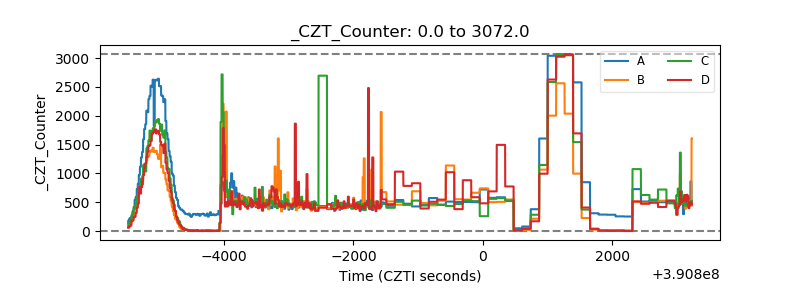 |
| +2.5 Volts monitor | 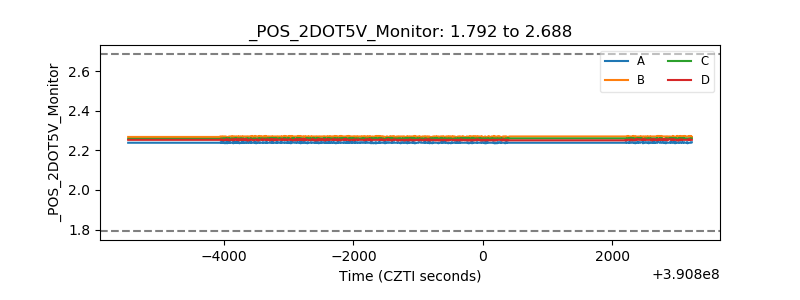 |
| +5 Volts monitor | 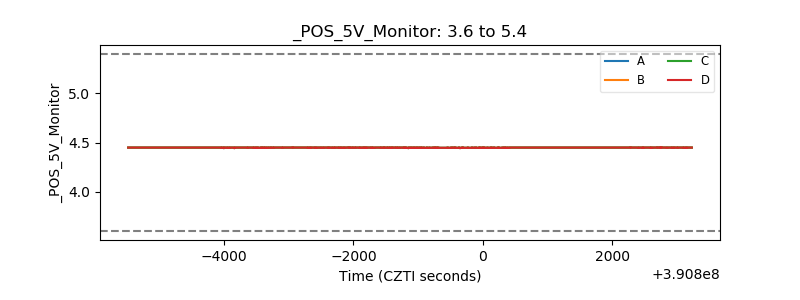 |
| _ROLL_ROT | 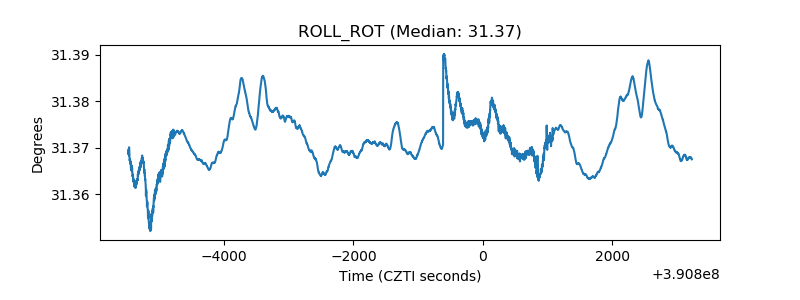 |
| _Roll_DEC | 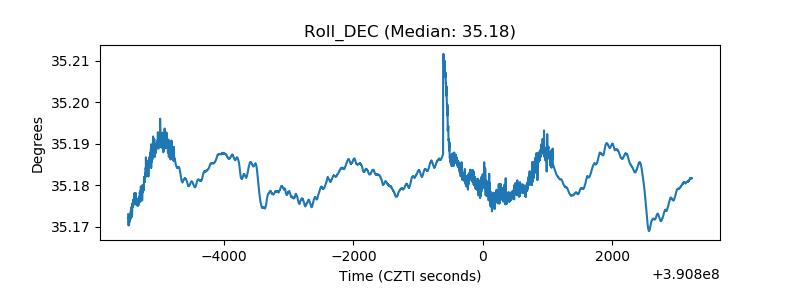 |
| _Roll_RA | 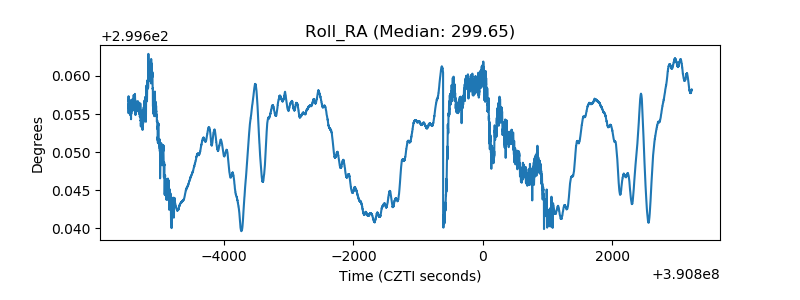 |
| Veto Counter | 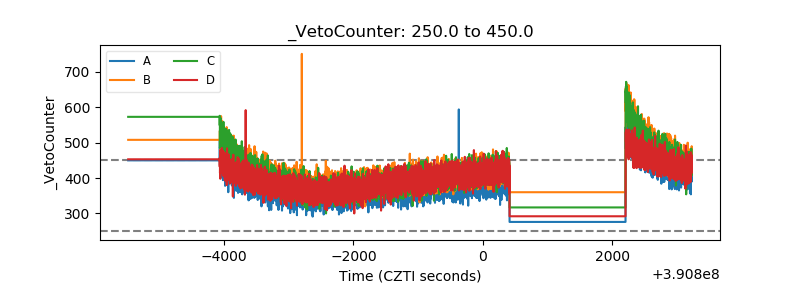 |