| Param | Original file | Final file |
|---|---|---|
| Filename | modeM0/AS1A11_080T01_9000005146_35923cztM0_level2.evt | modeM0/AS1A11_080T01_9000005146_35923cztM0_level2_quad_clean.evt |
| Size (bytes) | 413,870,400 | 76,550,400 |
| Size | 394.7 MB | 73.0 MB |
| Events in quadrant A | 2,784,914 | 494,688 |
| Events in quadrant B | 3,124,592 | 484,762 |
| Events in quadrant C | 3,055,930 | 485,440 |
| Events in quadrant D | 3,191,579 | 465,116 |
| Mode M9 | |||
|---|---|---|---|
| Quadrant | BADHDUFLAG | Total packets | Discarded packets |
| A | 0 | 32 | 0 |
| B | 0 | 32 | 0 |
| C | 0 | 32 | 0 |
| D | 0 | 32 | 0 |
| Mode SS | |||
|---|---|---|---|
| Quadrant | BADHDUFLAG | Total packets | Discarded packets |
| A | 0 | 114 | 0 |
| B | 0 | 114 | 0 |
| C | 0 | 114 | 0 |
| D | 0 | 114 | 0 |
| Mode M0 | |||
|---|---|---|---|
| Quadrant | BADHDUFLAG | Total packets | Discarded packets |
| A | 0 | 11812 | 3 |
| B | 0 | 12856 | 2 |
| C | 0 | 12422 | 2 |
| D | 0 | 13250 | 2 |
| Quadrant | Total seconds | Saturated seconds | Saturation percentage |
|---|---|---|---|
| A | 5549 | 18 | 0.324383% |
| B | 5549 | 186 | 3.351955% |
| C | 5549 | 105 | 1.892233% |
| D | 5549 | 110 | 1.982339% |
Noise dominated data is calculated using 1-second bins in cleaned event files. If a bin has >2000 counts, and if more than 50% of those come from <1% of pixels, then it is considered to be noise-dominated and hence unusable.
| Quadrant | # 1 sec bins | Bins with >0 counts | Bins with >2000 counts | High rate bins dominated by noise | Noise dominated (total time) | Noise dominated (detector-on time) | Marked lightcurve |
|---|---|---|---|---|---|---|---|
| A | 8714 | 5551 | 10 | 10 | 0.11% | 0.18% | 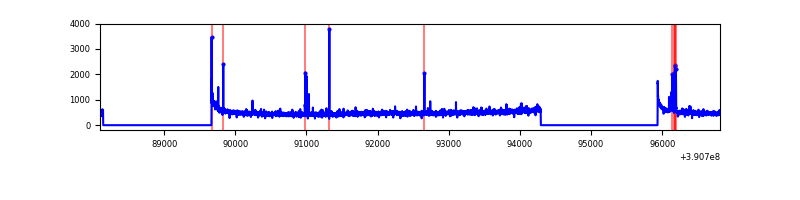 |
| B | 8714 | 5551 | 115 | 115 | 1.32% | 2.07% | 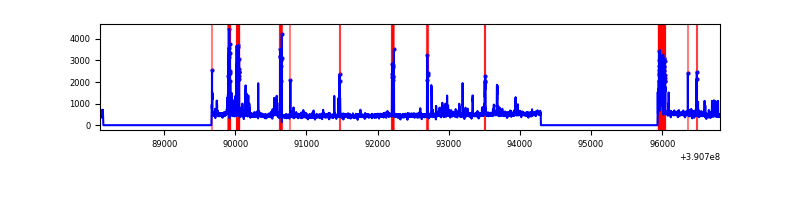 |
| C | 8714 | 5551 | 76 | 76 | 0.87% | 1.37% | 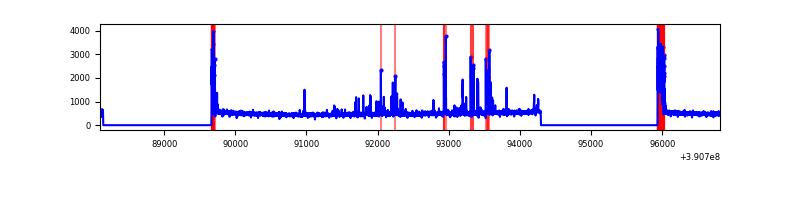 |
| D | 8714 | 5551 | 77 | 77 | 0.88% | 1.39% | 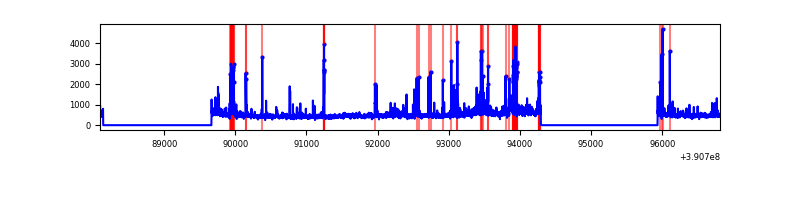 |
Top three noisy pixels from each quadrant. If the there are fewer than three noisy pixels in the level2.evt file, extra rows are filled as -1
| Pixel properties | Quadrant properties | ||||||
|---|---|---|---|---|---|---|---|
| Quadrant | DetID | PixID | Counts | Sigma | Mean | Median | Sigma |
| A | 10 | 83 | 169213 | 1283.3 | 643 | 634 | 131.4 |
| A | 9 | 143 | 100527 | 760.43 | 643 | 634 | 131.4 |
| A | 15 | 169 | 13091 | 94.83 | 643 | 634 | 131.4 |
| B | 5 | 172 | 552475 | 4569.35 | 630 | 617 | 120.8 |
| B | 5 | 255 | 24771 | 199.99 | 630 | 617 | 120.8 |
| B | 0 | 244 | 23005 | 185.37 | 630 | 617 | 120.8 |
| C | 0 | 10 | 285180 | 1951.71 | 618 | 623 | 145.8 |
| C | 15 | 214 | 233496 | 1597.22 | 618 | 623 | 145.8 |
| C | 0 | 207 | 127106 | 867.52 | 618 | 623 | 145.8 |
| D | 10 | 118 | 190283 | 1265.19 | 615 | 600 | 149.9 |
| D | 8 | 195 | 160832 | 1068.75 | 615 | 600 | 149.9 |
| D | 6 | 112 | 103703 | 687.7 | 615 | 600 | 149.9 |
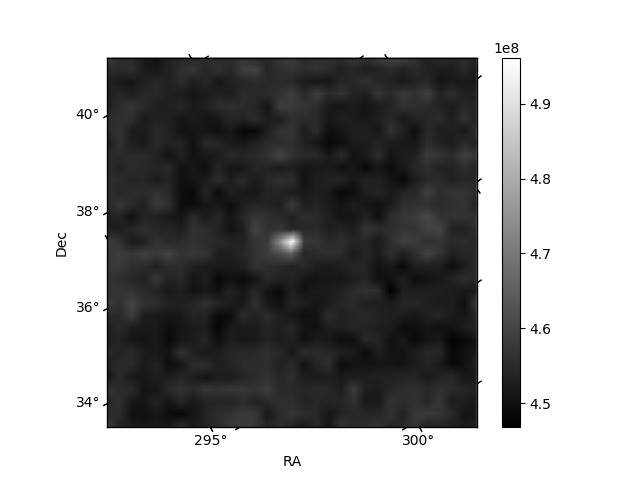
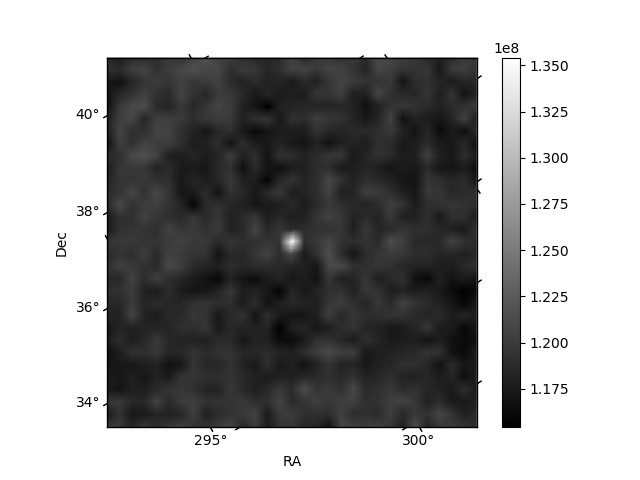
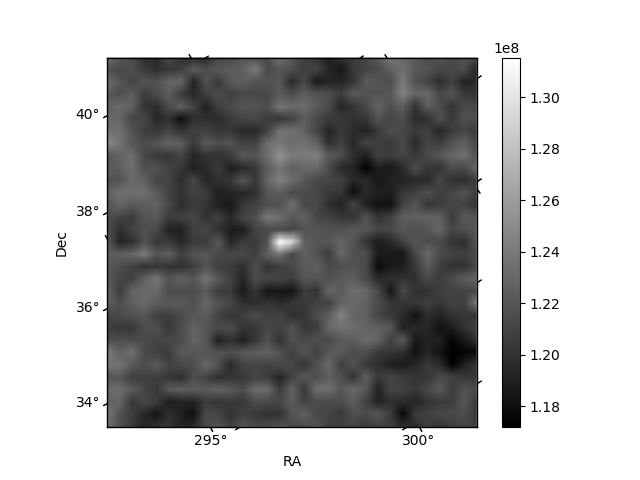
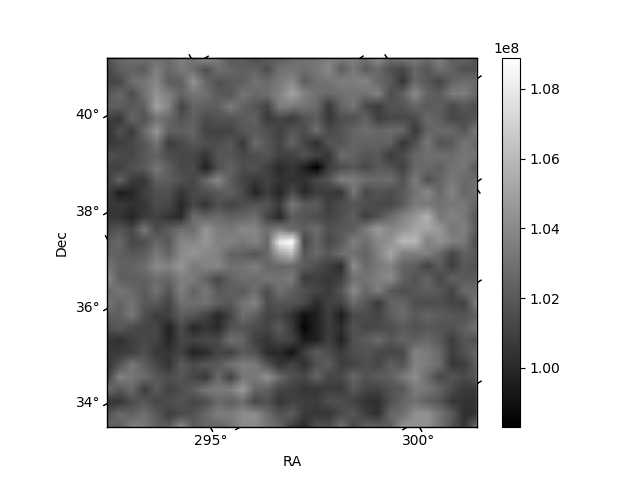
Histogram calculated using DETX and DETY for each event in the final _common_clean file
| Quadrant A | 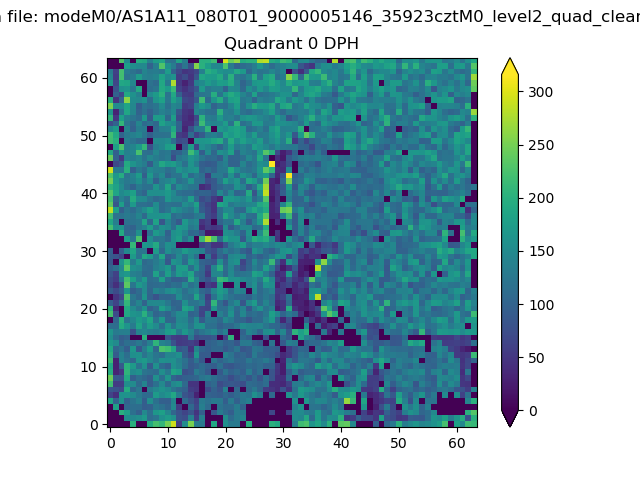 |
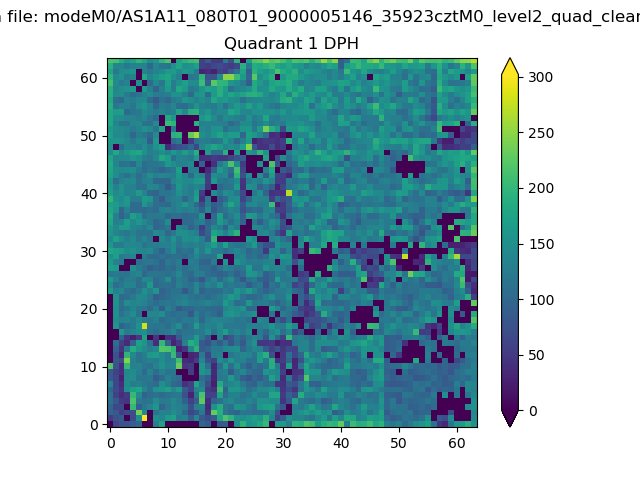 |
Quadrant B |
|---|---|---|---|
| Quadrant D | 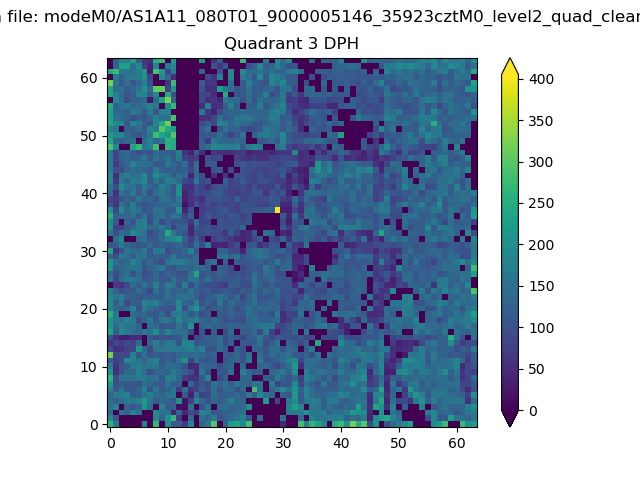 |
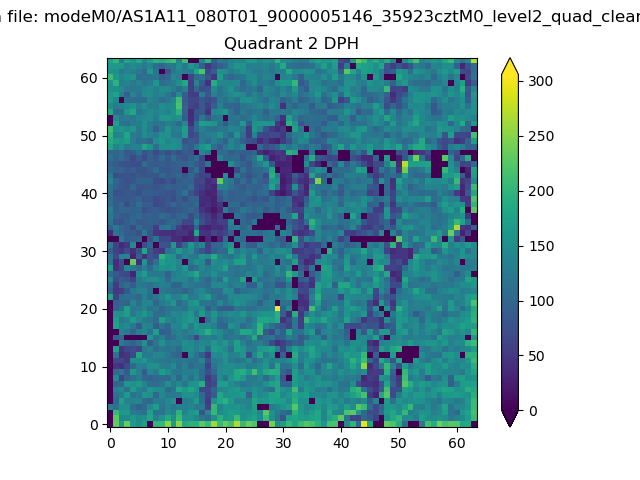 |
Quadrant C |
| Plot type | Count rate plots | Images |
|---|---|---|
| Comparison with Poisson distribution Blue bars denote a histogram of data divided into 1 sec bins. Red curve is a Poisson curve with rate = median count rate of data. |
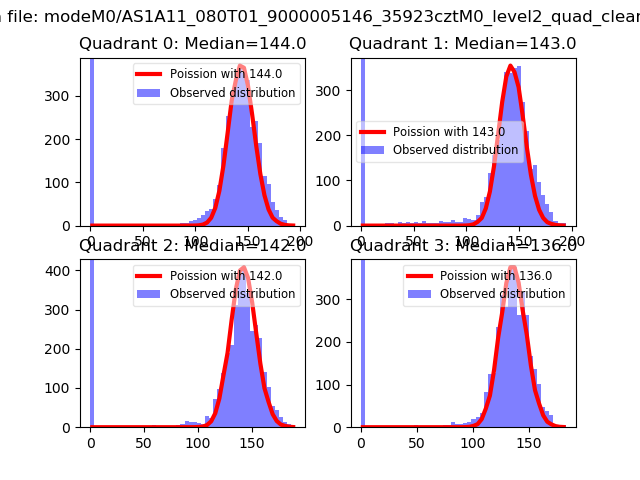 |
 |
| Quadrant-wise count rates Data is divided into 100 sec bins |
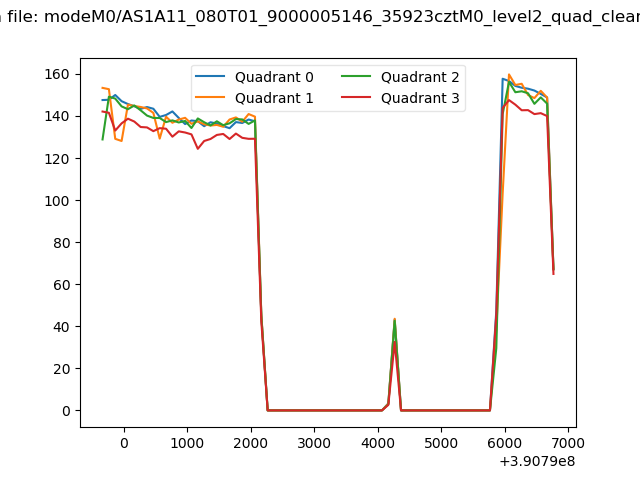 |
|
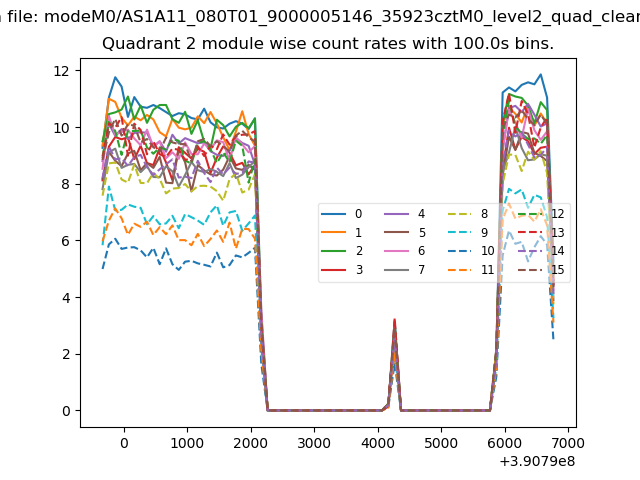
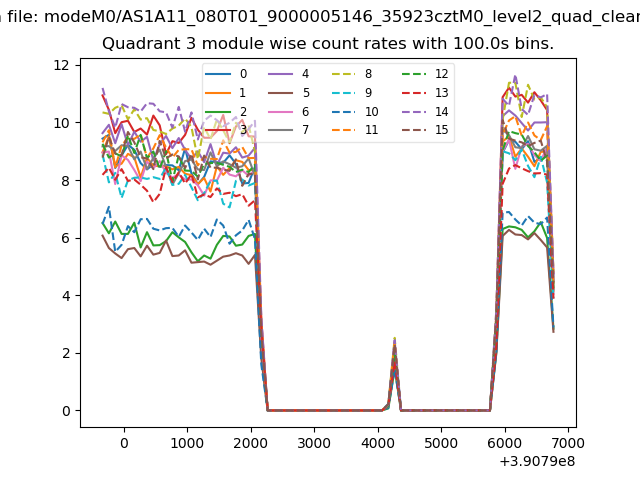
| Module-wise count rates for Quadrant A Data is divided into 100 sec bins |
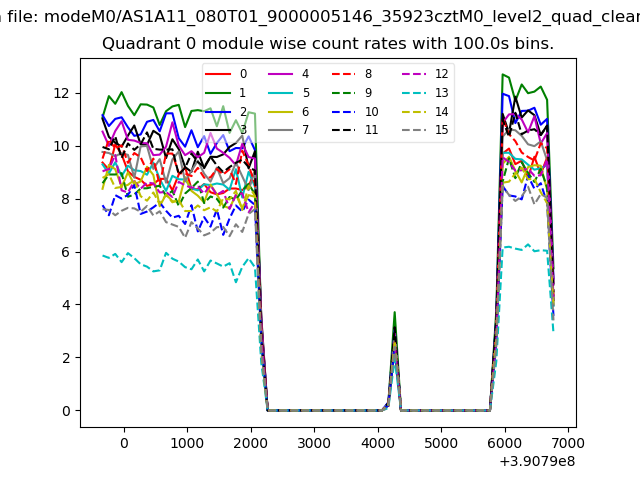 |
 |
| Module-wise count rates for Quadrant B Data is divided into 100 sec bins |
 |
 |
| Module-wise count rates for Quadrant C Data is divided into 100 sec bins |
 |
 |
| Module-wise count rates for Quadrant D Data is divided into 100 sec bins |
 |
 |
| Parameter | Plot |
|---|---|
| CZT HV Monitor | 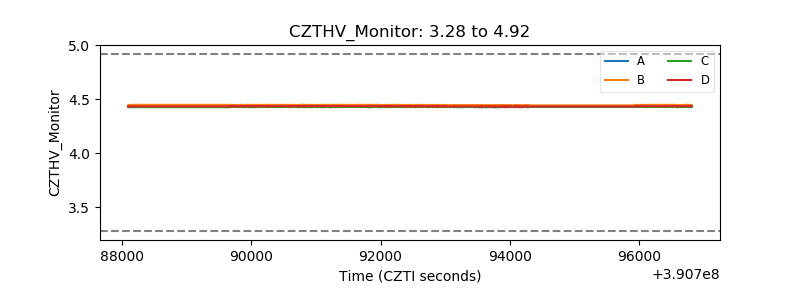 |
| D_VDD | 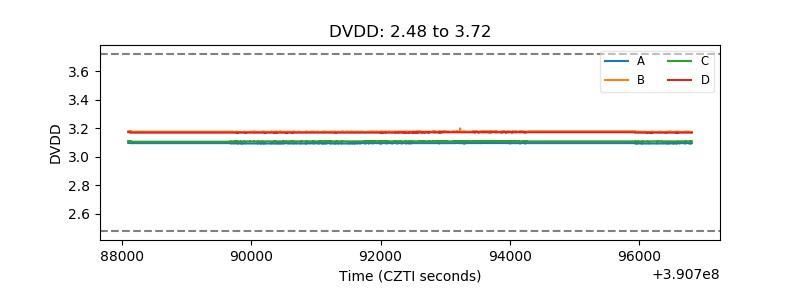 |
| Temperature 1 | 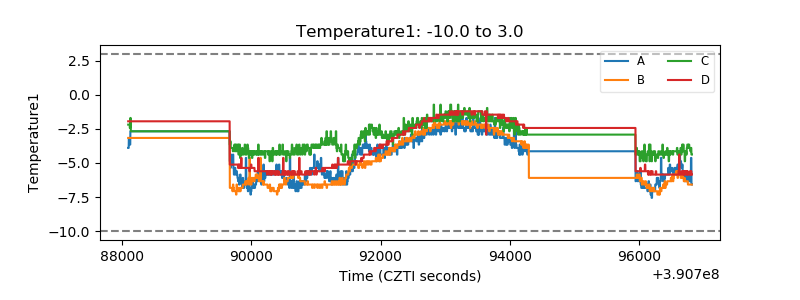 |
| Veto HV Monitor | 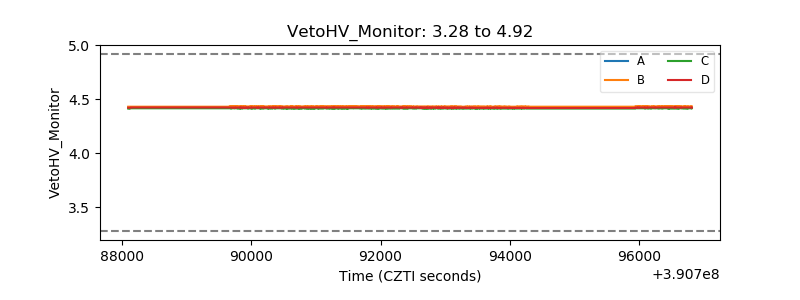 |
| Veto LLD | 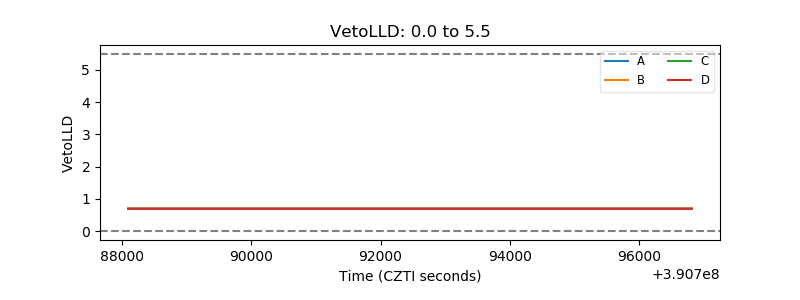 |
| Alpha Counter | 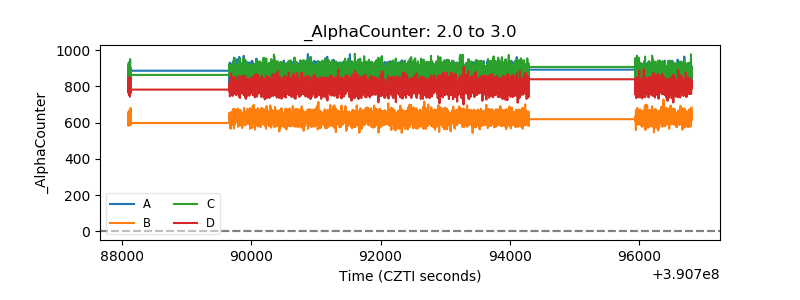 |
| _CPM_Rate | 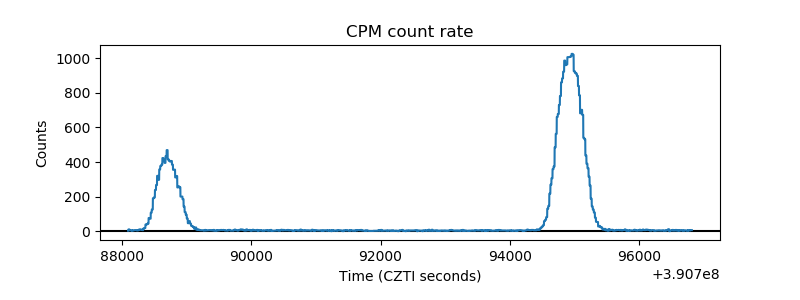 |
| CZT Counter | 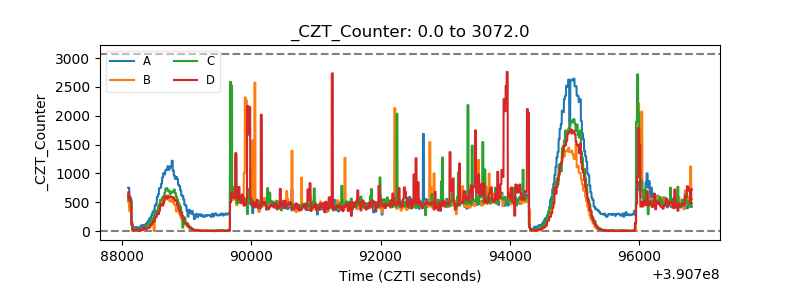 |
| +2.5 Volts monitor | 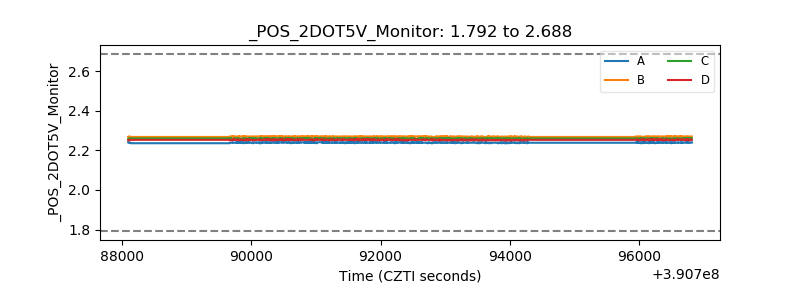 |
| +5 Volts monitor | 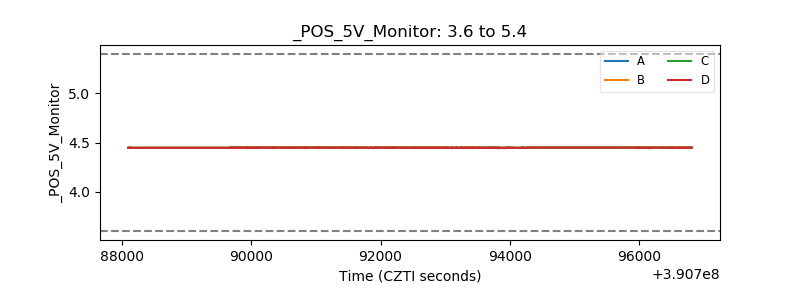 |
| _ROLL_ROT | 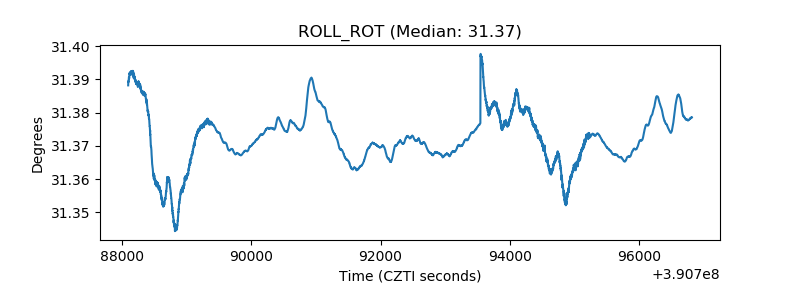 |
| _Roll_DEC | 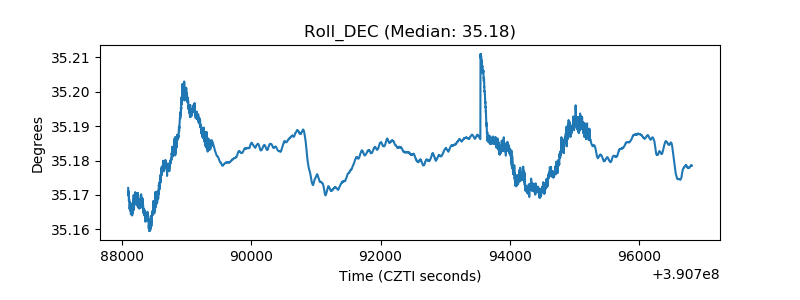 |
| _Roll_RA | 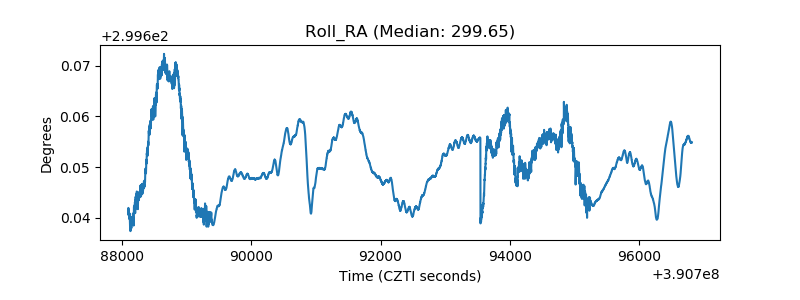 |
| Veto Counter | 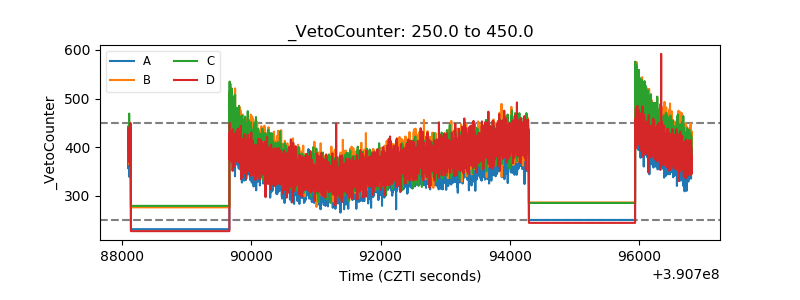 |