| Param | Original file | Final file |
|---|---|---|
| Filename | modeM0/AS1A11_080T01_9000005146_35922cztM0_level2.evt | modeM0/AS1A11_080T01_9000005146_35922cztM0_level2_quad_clean.evt |
| Size (bytes) | 416,243,520 | 85,855,680 |
| Size | 397.0 MB | 81.9 MB |
| Events in quadrant A | 2,866,218 | 558,516 |
| Events in quadrant B | 3,197,349 | 552,095 |
| Events in quadrant C | 2,963,918 | 552,132 |
| Events in quadrant D | 3,179,321 | 527,067 |
| Mode M9 | |||
|---|---|---|---|
| Quadrant | BADHDUFLAG | Total packets | Discarded packets |
| A | 0 | 29 | 0 |
| B | 0 | 29 | 0 |
| C | 0 | 29 | 0 |
| D | 0 | 29 | 0 |
| Mode SS | |||
|---|---|---|---|
| Quadrant | BADHDUFLAG | Total packets | Discarded packets |
| A | 0 | 122 | 0 |
| B | 0 | 122 | 0 |
| C | 0 | 122 | 0 |
| D | 0 | 122 | 0 |
| Mode M0 | |||
|---|---|---|---|
| Quadrant | BADHDUFLAG | Total packets | Discarded packets |
| A | 0 | 12277 | 3 |
| B | 0 | 13304 | 2 |
| C | 0 | 12344 | 2 |
| D | 0 | 13471 | 2 |
| Quadrant | Total seconds | Saturated seconds | Saturation percentage |
|---|---|---|---|
| A | 5867 | 18 | 0.306801% |
| B | 5867 | 122 | 2.079427% |
| C | 5867 | 47 | 0.801091% |
| D | 5867 | 86 | 1.465826% |
Noise dominated data is calculated using 1-second bins in cleaned event files. If a bin has >2000 counts, and if more than 50% of those come from <1% of pixels, then it is considered to be noise-dominated and hence unusable.
| Quadrant | # 1 sec bins | Bins with >0 counts | Bins with >2000 counts | High rate bins dominated by noise | Noise dominated (total time) | Noise dominated (detector-on time) | Marked lightcurve |
|---|---|---|---|---|---|---|---|
| A | 8792 | 5869 | 2 | 2 | 0.02% | 0.03% | 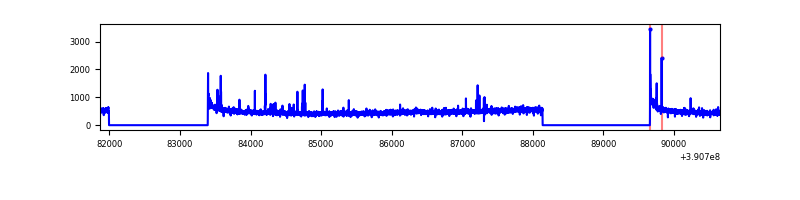 |
| B | 8792 | 5869 | 74 | 74 | 0.84% | 1.26% | 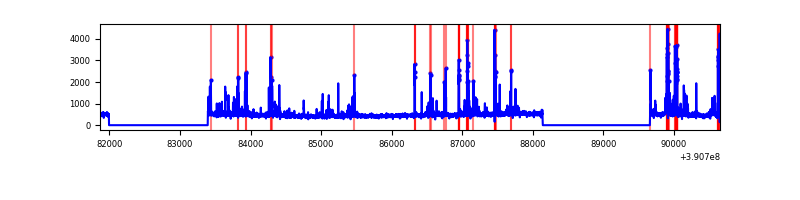 |
| C | 8792 | 5869 | 34 | 34 | 0.39% | 0.58% | 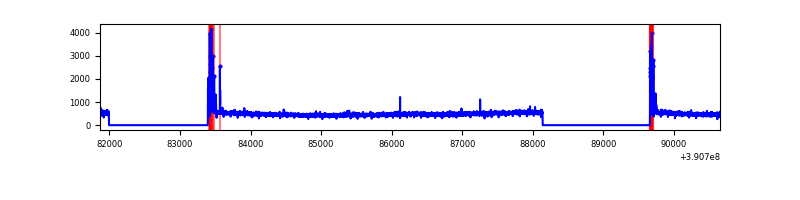 |
| D | 8792 | 5869 | 61 | 61 | 0.69% | 1.04% | 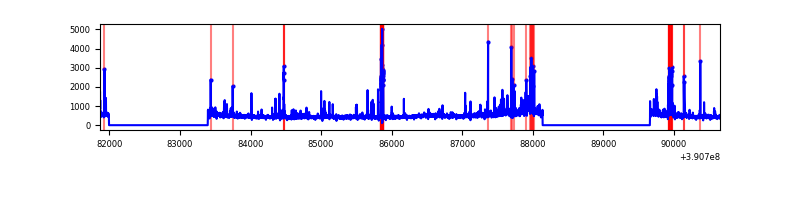 |
Top three noisy pixels from each quadrant. If the there are fewer than three noisy pixels in the level2.evt file, extra rows are filled as -1
| Pixel properties | Quadrant properties | ||||||
|---|---|---|---|---|---|---|---|
| Quadrant | DetID | PixID | Counts | Sigma | Mean | Median | Sigma |
| A | 10 | 83 | 171058 | 1232.54 | 677 | 664 | 138.2 |
| A | 9 | 143 | 45064 | 321.17 | 677 | 664 | 138.2 |
| A | 15 | 223 | 11298 | 76.92 | 677 | 664 | 138.2 |
| B | 5 | 172 | 484281 | 3735.01 | 668 | 653 | 129.5 |
| B | 5 | 255 | 34647 | 262.53 | 668 | 653 | 129.5 |
| B | 0 | 213 | 16428 | 121.83 | 668 | 653 | 129.5 |
| C | 15 | 214 | 245483 | 1600.19 | 656 | 662 | 153.0 |
| C | 0 | 10 | 157358 | 1024.19 | 656 | 662 | 153.0 |
| C | 0 | 207 | 5257 | 30.03 | 656 | 662 | 153.0 |
| D | 10 | 118 | 122890 | 765.51 | 652 | 636 | 159.7 |
| D | 8 | 195 | 108729 | 676.84 | 652 | 636 | 159.7 |
| D | 13 | 249 | 108059 | 672.65 | 652 | 636 | 159.7 |
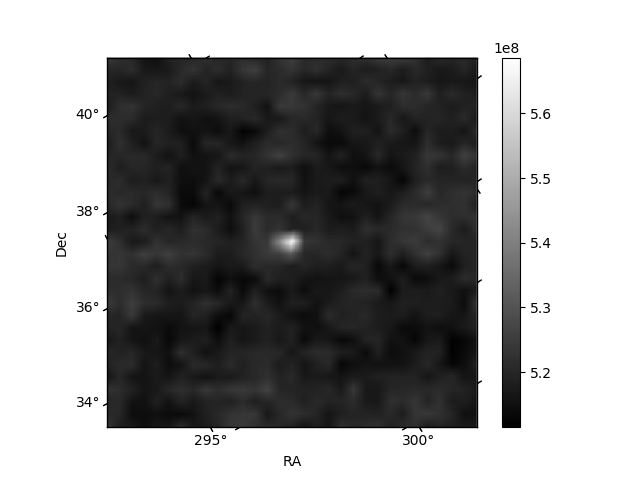
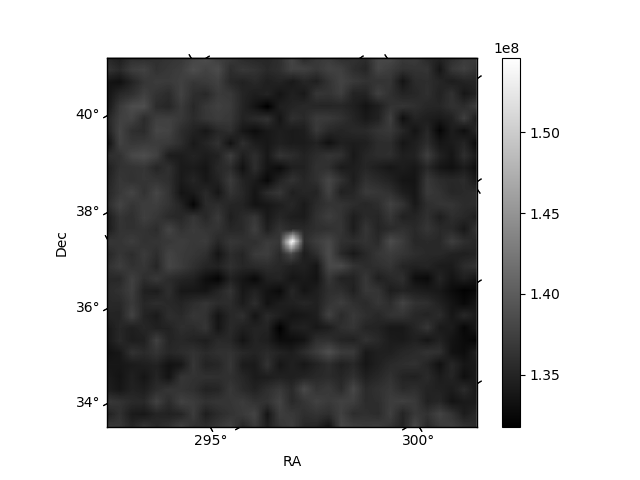
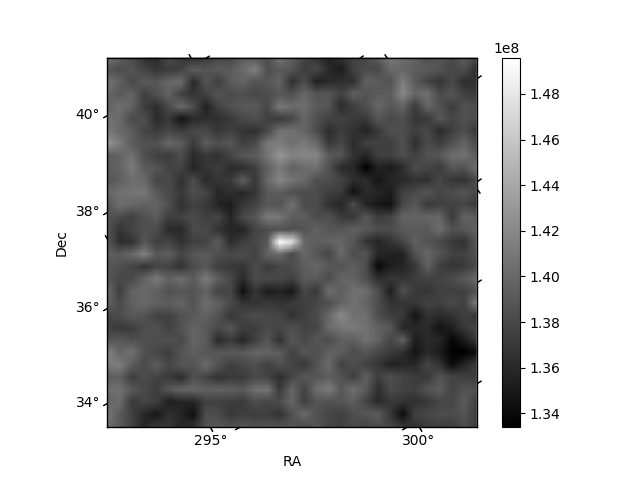
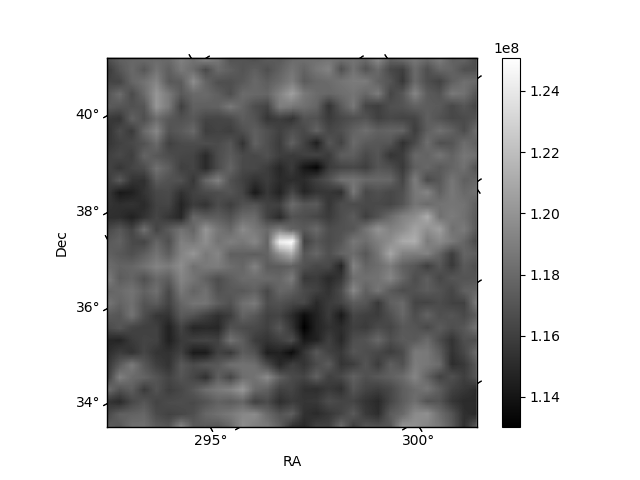
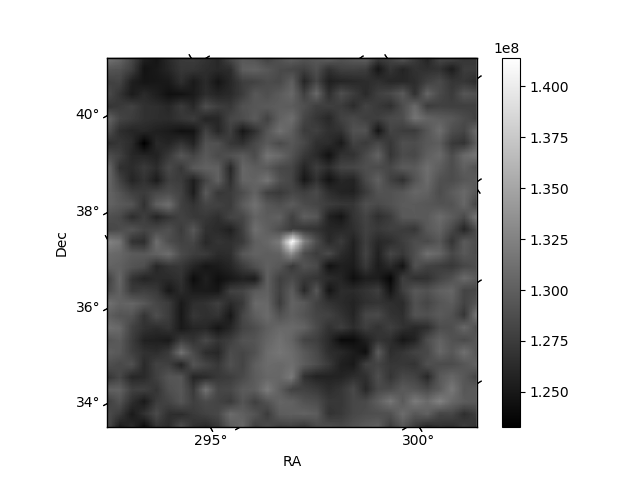
Histogram calculated using DETX and DETY for each event in the final _common_clean file
| Quadrant A | 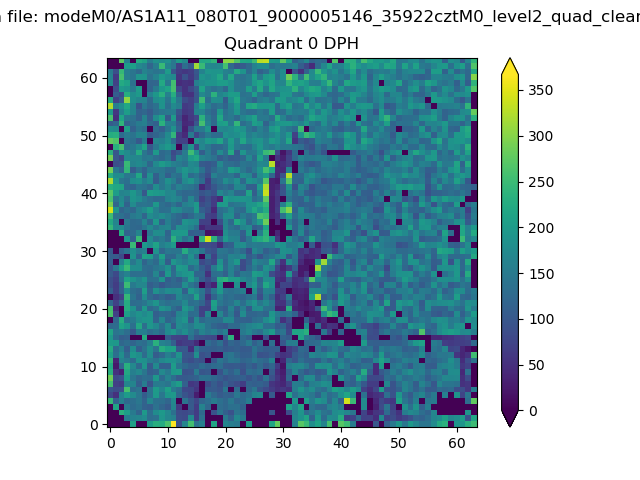 |
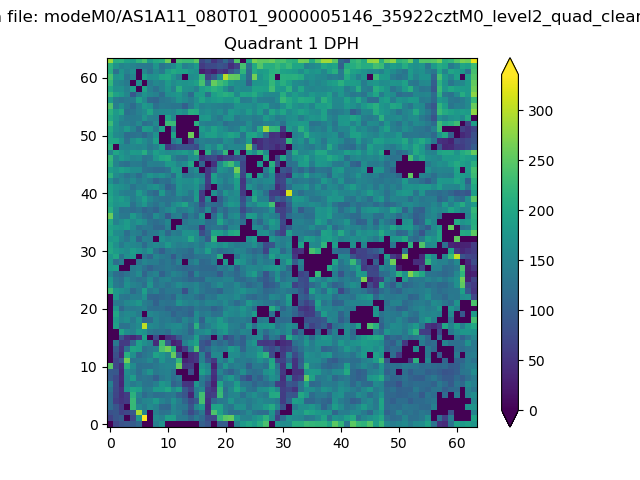 |
Quadrant B |
|---|---|---|---|
| Quadrant D | 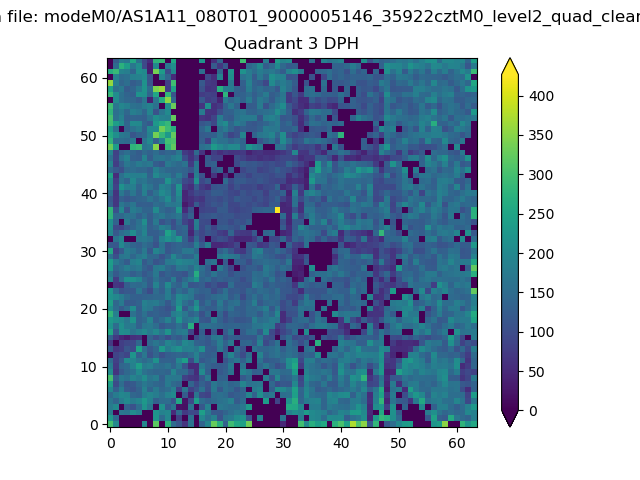 |
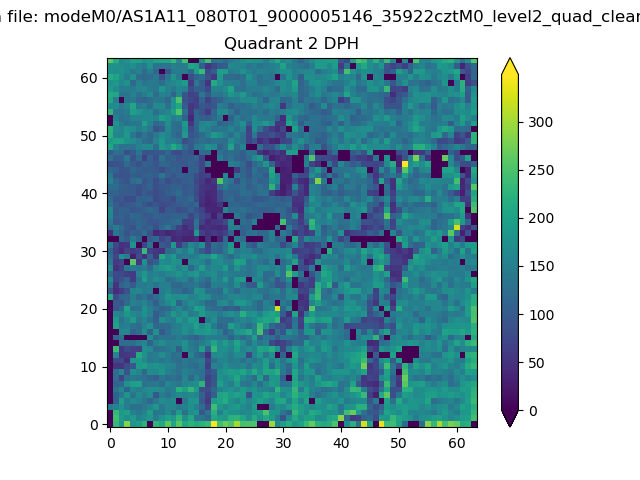 |
Quadrant C |
| Plot type | Count rate plots | Images |
|---|---|---|
| Comparison with Poisson distribution Blue bars denote a histogram of data divided into 1 sec bins. Red curve is a Poisson curve with rate = median count rate of data. |
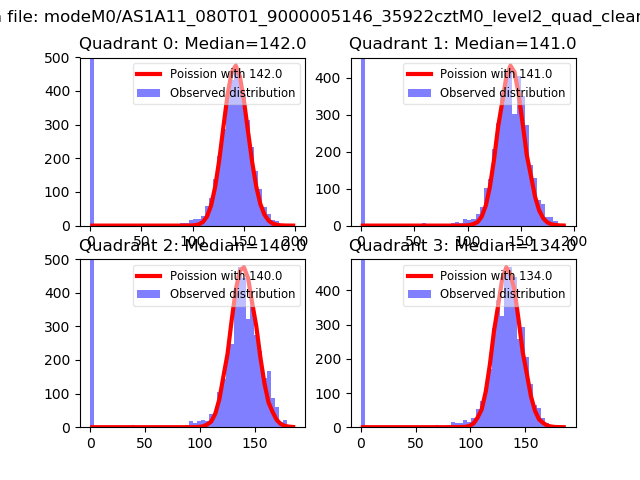 |
 |
| Quadrant-wise count rates Data is divided into 100 sec bins |
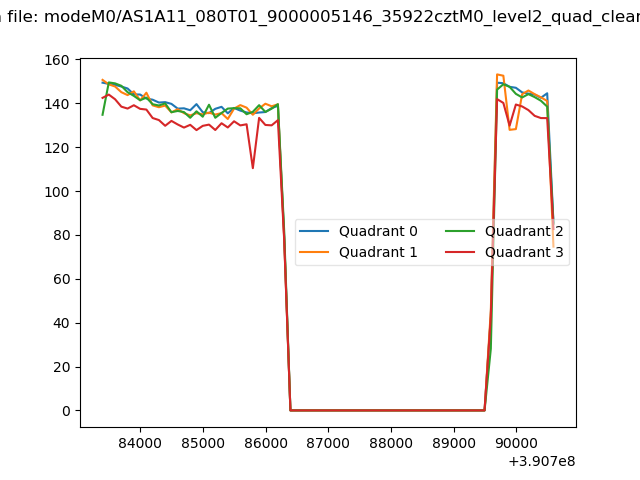 |
|
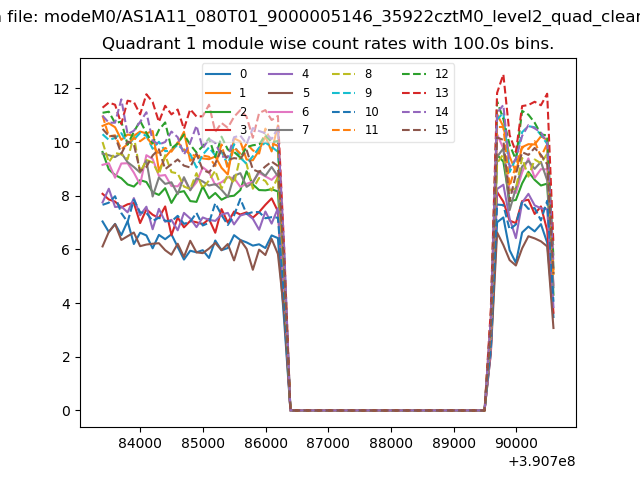
| Module-wise count rates for Quadrant A Data is divided into 100 sec bins |
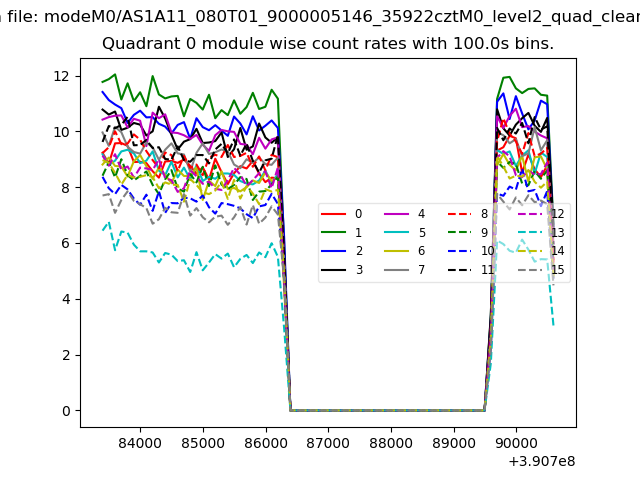 |
 |
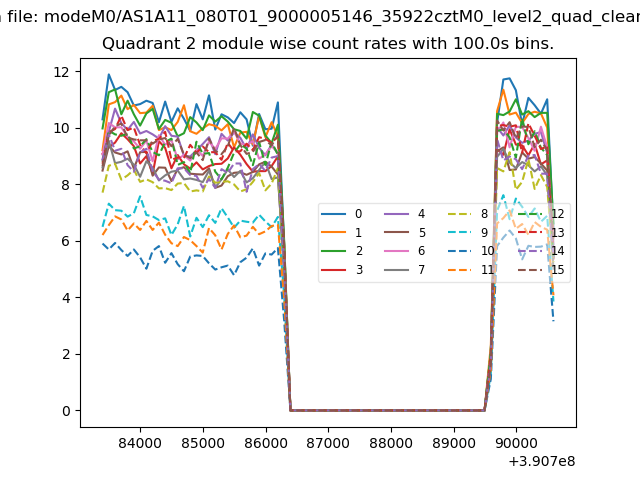
| Module-wise count rates for Quadrant B Data is divided into 100 sec bins |
 |
 |
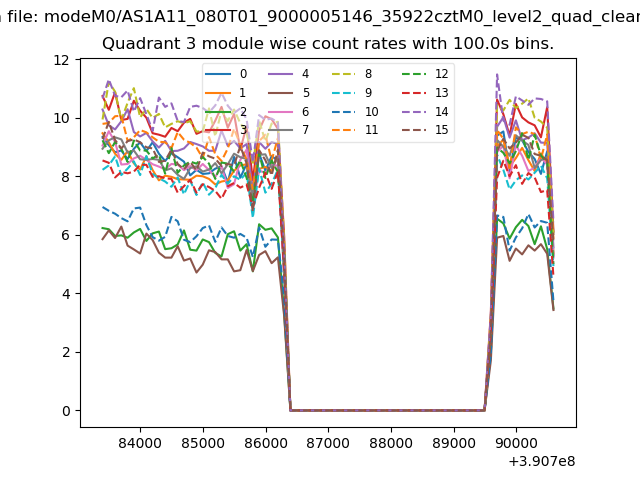
| Module-wise count rates for Quadrant C Data is divided into 100 sec bins |
 |
 |
| Module-wise count rates for Quadrant D Data is divided into 100 sec bins |
 |
 |
| Parameter | Plot |
|---|---|
| CZT HV Monitor | 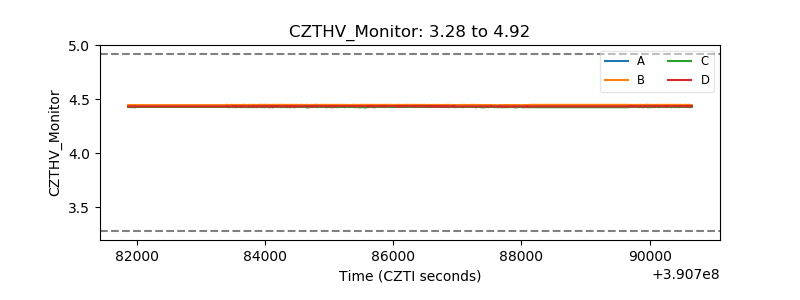 |
| D_VDD | 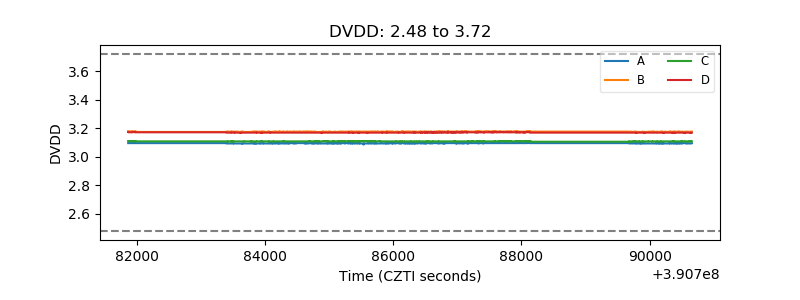 |
| Temperature 1 | 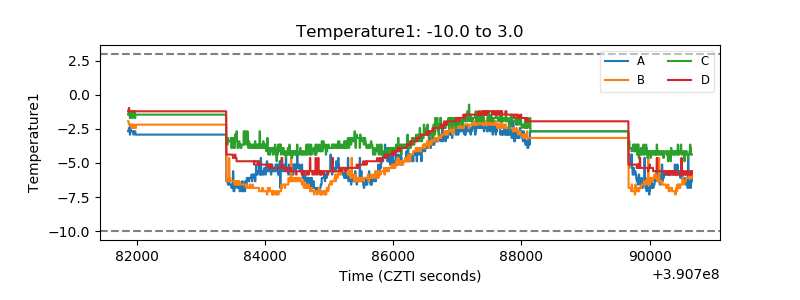 |
| Veto HV Monitor | 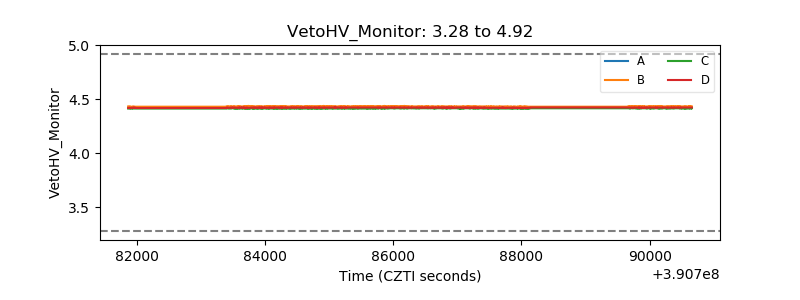 |
| Veto LLD | 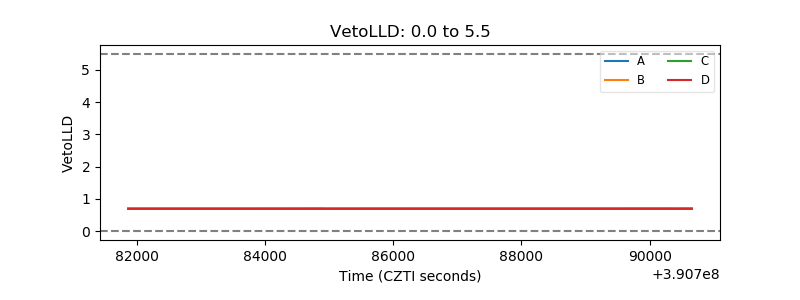 |
| Alpha Counter | 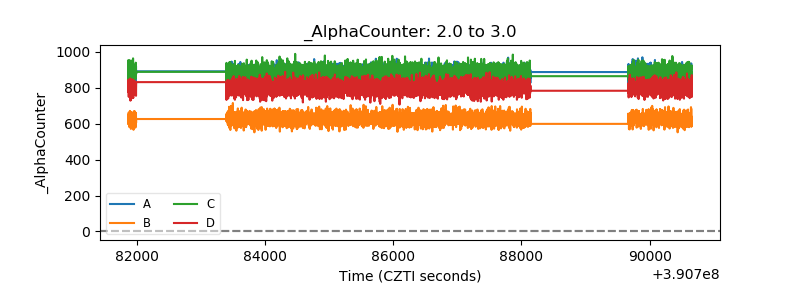 |
| _CPM_Rate | 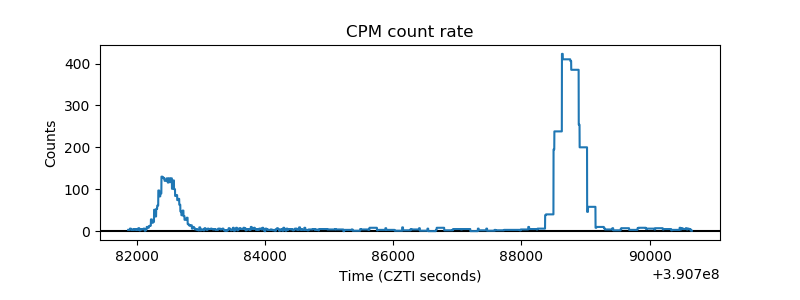 |
| CZT Counter | 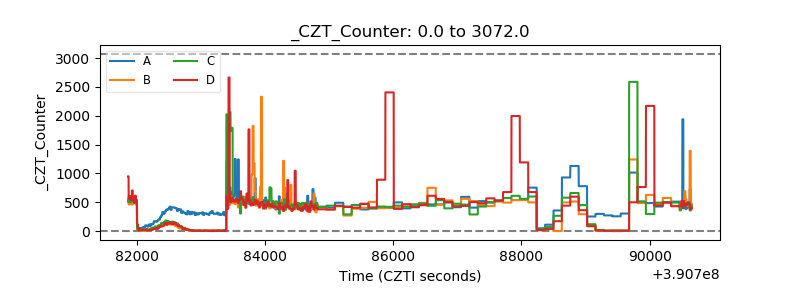 |
| +2.5 Volts monitor | 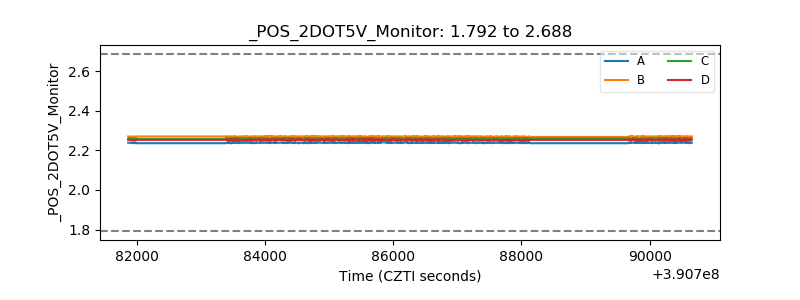 |
| +5 Volts monitor | 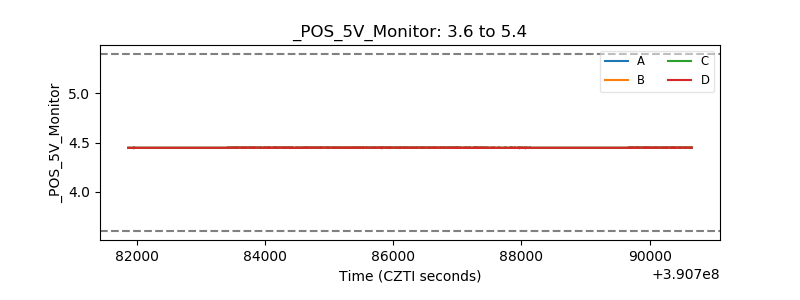 |
| _ROLL_ROT | 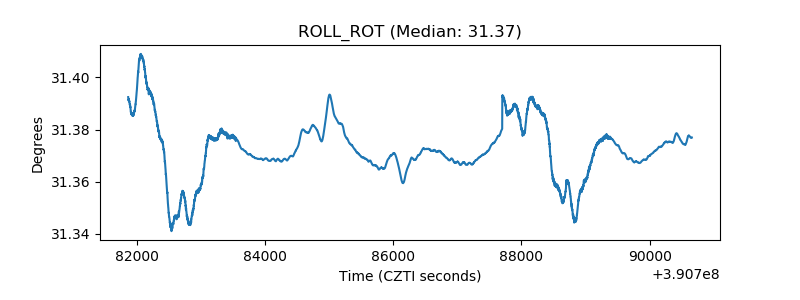 |
| _Roll_DEC | 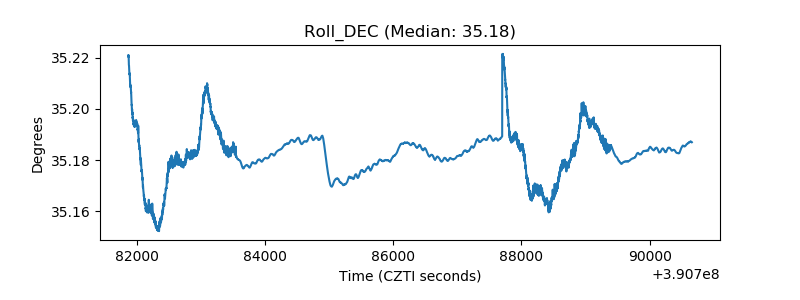 |
| _Roll_RA | 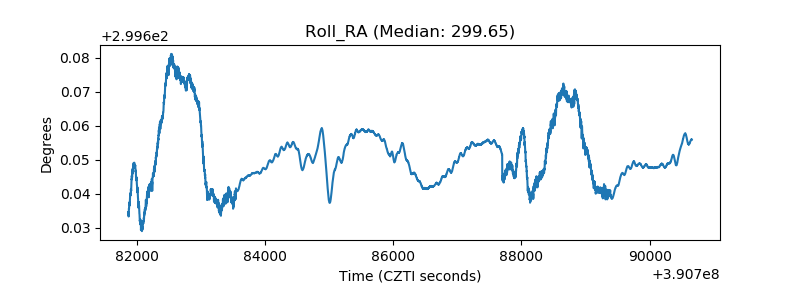 |
| Veto Counter | 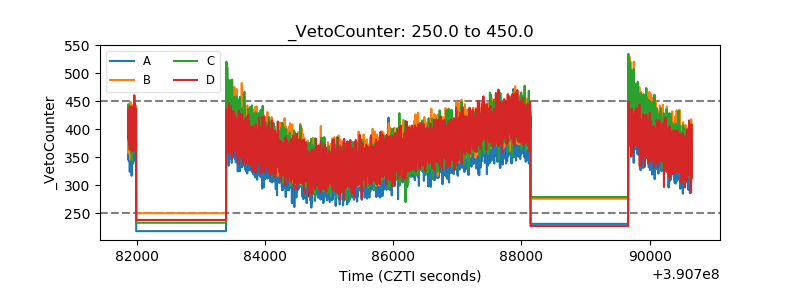 |