| Param | Original file | Final file |
|---|---|---|
| Filename | modeM0/AS1A11_080T01_9000005146_35921cztM0_level2.evt | modeM0/AS1A11_080T01_9000005146_35921cztM0_level2_quad_clean.evt |
| Size (bytes) | 848,283,840 | 178,992,000 |
| Size | 809.0 MB | 170.7 MB |
| Events in quadrant A | 5,512,013 | 1,198,757 |
| Events in quadrant B | 6,303,355 | 1,179,735 |
| Events in quadrant C | 5,631,976 | 1,180,949 |
| Events in quadrant D | 7,504,665 | 1,106,275 |
| Mode M9 | |||
|---|---|---|---|
| Quadrant | BADHDUFLAG | Total packets | Discarded packets |
| A | 0 | 31 | 0 |
| B | 0 | 31 | 0 |
| C | 0 | 31 | 0 |
| D | 0 | 32 | 0 |
| Mode SS | |||
|---|---|---|---|
| Quadrant | BADHDUFLAG | Total packets | Discarded packets |
| A | 0 | 220 | 0 |
| B | 0 | 220 | 0 |
| C | 0 | 220 | 0 |
| D | 0 | 220 | 0 |
| Mode M0 | |||
|---|---|---|---|
| Quadrant | BADHDUFLAG | Total packets | Discarded packets |
| A | 0 | 23218 | 4 |
| B | 0 | 25726 | 3 |
| C | 0 | 23148 | 3 |
| D | 0 | 29609 | 3 |
| Quadrant | Total seconds | Saturated seconds | Saturation percentage |
|---|---|---|---|
| A | 10924 | 45 | 0.411937% |
| B | 10924 | 304 | 2.782863% |
| C | 10924 | 97 | 0.887953% |
| D | 10924 | 451 | 4.128524% |
Noise dominated data is calculated using 1-second bins in cleaned event files. If a bin has >2000 counts, and if more than 50% of those come from <1% of pixels, then it is considered to be noise-dominated and hence unusable.
| Quadrant | # 1 sec bins | Bins with >0 counts | Bins with >2000 counts | High rate bins dominated by noise | Noise dominated (total time) | Noise dominated (detector-on time) | Marked lightcurve |
|---|---|---|---|---|---|---|---|
| A | 13639 | 10926 | 26 | 26 | 0.19% | 0.24% | 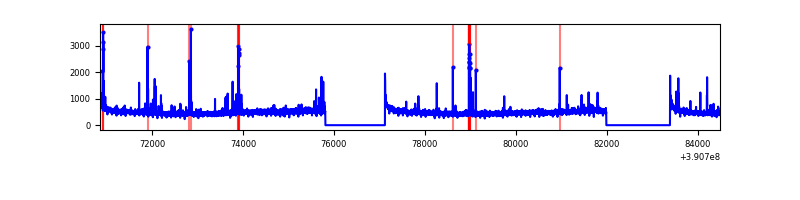 |
| B | 13639 | 10926 | 198 | 198 | 1.45% | 1.81% | 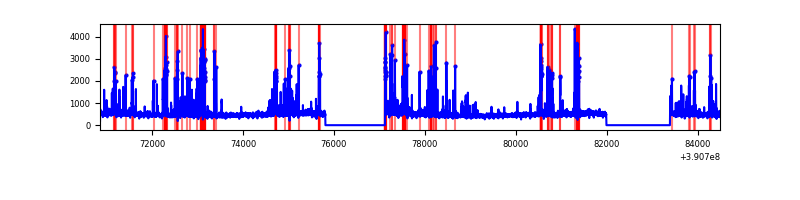 |
| C | 13639 | 10926 | 66 | 66 | 0.48% | 0.60% | 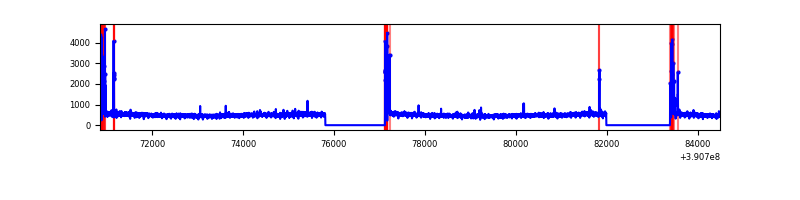 |
| D | 13639 | 10926 | 355 | 355 | 2.60% | 3.25% | 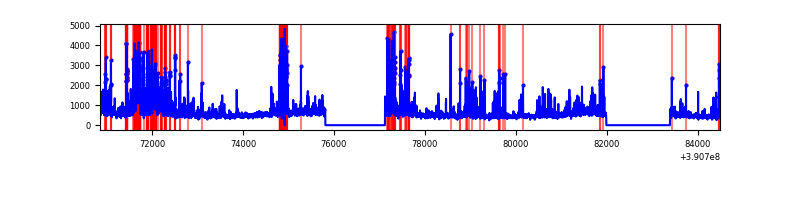 |
Top three noisy pixels from each quadrant. If the there are fewer than three noisy pixels in the level2.evt file, extra rows are filled as -1
| Pixel properties | Quadrant properties | ||||||
|---|---|---|---|---|---|---|---|
| Quadrant | DetID | PixID | Counts | Sigma | Mean | Median | Sigma |
| A | 10 | 83 | 287975 | 1092.74 | 1283 | 1259 | 262.4 |
| A | 9 | 143 | 220044 | 833.84 | 1283 | 1259 | 262.4 |
| A | 13 | 6 | 23636 | 85.28 | 1283 | 1259 | 262.4 |
| B | 5 | 172 | 1132054 | 4684.99 | 1256 | 1230 | 241.4 |
| B | 5 | 255 | 99115 | 405.54 | 1256 | 1230 | 241.4 |
| B | 0 | 213 | 67981 | 276.55 | 1256 | 1230 | 241.4 |
| C | 15 | 214 | 453633 | 1563.85 | 1238 | 1252 | 289.3 |
| C | 0 | 10 | 317100 | 1091.87 | 1238 | 1252 | 289.3 |
| C | 0 | 207 | 40612 | 136.07 | 1238 | 1252 | 289.3 |
| D | 12 | 227 | 787068 | 2645.58 | 1218 | 1188 | 297.1 |
| D | 12 | 6 | 500848 | 1682.05 | 1218 | 1188 | 297.1 |
| D | 8 | 195 | 485926 | 1631.82 | 1218 | 1188 | 297.1 |
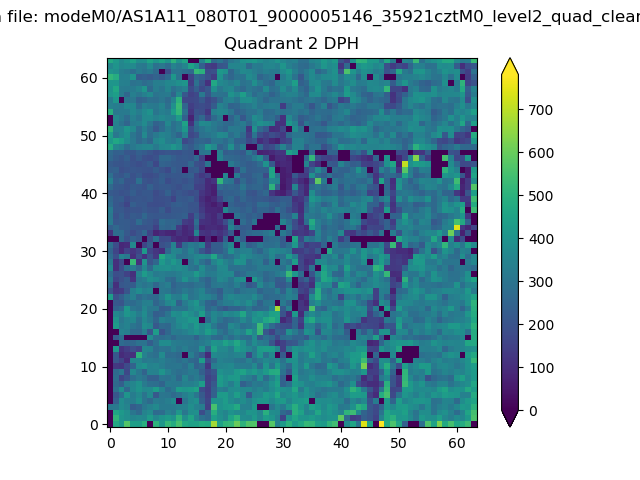
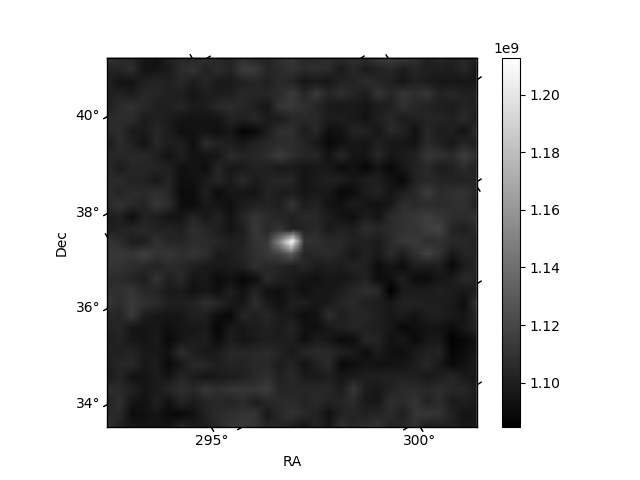
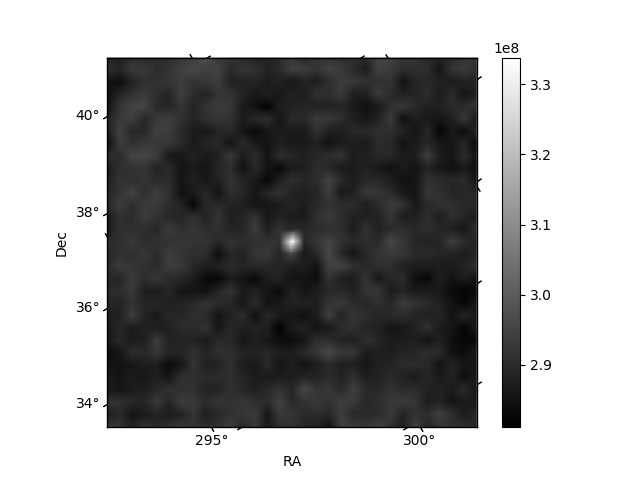
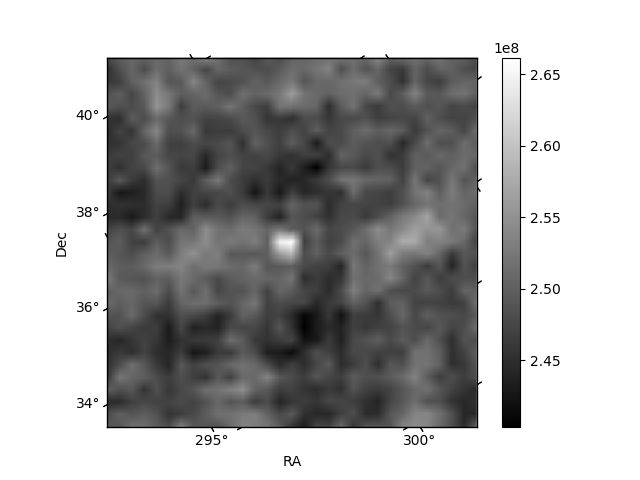
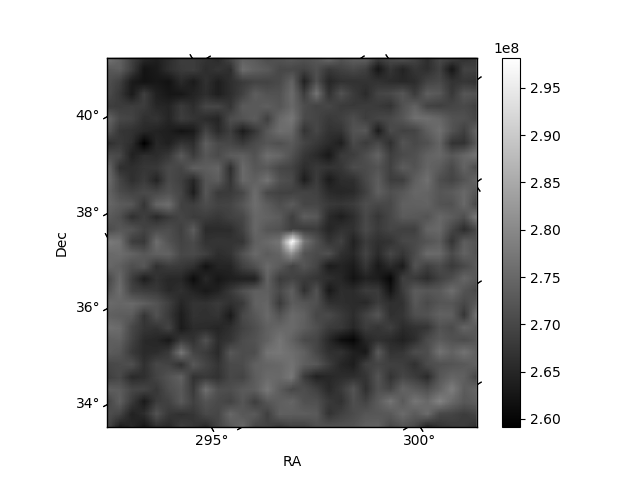
Histogram calculated using DETX and DETY for each event in the final _common_clean file
| Quadrant A | 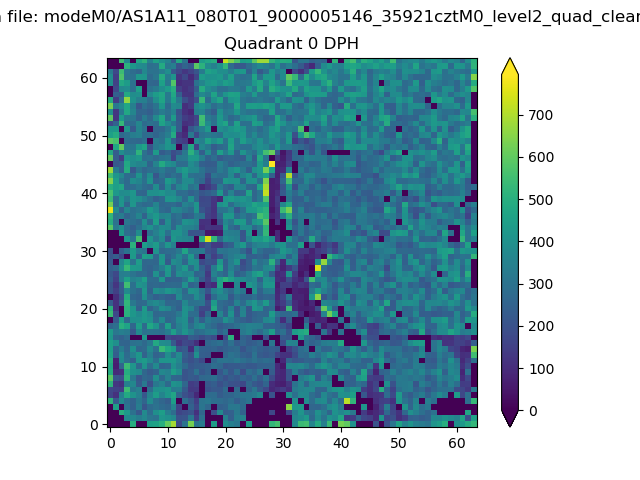 |
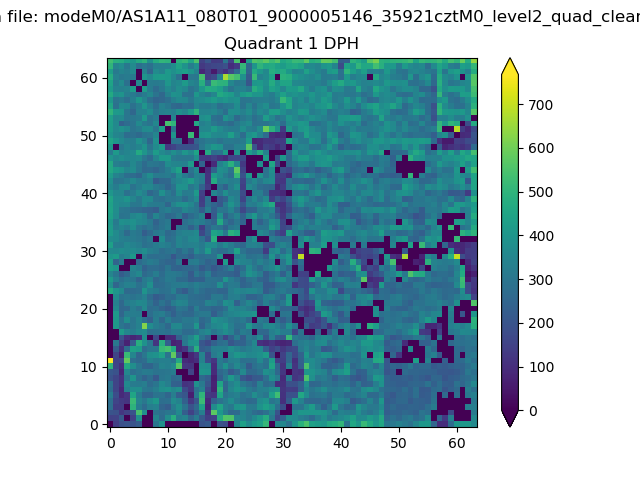 |
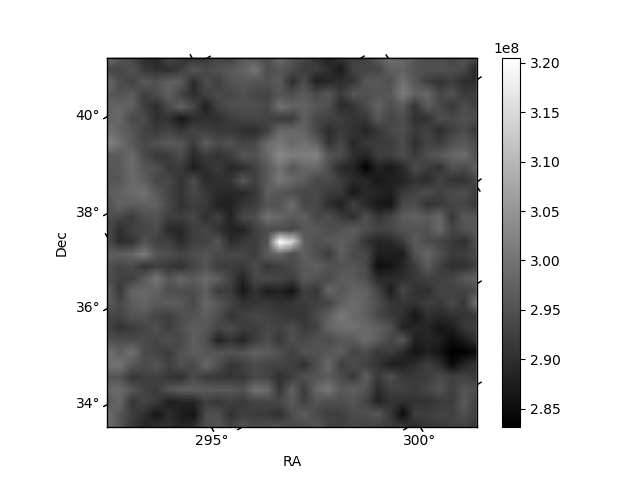
Quadrant B |
|---|---|---|---|
| Quadrant D | 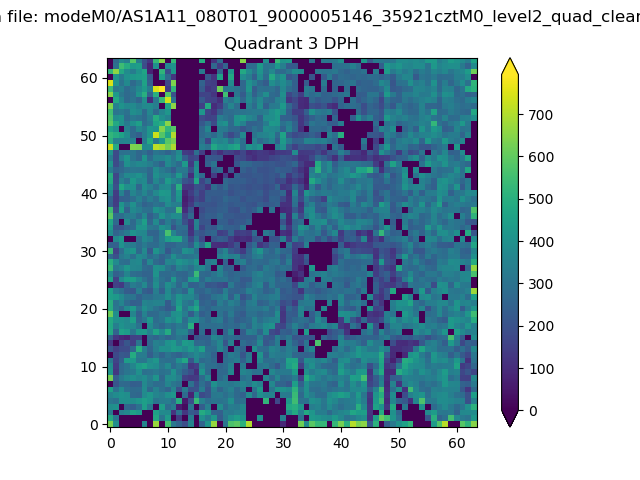 |
 |
Quadrant C |
| Plot type | Count rate plots | Images |
|---|---|---|
| Comparison with Poisson distribution Blue bars denote a histogram of data divided into 1 sec bins. Red curve is a Poisson curve with rate = median count rate of data. |
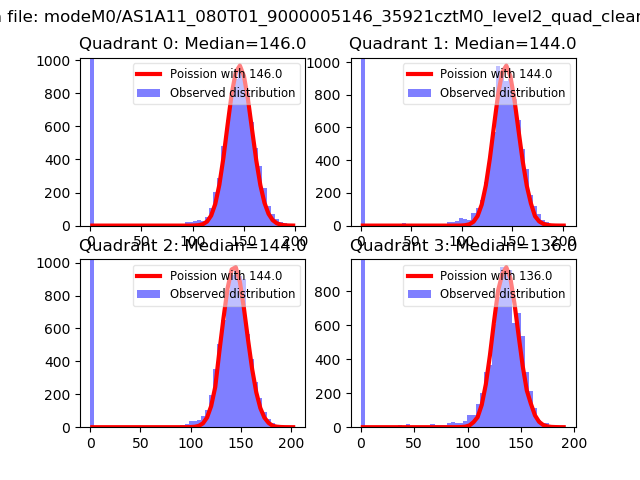 |
 |
| Quadrant-wise count rates Data is divided into 100 sec bins |
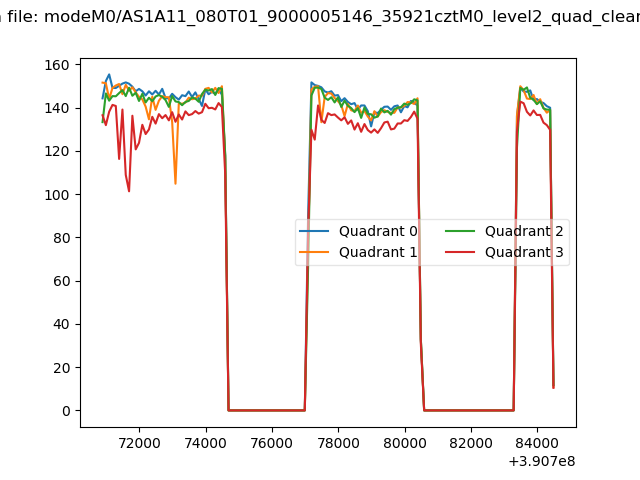 |
|
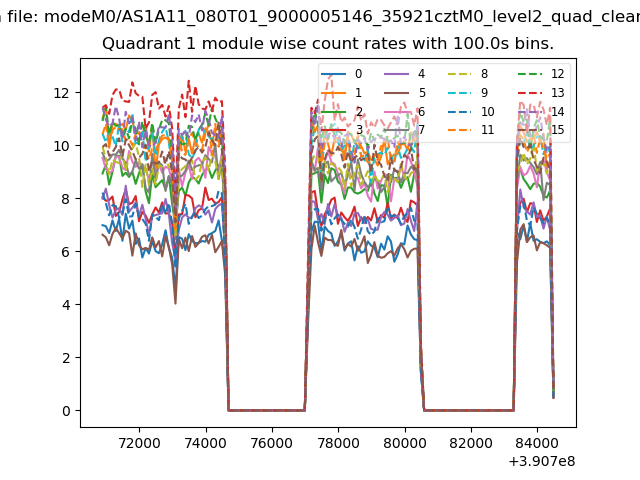
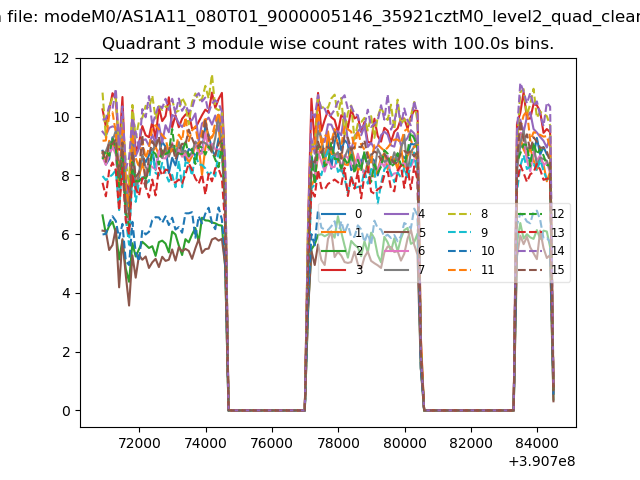
| Module-wise count rates for Quadrant A Data is divided into 100 sec bins |
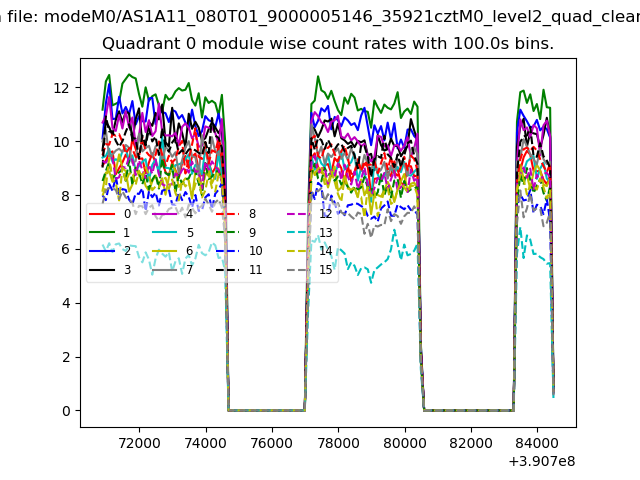 |
 |
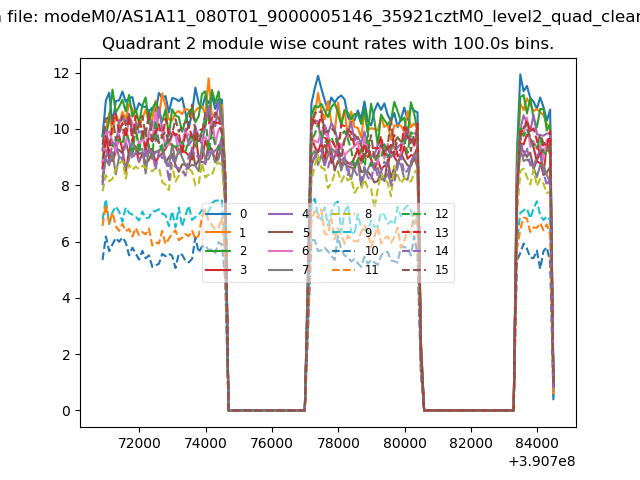
| Module-wise count rates for Quadrant B Data is divided into 100 sec bins |
 |
 |
| Module-wise count rates for Quadrant C Data is divided into 100 sec bins |
 |
 |
| Module-wise count rates for Quadrant D Data is divided into 100 sec bins |
 |
 |
| Parameter | Plot |
|---|---|
| CZT HV Monitor | 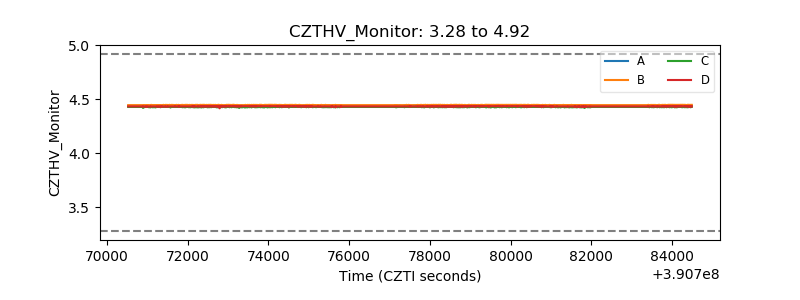 |
| D_VDD | 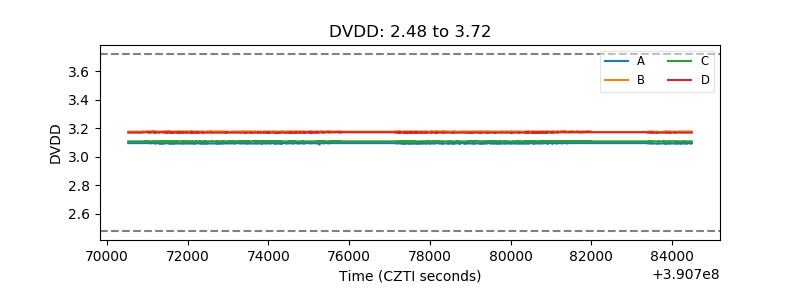 |
| Temperature 1 | 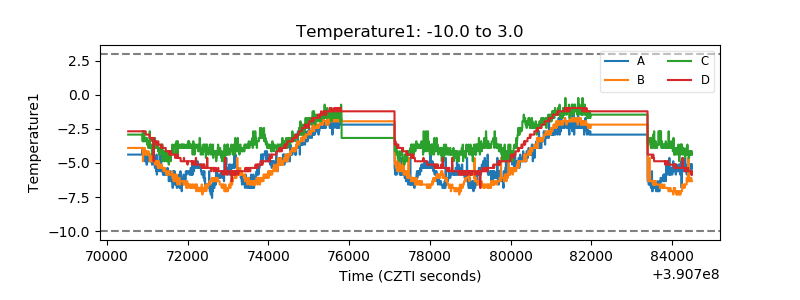 |
| Veto HV Monitor |  |
| Veto LLD | 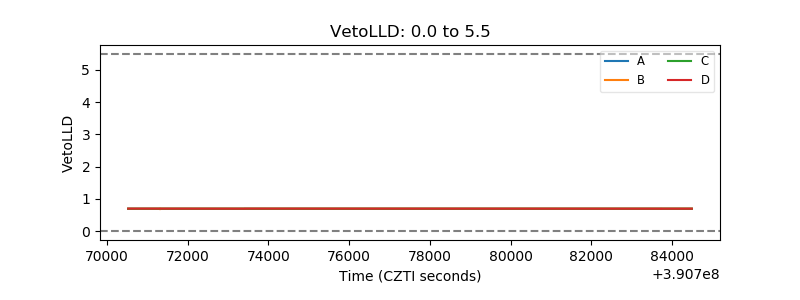 |
| Alpha Counter | 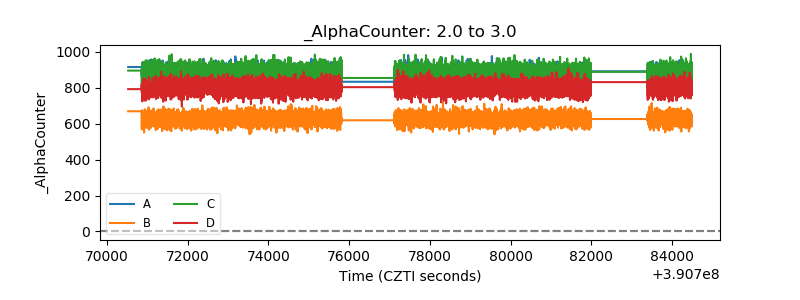 |
| _CPM_Rate | 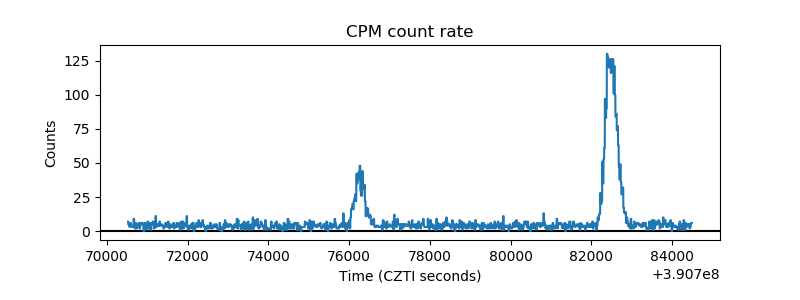 |
| CZT Counter | 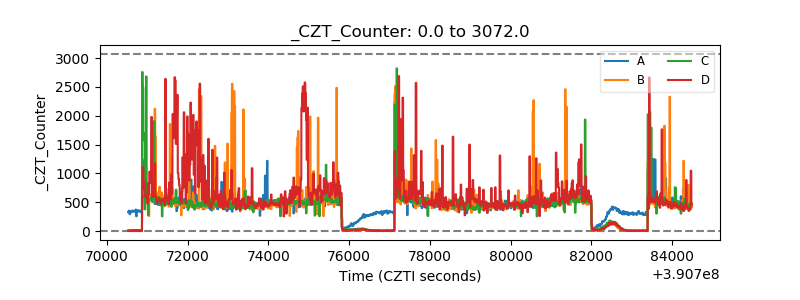 |
| +2.5 Volts monitor | 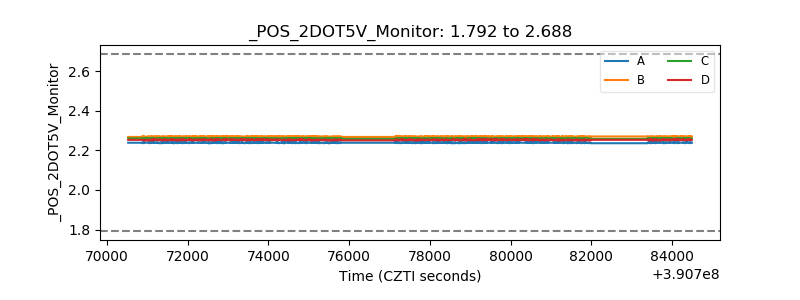 |
| +5 Volts monitor | 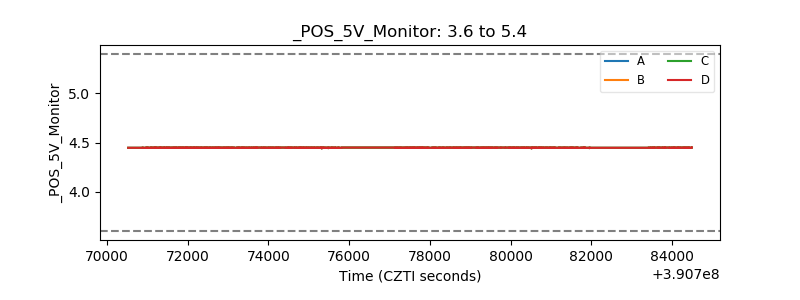 |
| _ROLL_ROT | 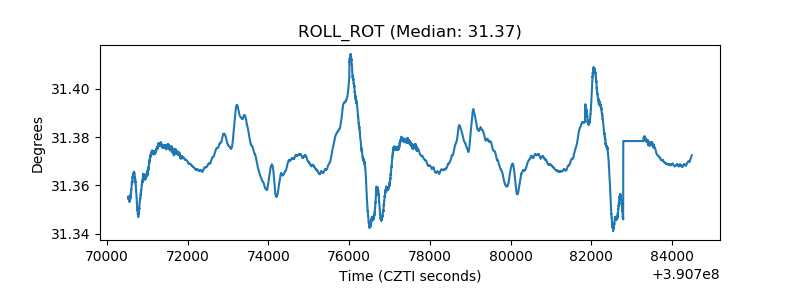 |
| _Roll_DEC | 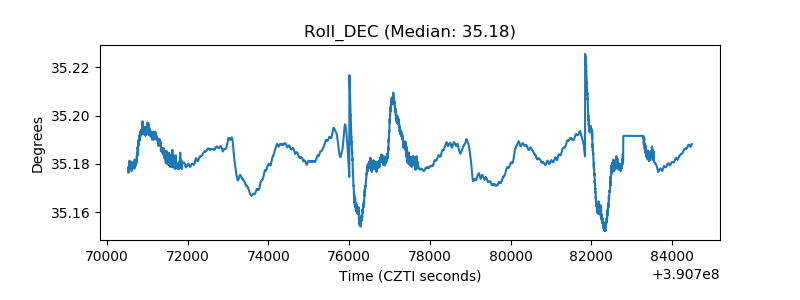 |
| _Roll_RA | 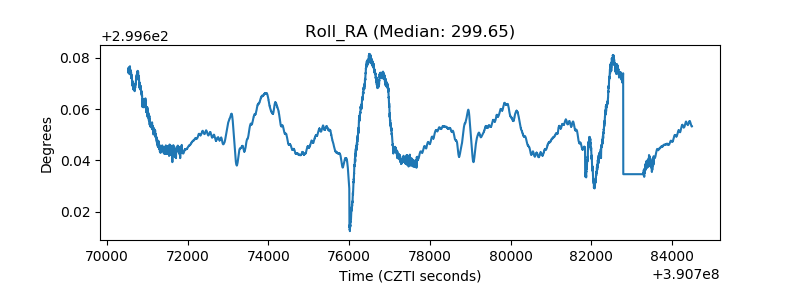 |
| Veto Counter | 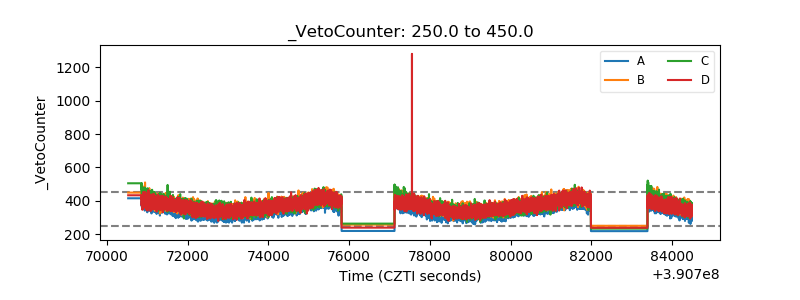 |