| Param | Original file | Final file |
|---|---|---|
| Filename | modeM0/AS1A11_080T01_9000005146_35918cztM0_level2.evt | modeM0/AS1A11_080T01_9000005146_35918cztM0_level2_quad_clean.evt |
| Size (bytes) | 505,408,320 | 92,482,560 |
| Size | 482.0 MB | 88.2 MB |
| Events in quadrant A | 3,309,119 | 617,021 |
| Events in quadrant B | 4,783,321 | 580,312 |
| Events in quadrant C | 3,314,316 | 611,680 |
| Events in quadrant D | 3,505,298 | 585,049 |
| Mode M9 | |||
|---|---|---|---|
| Quadrant | BADHDUFLAG | Total packets | Discarded packets |
| A | 0 | 23 | 0 |
| B | 0 | 23 | 0 |
| C | 0 | 23 | 0 |
| D | 0 | 24 | 0 |
| Mode SS | |||
|---|---|---|---|
| Quadrant | BADHDUFLAG | Total packets | Discarded packets |
| A | 0 | 120 | 0 |
| B | 0 | 120 | 0 |
| C | 0 | 120 | 0 |
| D | 0 | 120 | 0 |
| Mode M0 | |||
|---|---|---|---|
| Quadrant | BADHDUFLAG | Total packets | Discarded packets |
| A | 0 | 13398 | 3 |
| B | 0 | 17853 | 2 |
| C | 0 | 13113 | 2 |
| D | 0 | 14057 | 2 |
| Quadrant | Total seconds | Saturated seconds | Saturation percentage |
|---|---|---|---|
| A | 5810 | 116 | 1.996558% |
| B | 5810 | 594 | 10.223752% |
| C | 5810 | 119 | 2.048193% |
| D | 5810 | 72 | 1.239243% |
Noise dominated data is calculated using 1-second bins in cleaned event files. If a bin has >2000 counts, and if more than 50% of those come from <1% of pixels, then it is considered to be noise-dominated and hence unusable.
| Quadrant | # 1 sec bins | Bins with >0 counts | Bins with >2000 counts | High rate bins dominated by noise | Noise dominated (total time) | Noise dominated (detector-on time) | Marked lightcurve |
|---|---|---|---|---|---|---|---|
| A | 7153 | 5811 | 95 | 95 | 1.33% | 1.63% | 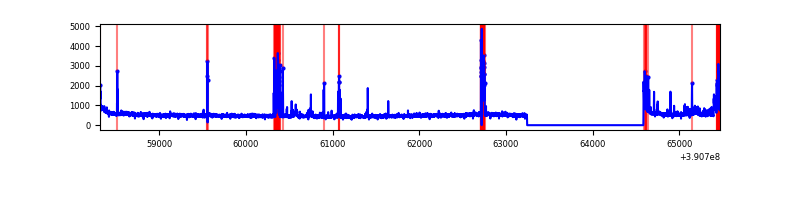 |
| B | 7153 | 5811 | 443 | 443 | 6.19% | 7.62% | 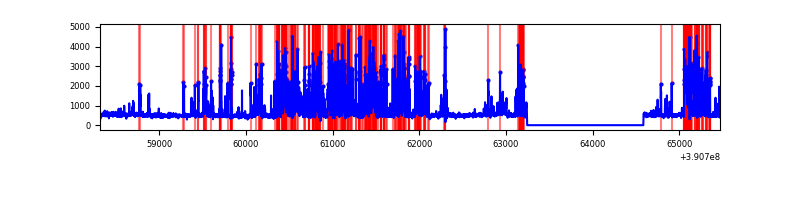 |
| C | 7153 | 5811 | 80 | 80 | 1.12% | 1.38% | 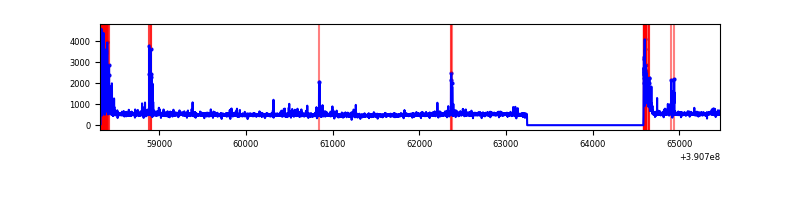 |
| D | 7153 | 5811 | 52 | 52 | 0.73% | 0.89% | 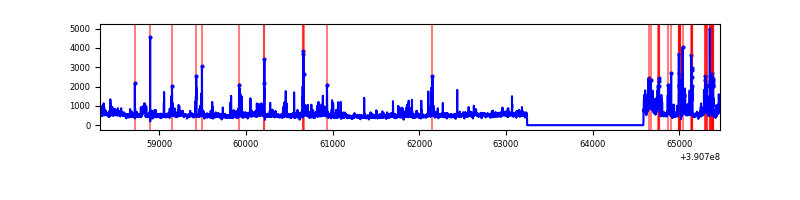 |
Top three noisy pixels from each quadrant. If the there are fewer than three noisy pixels in the level2.evt file, extra rows are filled as -1
| Pixel properties | Quadrant properties | ||||||
|---|---|---|---|---|---|---|---|
| Quadrant | DetID | PixID | Counts | Sigma | Mean | Median | Sigma |
| A | 15 | 169 | 381035 | 2668.74 | 691 | 680 | 142.5 |
| A | 10 | 83 | 173602 | 1213.3 | 691 | 680 | 142.5 |
| A | 9 | 143 | 71070 | 493.89 | 691 | 680 | 142.5 |
| B | 5 | 172 | 2037315 | 15989.11 | 661 | 646 | 127.4 |
| B | 5 | 255 | 88487 | 689.61 | 661 | 646 | 127.4 |
| B | 15 | 85 | 18325 | 138.79 | 661 | 646 | 127.4 |
| C | 0 | 10 | 344476 | 2194.51 | 669 | 677 | 156.7 |
| C | 15 | 214 | 242608 | 1544.27 | 669 | 677 | 156.7 |
| C | 0 | 207 | 87854 | 556.46 | 669 | 677 | 156.7 |
| D | 2 | 250 | 290070 | 1732.58 | 673 | 656 | 167.0 |
| D | 8 | 195 | 196110 | 1170.09 | 673 | 656 | 167.0 |
| D | 13 | 249 | 121270 | 722.06 | 673 | 656 | 167.0 |
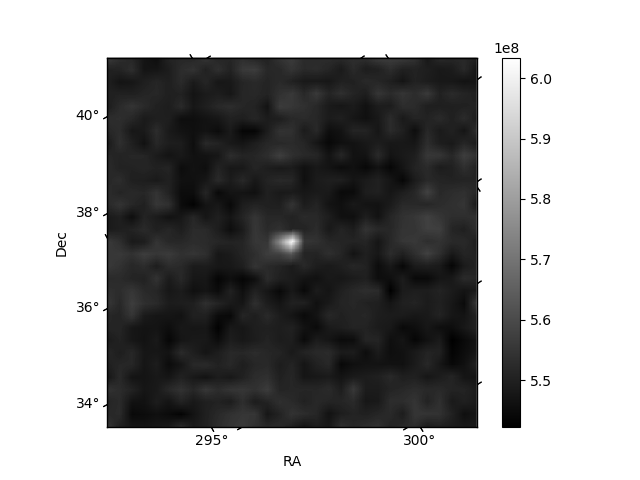
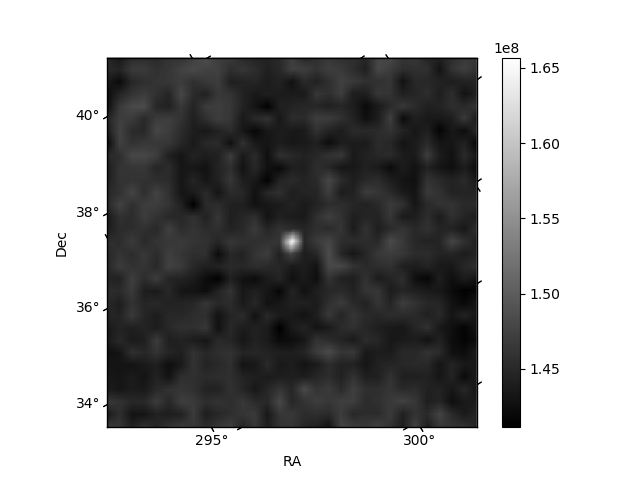
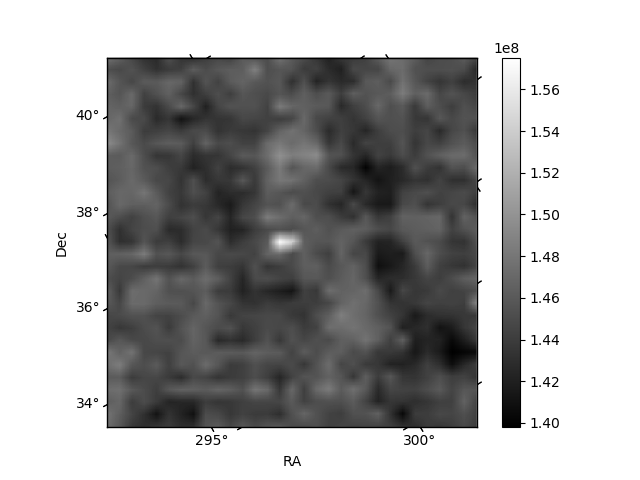
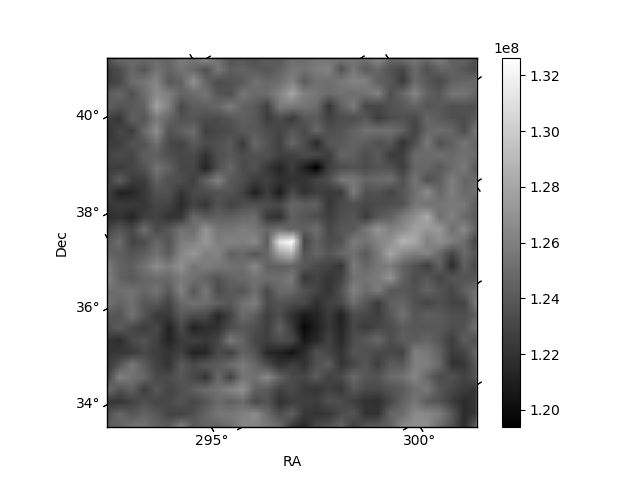
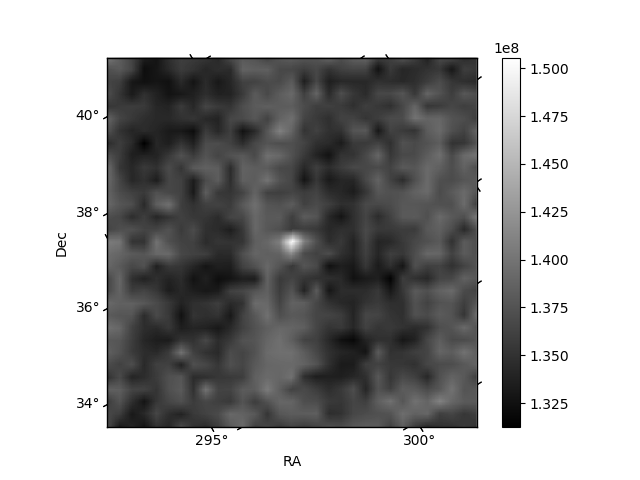
Histogram calculated using DETX and DETY for each event in the final _common_clean file
| Quadrant A | 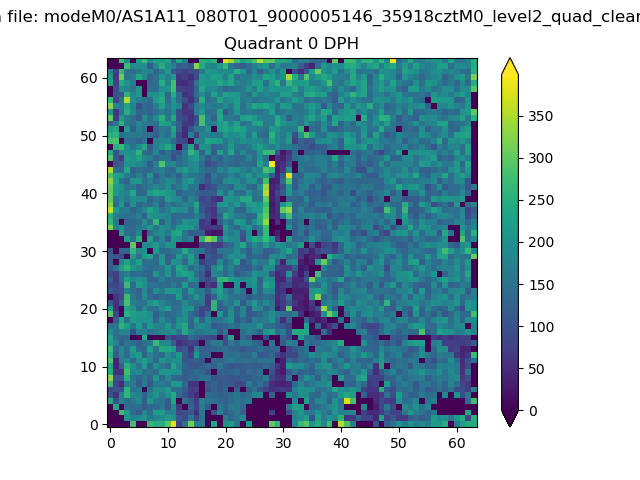 |
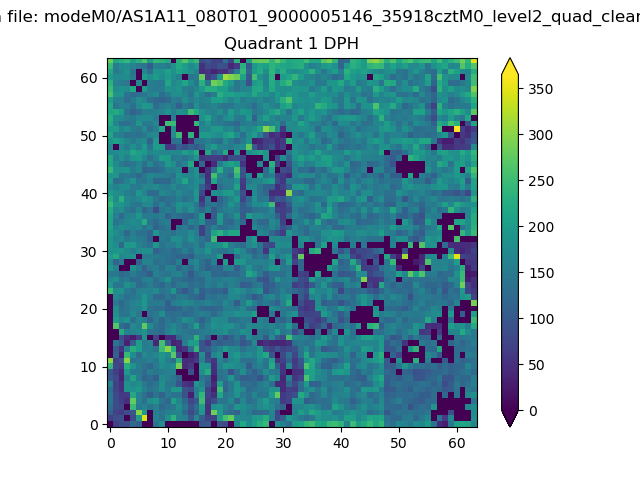 |
Quadrant B |
|---|---|---|---|
| Quadrant D | 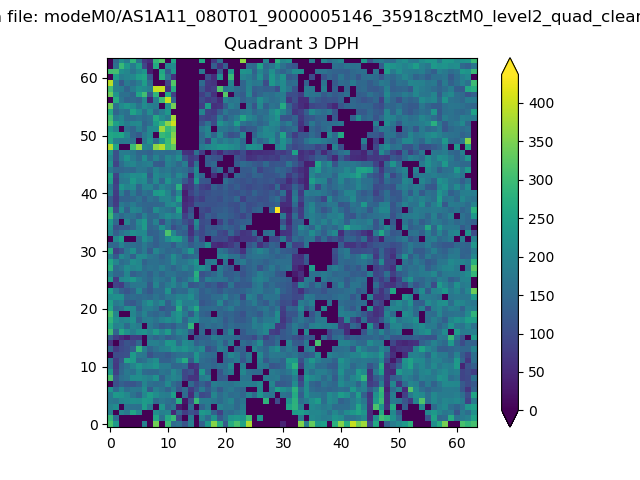 |
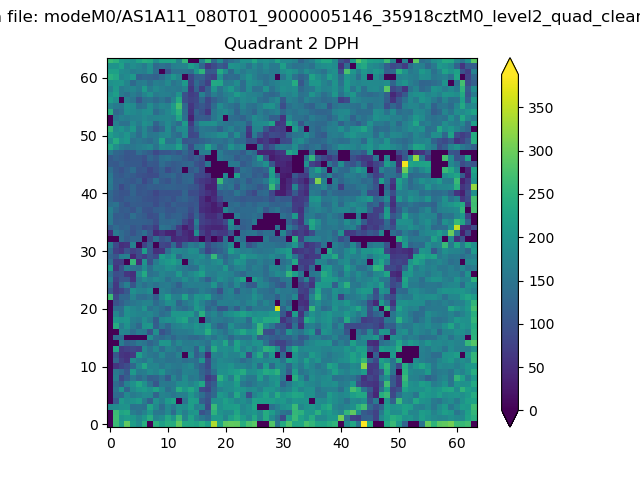 |
Quadrant C |
| Plot type | Count rate plots | Images |
|---|---|---|
| Comparison with Poisson distribution Blue bars denote a histogram of data divided into 1 sec bins. Red curve is a Poisson curve with rate = median count rate of data. |
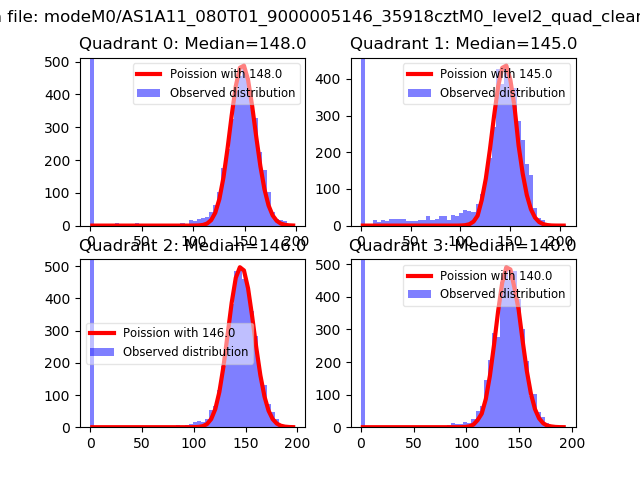 |
 |
| Quadrant-wise count rates Data is divided into 100 sec bins |
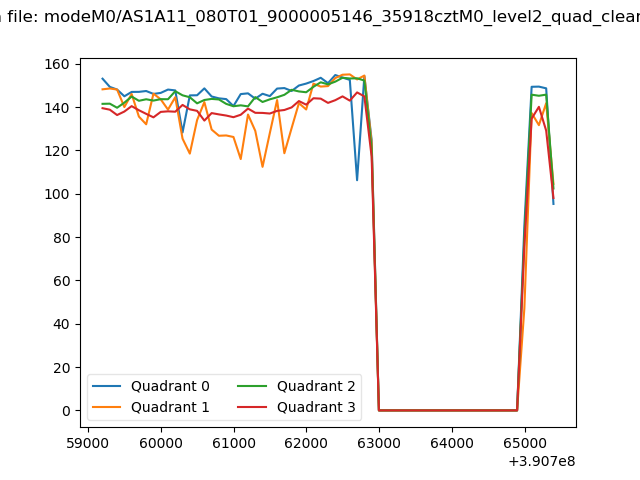 |
|
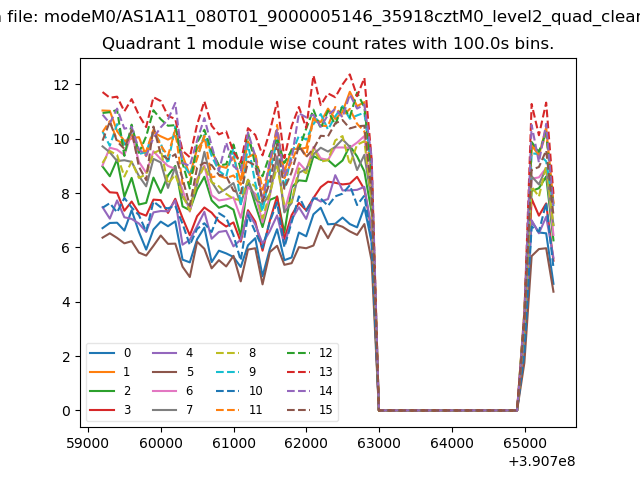
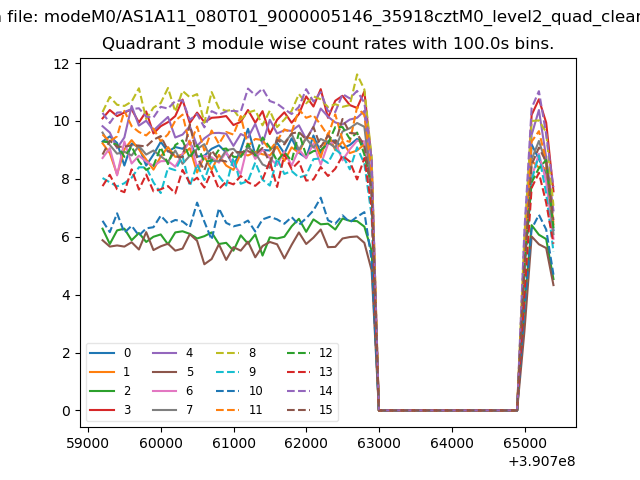
| Module-wise count rates for Quadrant A Data is divided into 100 sec bins |
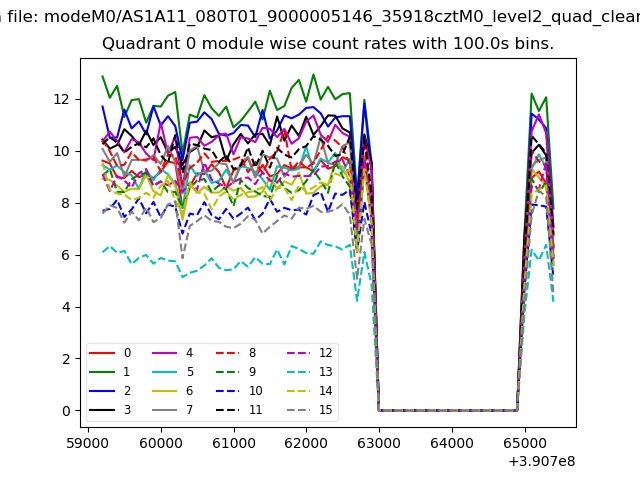 |
 |
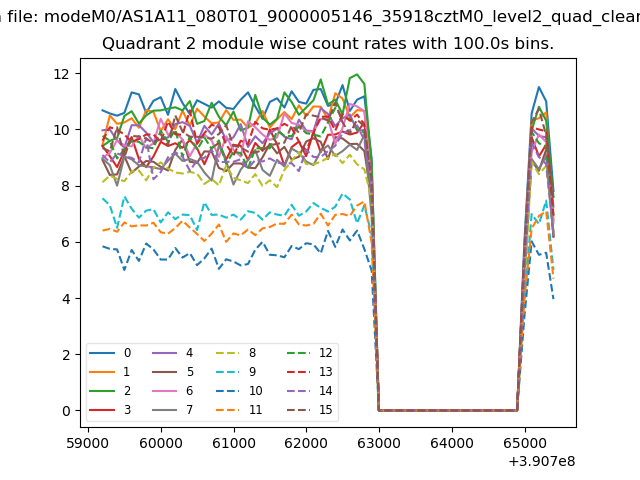
| Module-wise count rates for Quadrant B Data is divided into 100 sec bins |
 |
 |
| Module-wise count rates for Quadrant C Data is divided into 100 sec bins |
 |
 |
| Module-wise count rates for Quadrant D Data is divided into 100 sec bins |
 |
 |
| Parameter | Plot |
|---|---|
| CZT HV Monitor | 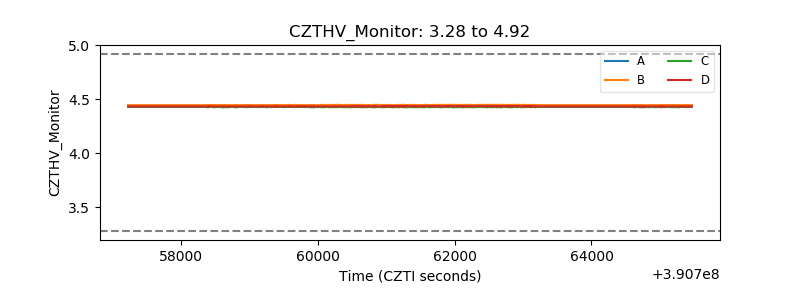 |
| D_VDD | 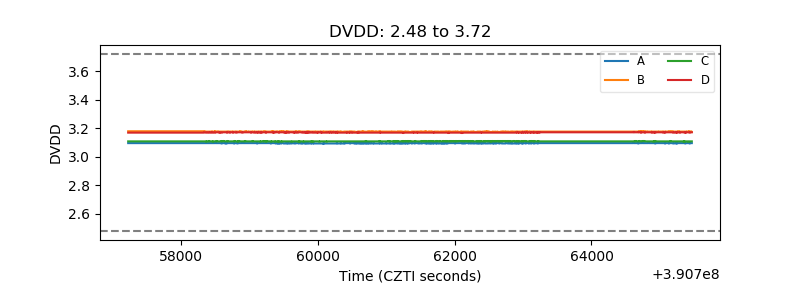 |
| Temperature 1 |  |
| Veto HV Monitor | 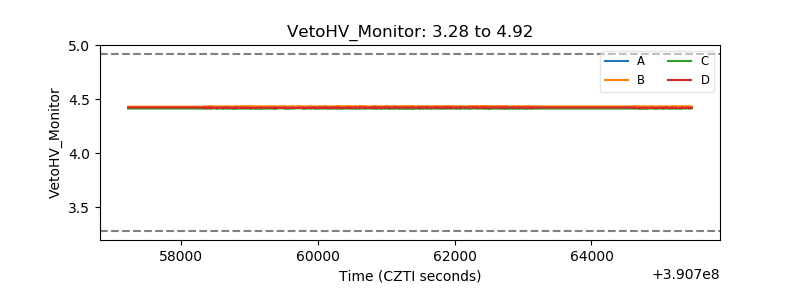 |
| Veto LLD | 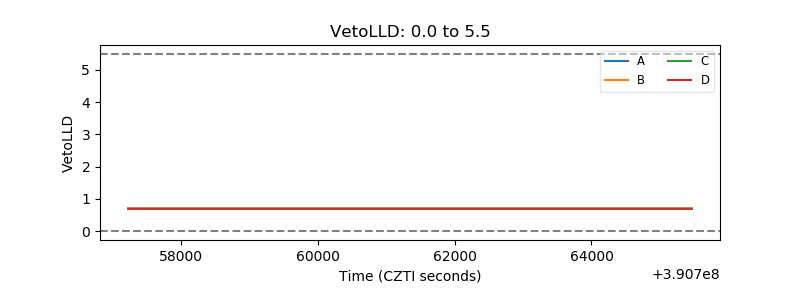 |
| Alpha Counter | 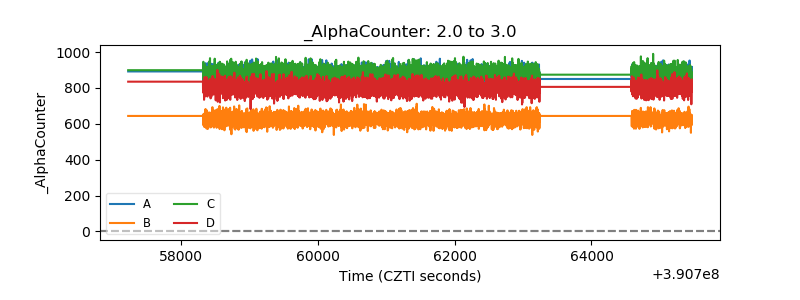 |
| _CPM_Rate | 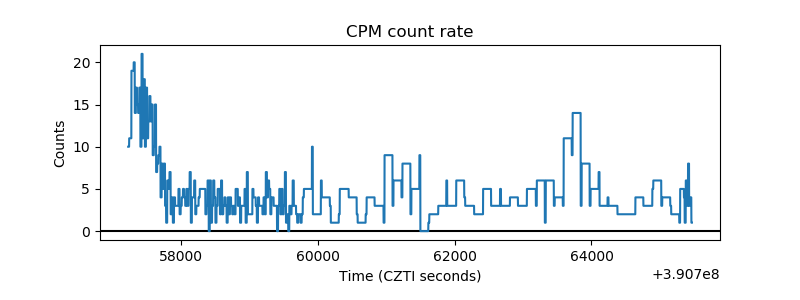 |
| CZT Counter | 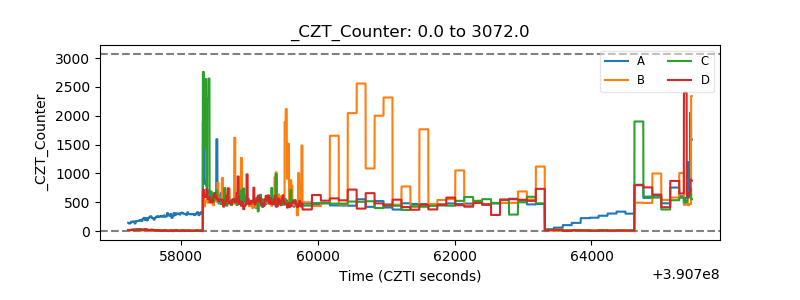 |
| +2.5 Volts monitor | 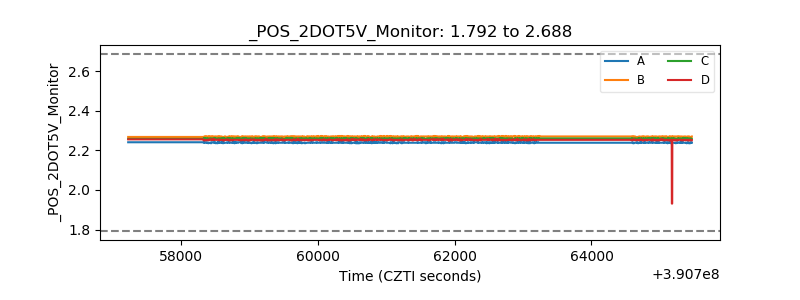 |
| +5 Volts monitor | 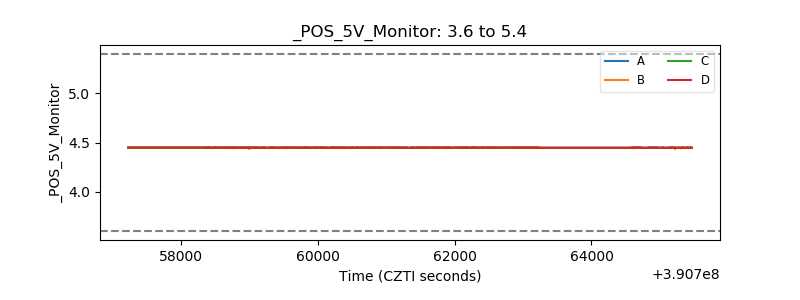 |
| _ROLL_ROT | 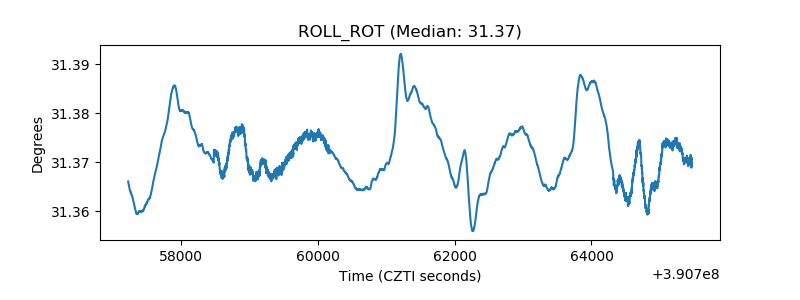 |
| _Roll_DEC | 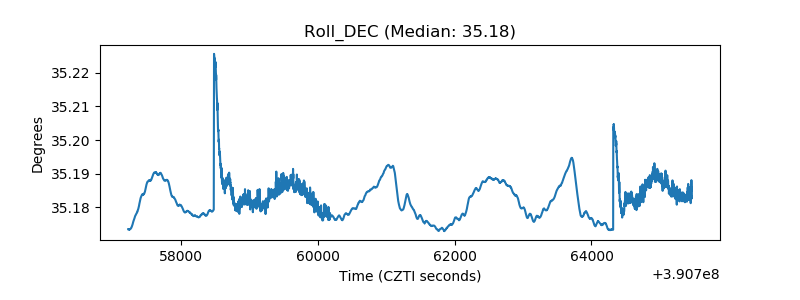 |
| _Roll_RA | 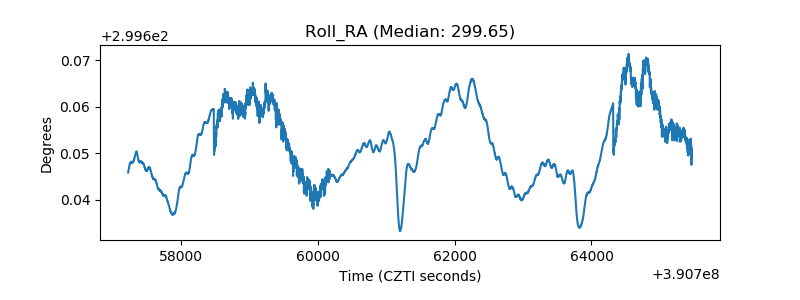 |
| Veto Counter |  |