| Param | Original file | Final file |
|---|---|---|
| Filename | modeM0/AS1A11_080T01_9000005146_35916cztM0_level2.evt | modeM0/AS1A11_080T01_9000005146_35916cztM0_level2_quad_clean.evt |
| Size (bytes) | 468,889,920 | 65,528,640 |
| Size | 447.2 MB | 62.5 MB |
| Events in quadrant A | 2,793,996 | 420,132 |
| Events in quadrant B | 4,215,119 | 392,496 |
| Events in quadrant C | 2,957,358 | 409,813 |
| Events in quadrant D | 3,871,890 | 388,068 |
| Mode M9 | |||
|---|---|---|---|
| Quadrant | BADHDUFLAG | Total packets | Discarded packets |
| A | 0 | 41 | 0 |
| B | 0 | 41 | 0 |
| C | 0 | 41 | 0 |
| D | 0 | 41 | 0 |
| Mode SS | |||
|---|---|---|---|
| Quadrant | BADHDUFLAG | Total packets | Discarded packets |
| A | 0 | 112 | 0 |
| B | 0 | 112 | 0 |
| C | 0 | 112 | 0 |
| D | 0 | 112 | 0 |
| Mode M0 | |||
|---|---|---|---|
| Quadrant | BADHDUFLAG | Total packets | Discarded packets |
| A | 0 | 11434 | 3 |
| B | 0 | 15923 | 2 |
| C | 0 | 11658 | 2 |
| D | 0 | 15009 | 2 |
| Quadrant | Total seconds | Saturated seconds | Saturation percentage |
|---|---|---|---|
| A | 5328 | 15 | 0.281532% |
| B | 5328 | 526 | 9.872372% |
| C | 5328 | 96 | 1.801802% |
| D | 5328 | 195 | 3.659910% |
Noise dominated data is calculated using 1-second bins in cleaned event files. If a bin has >2000 counts, and if more than 50% of those come from <1% of pixels, then it is considered to be noise-dominated and hence unusable.
| Quadrant | # 1 sec bins | Bins with >0 counts | Bins with >2000 counts | High rate bins dominated by noise | Noise dominated (total time) | Noise dominated (detector-on time) | Marked lightcurve |
|---|---|---|---|---|---|---|---|
| A | 9423 | 5330 | 4 | 4 | 0.04% | 0.08% | 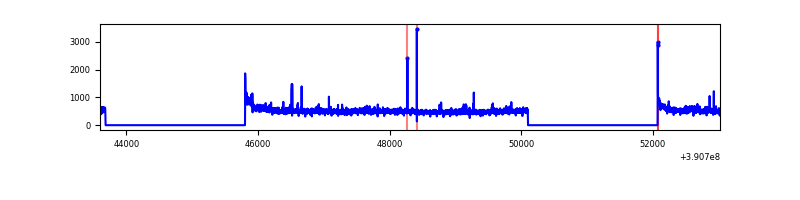 |
| B | 9423 | 5330 | 384 | 384 | 4.08% | 7.20% | 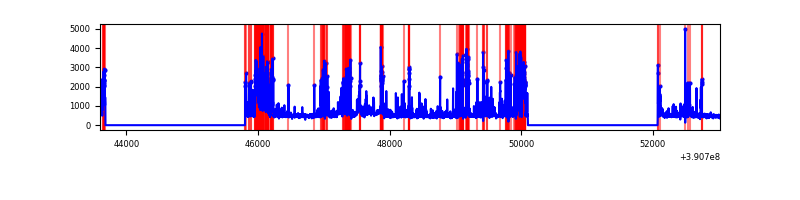 |
| C | 9423 | 5330 | 66 | 66 | 0.70% | 1.24% | 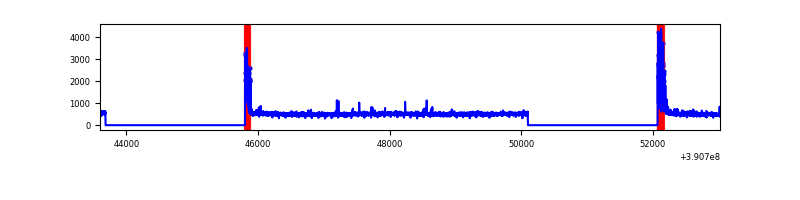 |
| D | 9423 | 5330 | 121 | 121 | 1.28% | 2.27% | 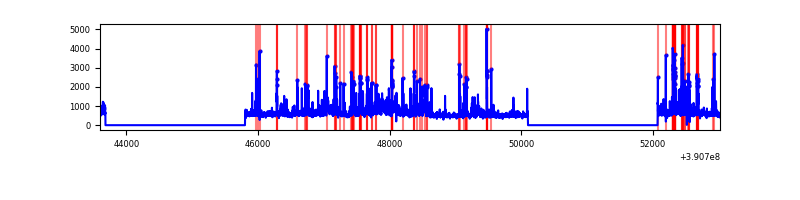 |
Top three noisy pixels from each quadrant. If the there are fewer than three noisy pixels in the level2.evt file, extra rows are filled as -1
| Pixel properties | Quadrant properties | ||||||
|---|---|---|---|---|---|---|---|
| Quadrant | DetID | PixID | Counts | Sigma | Mean | Median | Sigma |
| A | 10 | 83 | 169546 | 1297.02 | 649 | 638 | 130.2 |
| A | 15 | 169 | 74489 | 567.09 | 649 | 638 | 130.2 |
| A | 9 | 143 | 25043 | 187.4 | 649 | 638 | 130.2 |
| B | 5 | 172 | 1516156 | 13026.76 | 612 | 599 | 116.3 |
| B | 5 | 63 | 138416 | 1184.59 | 612 | 599 | 116.3 |
| B | 0 | 213 | 39191 | 331.71 | 612 | 599 | 116.3 |
| C | 0 | 10 | 289651 | 2003.08 | 624 | 628 | 144.3 |
| C | 15 | 214 | 223894 | 1547.35 | 624 | 628 | 144.3 |
| C | 10 | 49 | 8853 | 57.0 | 624 | 628 | 144.3 |
| D | 8 | 195 | 337036 | 2209.58 | 618 | 602 | 152.3 |
| D | 7 | 223 | 301269 | 1974.68 | 618 | 602 | 152.3 |
| D | 13 | 249 | 204553 | 1339.48 | 618 | 602 | 152.3 |
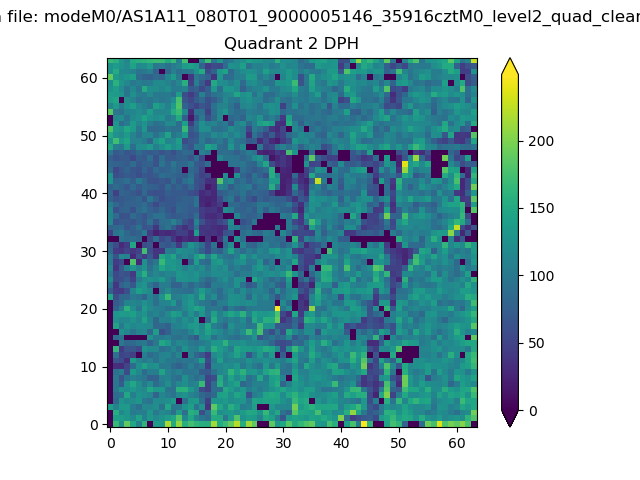
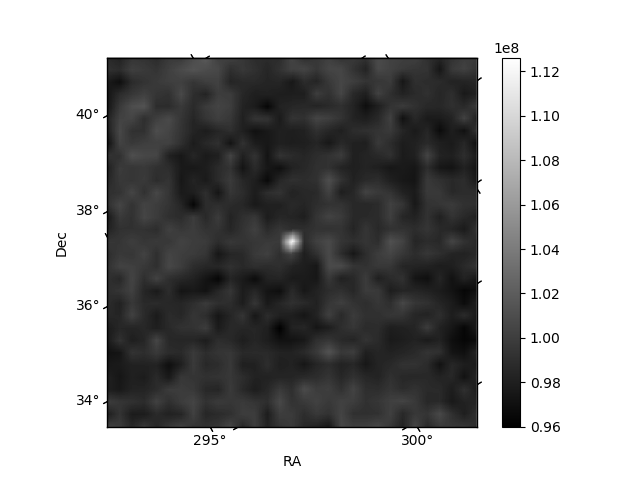
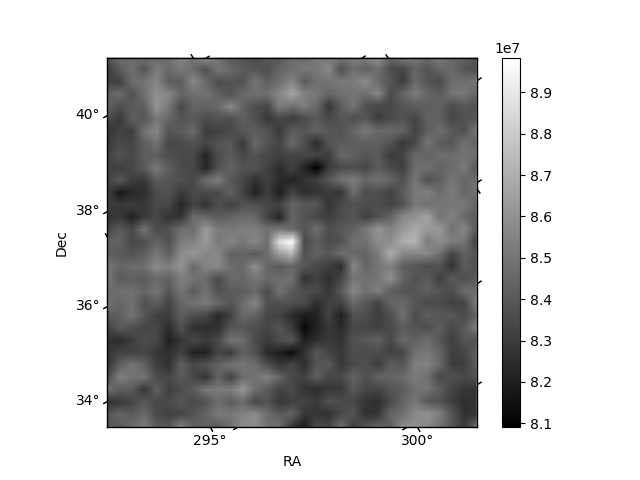
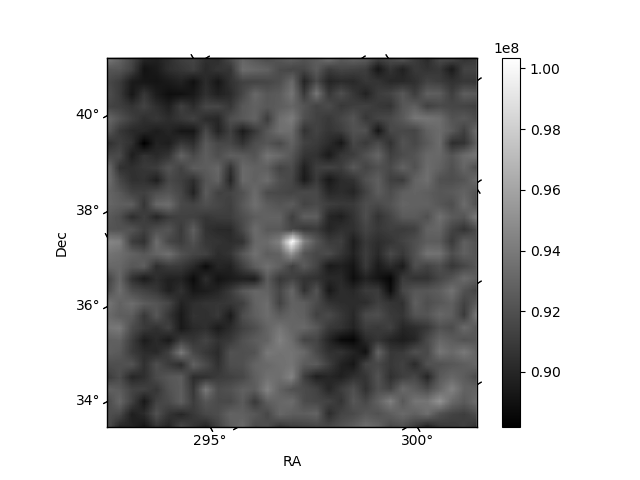
Histogram calculated using DETX and DETY for each event in the final _common_clean file
| Quadrant A | 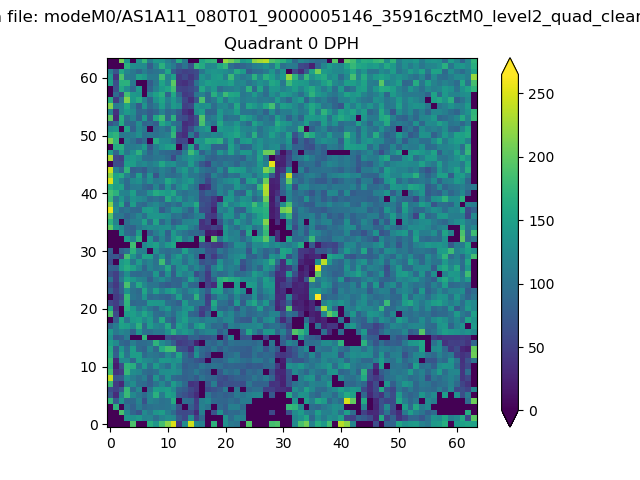 |
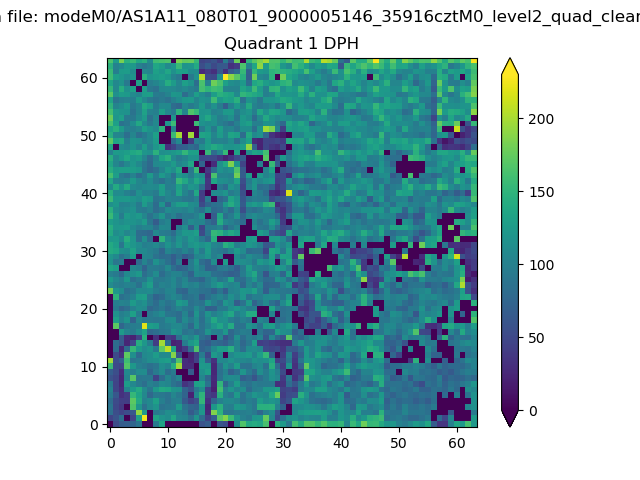 |
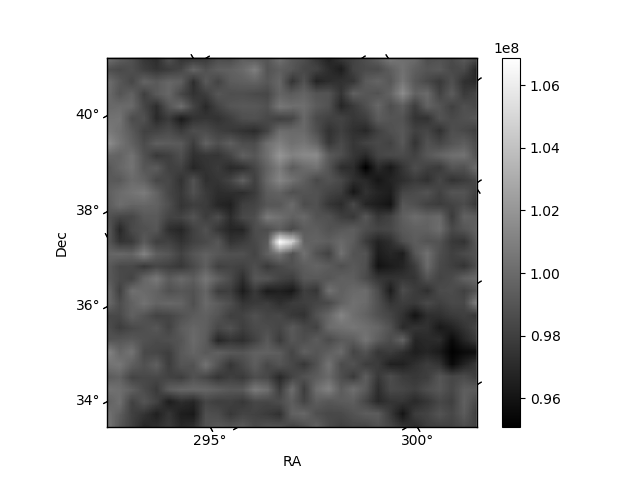
Quadrant B |
|---|---|---|---|
| Quadrant D | 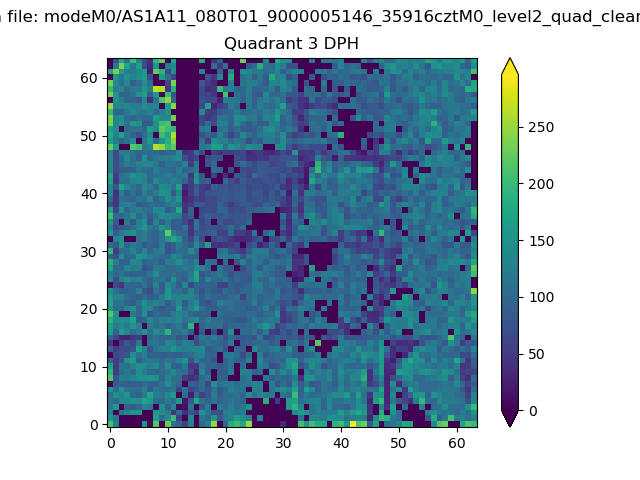 |
 |
Quadrant C |
| Plot type | Count rate plots | Images |
|---|---|---|
| Comparison with Poisson distribution Blue bars denote a histogram of data divided into 1 sec bins. Red curve is a Poisson curve with rate = median count rate of data. |
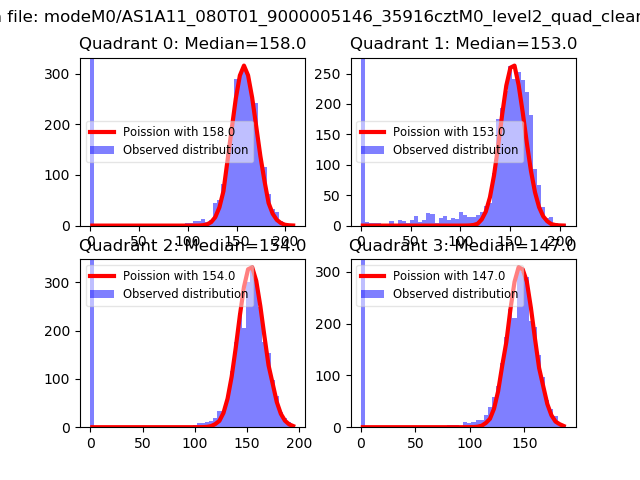 |
 |
| Quadrant-wise count rates Data is divided into 100 sec bins |
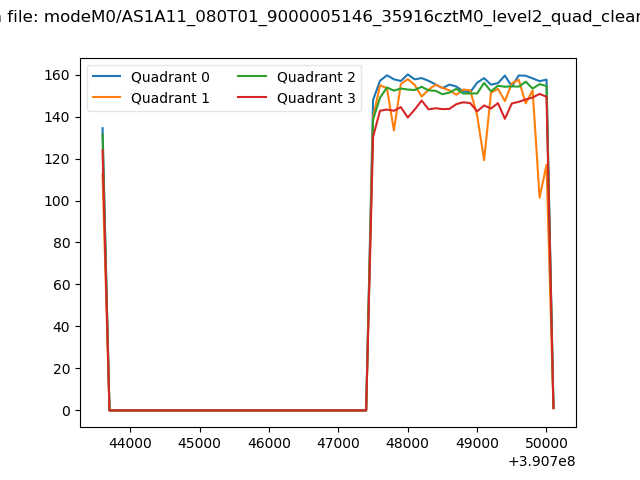 |
|
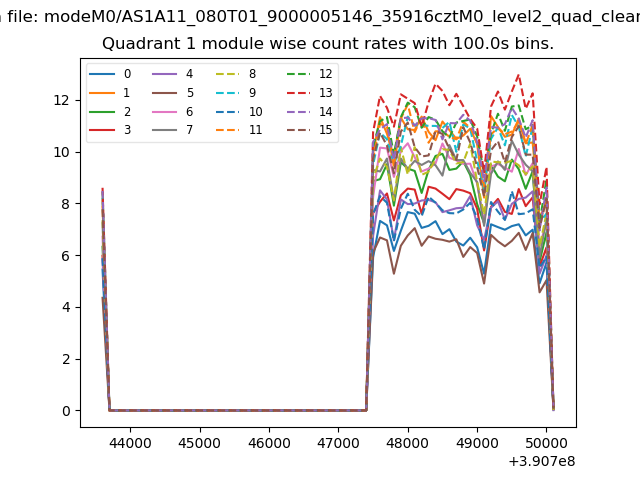
| Module-wise count rates for Quadrant A Data is divided into 100 sec bins |
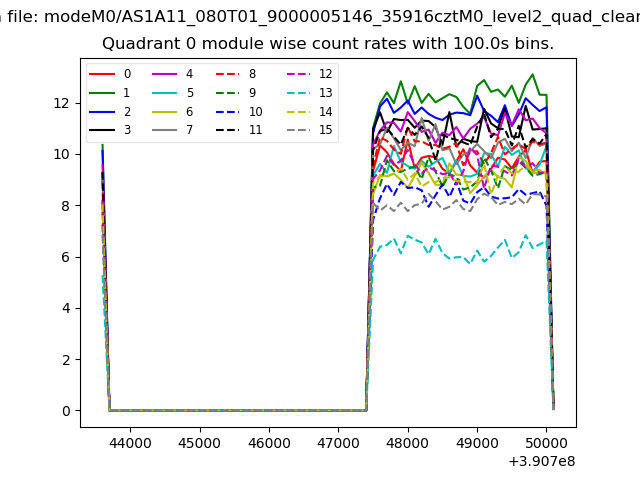 |
 |
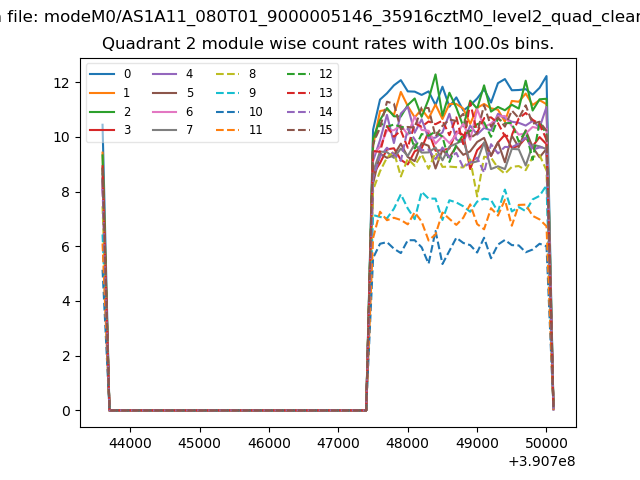
| Module-wise count rates for Quadrant B Data is divided into 100 sec bins |
 |
 |
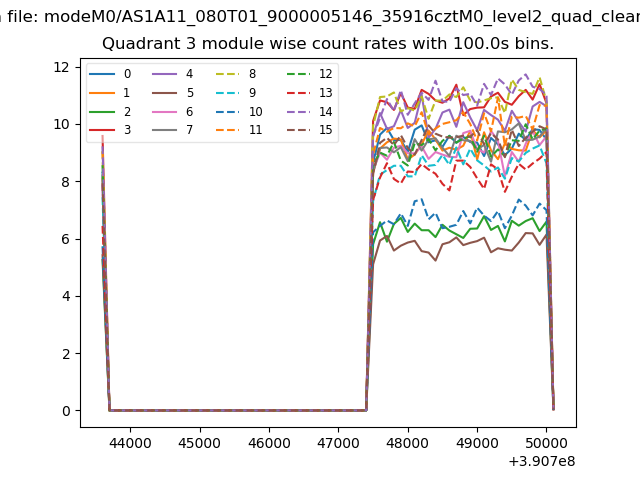
| Module-wise count rates for Quadrant C Data is divided into 100 sec bins |
 |
 |
| Module-wise count rates for Quadrant D Data is divided into 100 sec bins |
 |
 |
| Parameter | Plot |
|---|---|
| CZT HV Monitor | 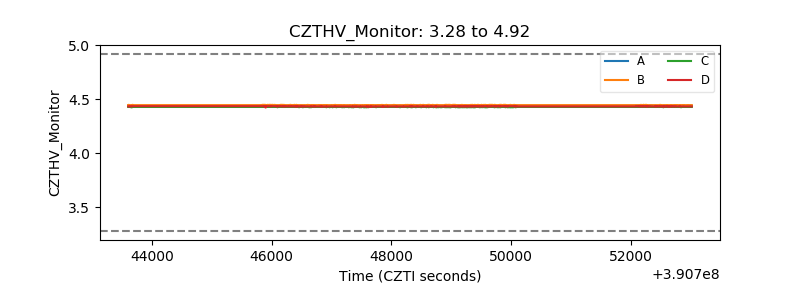 |
| D_VDD | 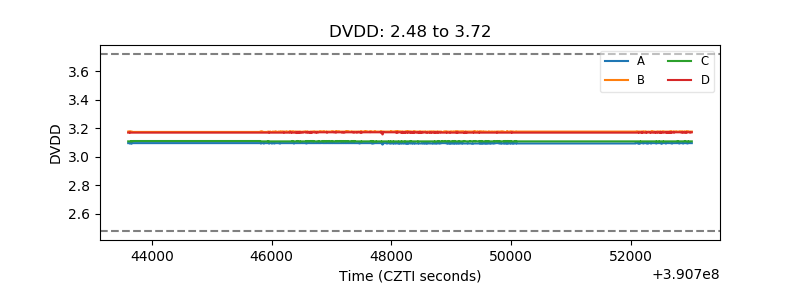 |
| Temperature 1 | 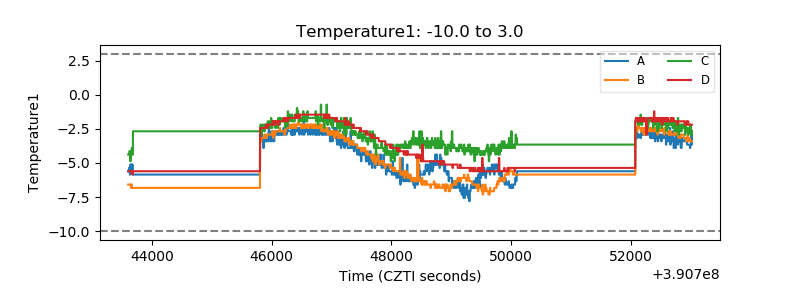 |
| Veto HV Monitor | 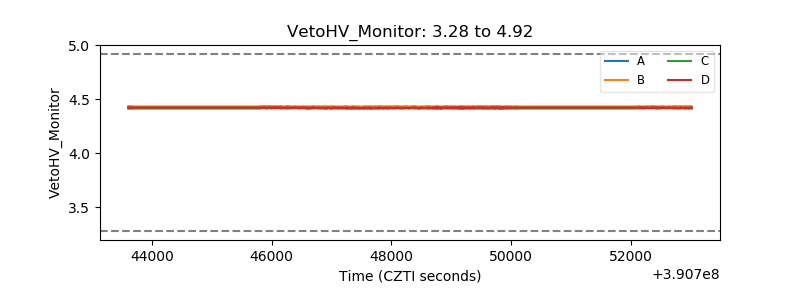 |
| Veto LLD | 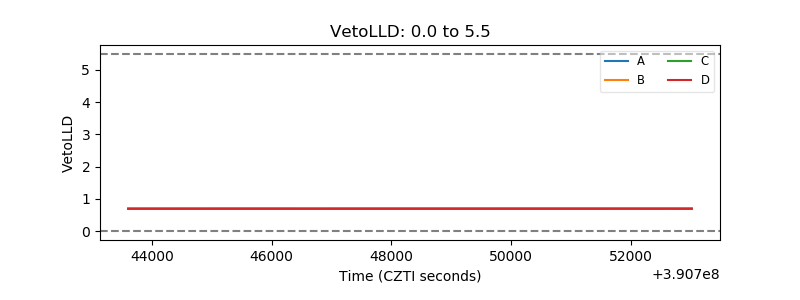 |
| Alpha Counter | 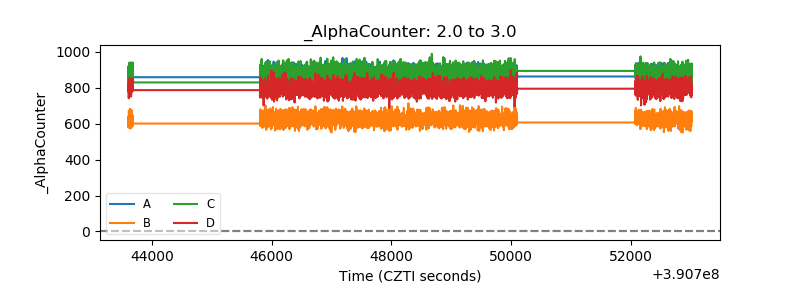 |
| _CPM_Rate | 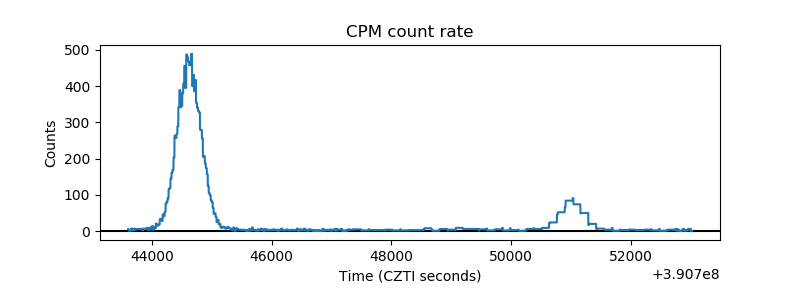 |
| CZT Counter | 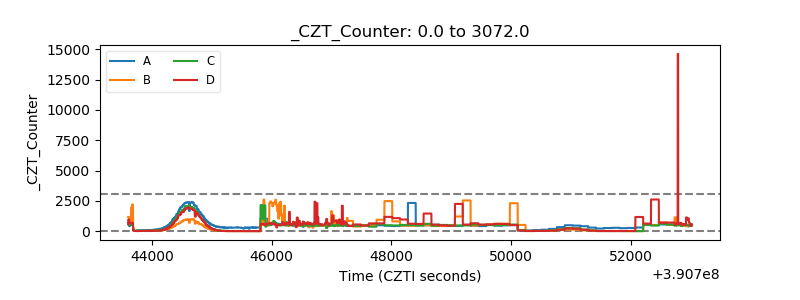 |
| +2.5 Volts monitor | 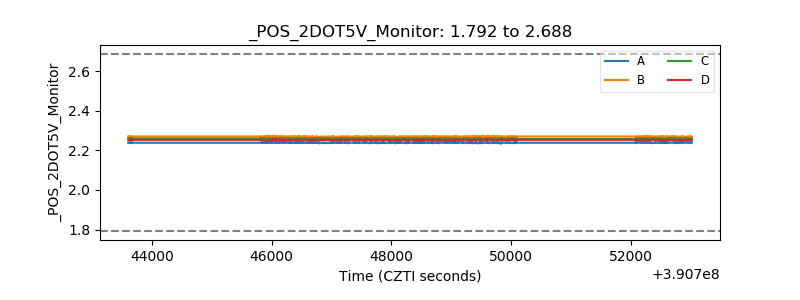 |
| +5 Volts monitor | 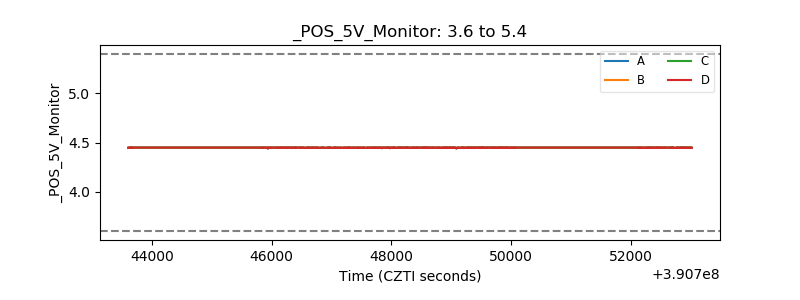 |
| _ROLL_ROT | 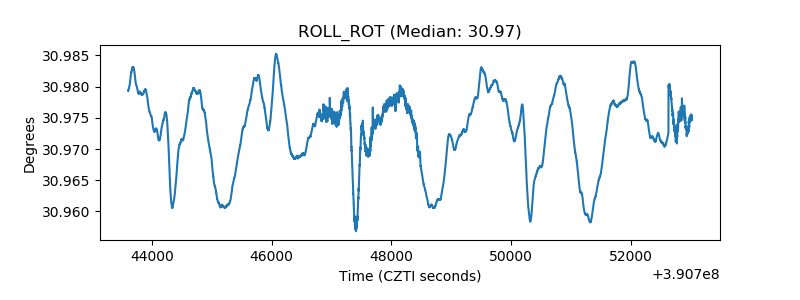 |
| _Roll_DEC | 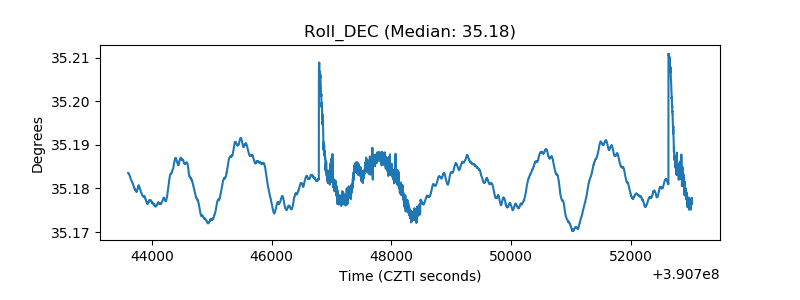 |
| _Roll_RA | 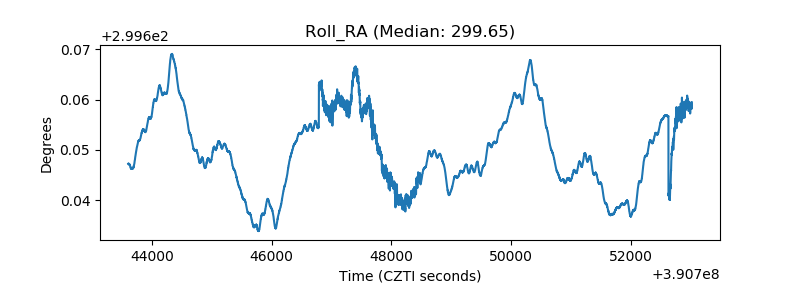 |
| Veto Counter | 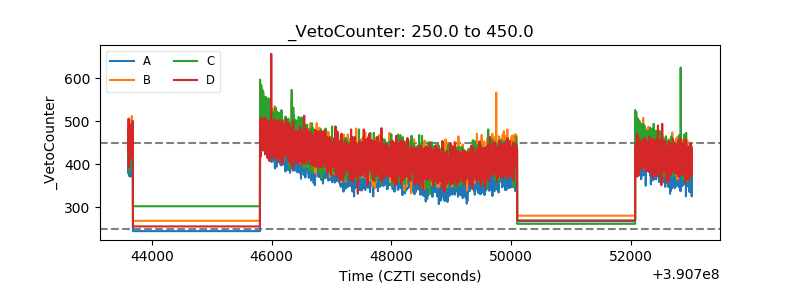 |