| Param | Original file | Final file |
|---|---|---|
| Filename | modeM0/AS1A11_080T01_9000005146_35912cztM0_level2.evt | modeM0/AS1A11_080T01_9000005146_35912cztM0_level2_quad_clean.evt |
| Size (bytes) | 504,515,520 | 74,016,000 |
| Size | 481.1 MB | 70.6 MB |
| Events in quadrant A | 2,760,105 | 508,996 |
| Events in quadrant B | 5,853,904 | 413,541 |
| Events in quadrant C | 2,940,926 | 490,433 |
| Events in quadrant D | 3,379,514 | 471,428 |
| Mode M9 | |||
|---|---|---|---|
| Quadrant | BADHDUFLAG | Total packets | Discarded packets |
| A | 0 | 19 | 0 |
| B | 0 | 19 | 0 |
| C | 0 | 19 | 0 |
| D | 0 | 19 | 0 |
| Mode SS | |||
|---|---|---|---|
| Quadrant | BADHDUFLAG | Total packets | Discarded packets |
| A | 0 | 106 | 0 |
| B | 0 | 106 | 0 |
| C | 0 | 106 | 0 |
| D | 0 | 106 | 0 |
| Mode M0 | |||
|---|---|---|---|
| Quadrant | BADHDUFLAG | Total packets | Discarded packets |
| A | 0 | 11063 | 3 |
| B | 0 | 20674 | 9 |
| C | 0 | 11617 | 2 |
| D | 0 | 13442 | 2 |
| Quadrant | Total seconds | Saturated seconds | Saturation percentage |
|---|---|---|---|
| A | 5077 | 8 | 0.157573% |
| B | 5076 | 1318 | 25.965327% |
| C | 5077 | 65 | 1.280284% |
| D | 5077 | 66 | 1.299980% |
Noise dominated data is calculated using 1-second bins in cleaned event files. If a bin has >2000 counts, and if more than 50% of those come from <1% of pixels, then it is considered to be noise-dominated and hence unusable.
| Quadrant | # 1 sec bins | Bins with >0 counts | Bins with >2000 counts | High rate bins dominated by noise | Noise dominated (total time) | Noise dominated (detector-on time) | Marked lightcurve |
|---|---|---|---|---|---|---|---|
| A | 7048 | 5078 | 2 | 2 | 0.03% | 0.04% | 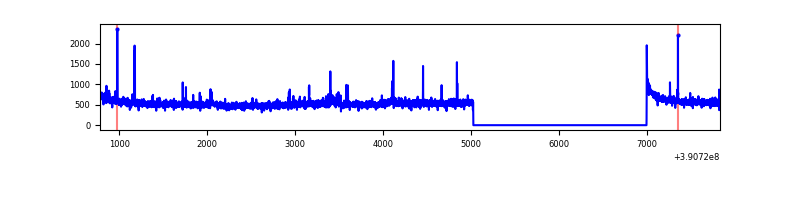 |
| B | 7048 | 5076 | 924 | 924 | 13.11% | 18.20% | 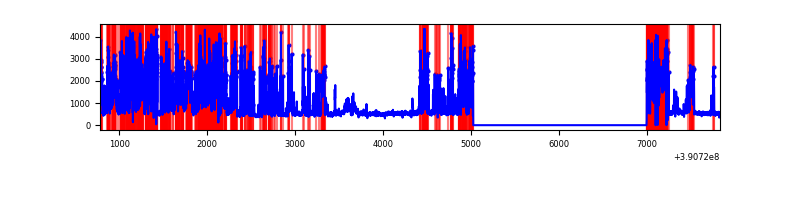 |
| C | 7048 | 5078 | 63 | 63 | 0.89% | 1.24% | 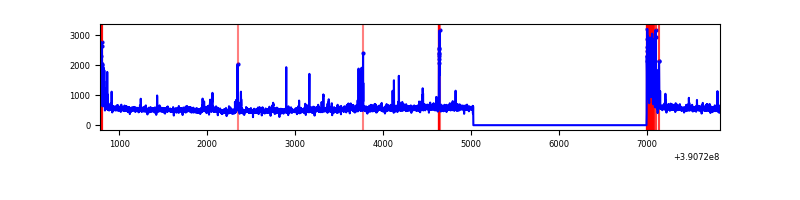 |
| D | 7048 | 5078 | 54 | 54 | 0.77% | 1.06% | 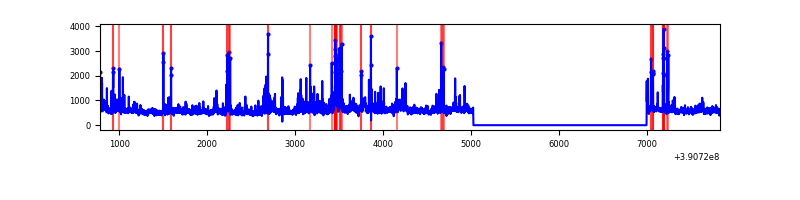 |
Top three noisy pixels from each quadrant. If the there are fewer than three noisy pixels in the level2.evt file, extra rows are filled as -1
| Pixel properties | Quadrant properties | ||||||
|---|---|---|---|---|---|---|---|
| Quadrant | DetID | PixID | Counts | Sigma | Mean | Median | Sigma |
| A | 10 | 83 | 145585 | 1097.93 | 651 | 642 | 132.0 |
| A | 15 | 169 | 42509 | 317.14 | 651 | 642 | 132.0 |
| A | 9 | 143 | 37894 | 282.18 | 651 | 642 | 132.0 |
| B | 5 | 172 | 3489322 | 32577.72 | 566 | 556 | 107.1 |
| B | 0 | 245 | 85682 | 794.9 | 566 | 556 | 107.1 |
| B | 5 | 255 | 36566 | 336.26 | 566 | 556 | 107.1 |
| C | 0 | 10 | 257931 | 1828.6 | 613 | 619 | 140.7 |
| C | 15 | 214 | 216053 | 1530.99 | 613 | 619 | 140.7 |
| C | 0 | 207 | 77320 | 545.08 | 613 | 619 | 140.7 |
| D | 8 | 195 | 367218 | 2459.73 | 619 | 605 | 149.0 |
| D | 13 | 249 | 237602 | 1590.09 | 619 | 605 | 149.0 |
| D | 12 | 227 | 94492 | 629.92 | 619 | 605 | 149.0 |
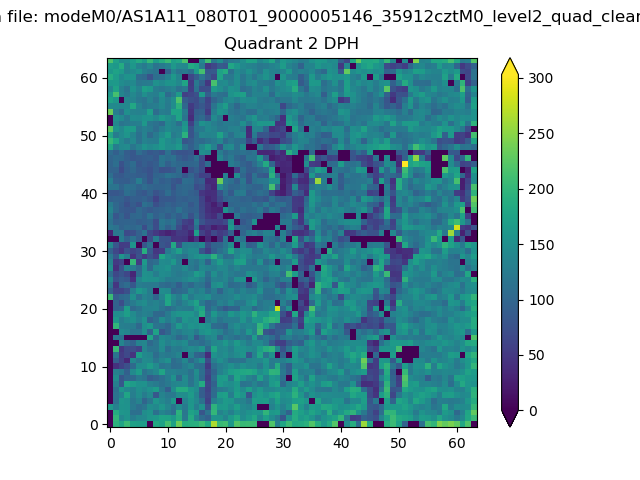
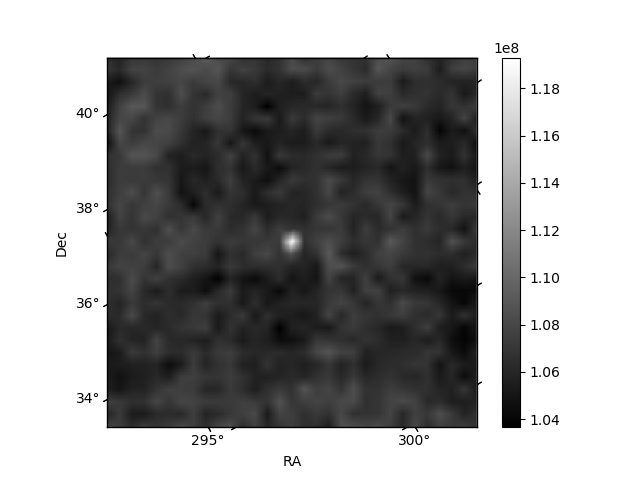
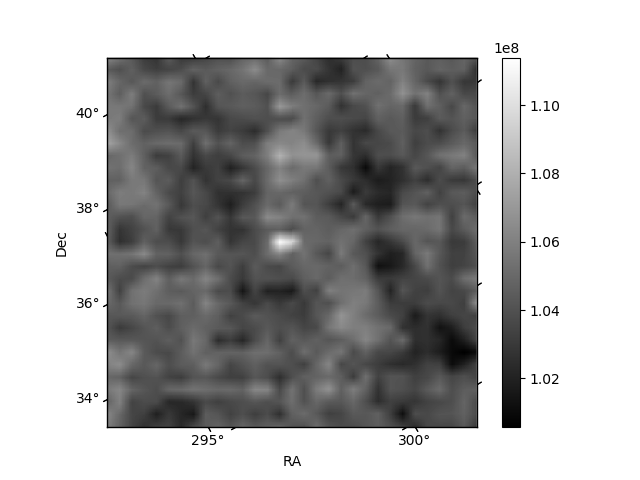
Histogram calculated using DETX and DETY for each event in the final _common_clean file
| Quadrant A | 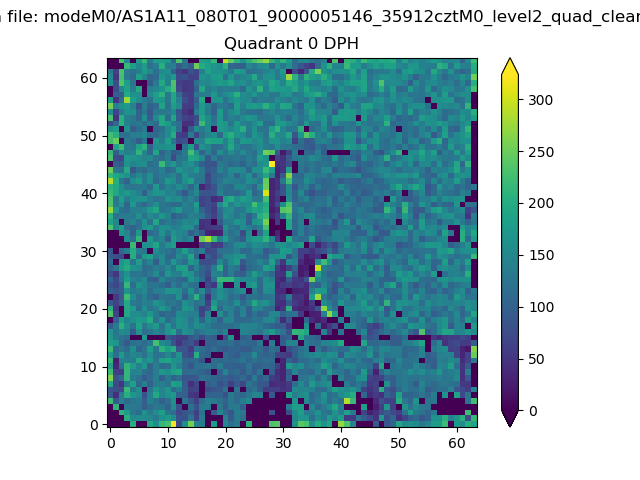 |
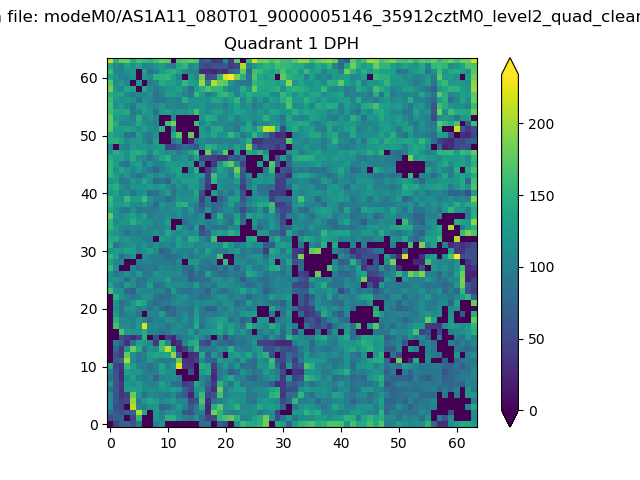 |
Quadrant B |
|---|---|---|---|
| Quadrant D | 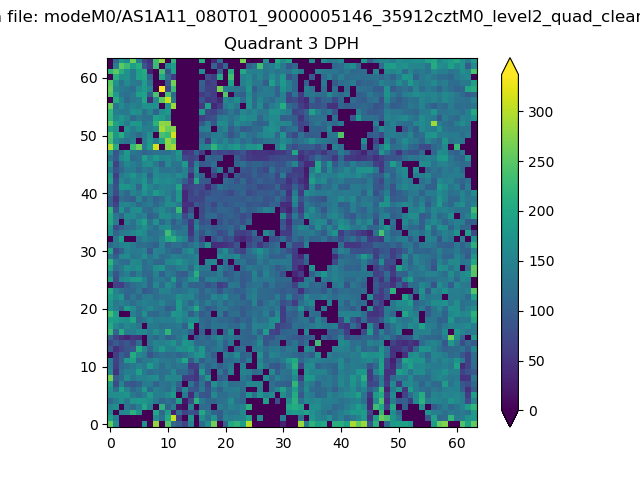 |
 |
Quadrant C |
| Plot type | Count rate plots | Images |
|---|---|---|
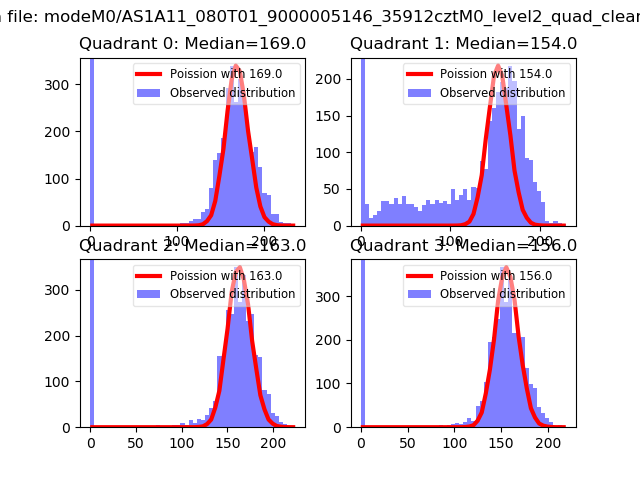
| Comparison with Poisson distribution Blue bars denote a histogram of data divided into 1 sec bins. Red curve is a Poisson curve with rate = median count rate of data. |
 |
 |
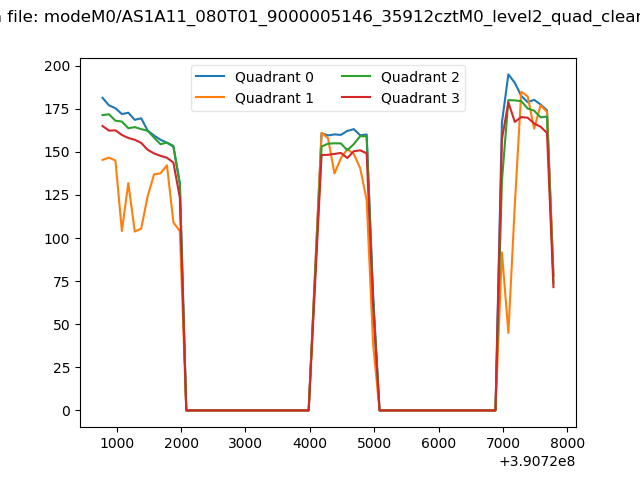
| Quadrant-wise count rates Data is divided into 100 sec bins |
 |
|
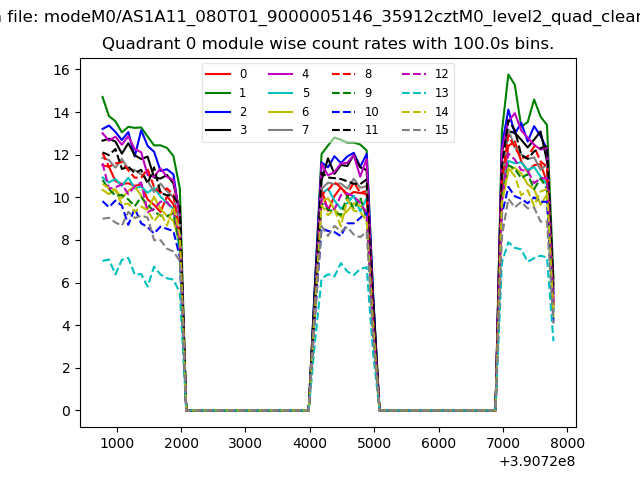
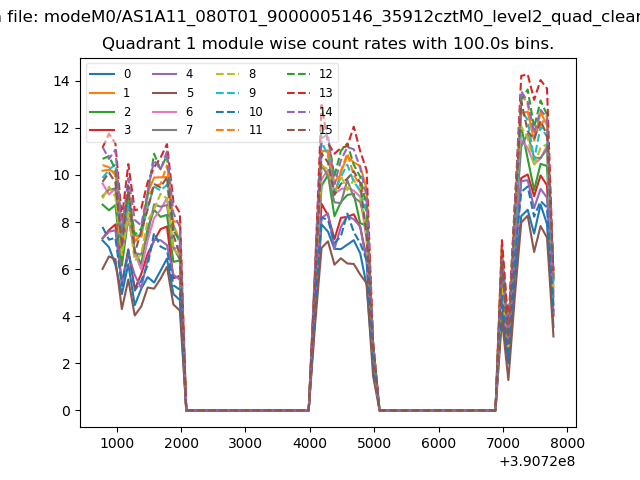
| Module-wise count rates for Quadrant A Data is divided into 100 sec bins |
 |
 |
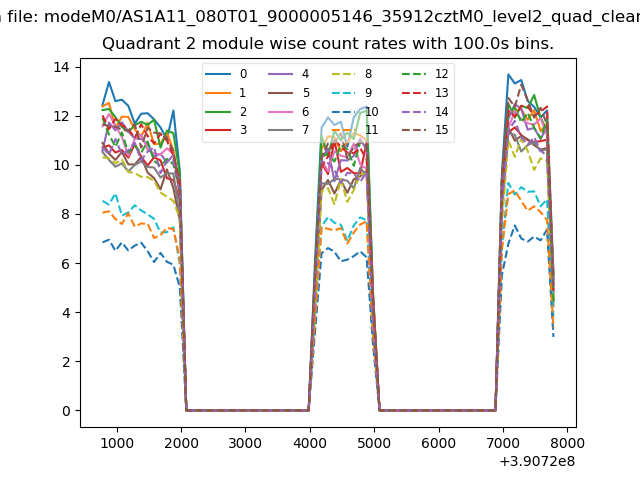
| Module-wise count rates for Quadrant B Data is divided into 100 sec bins |
 |
 |
| Module-wise count rates for Quadrant C Data is divided into 100 sec bins |
 |
 |
| Module-wise count rates for Quadrant D Data is divided into 100 sec bins |
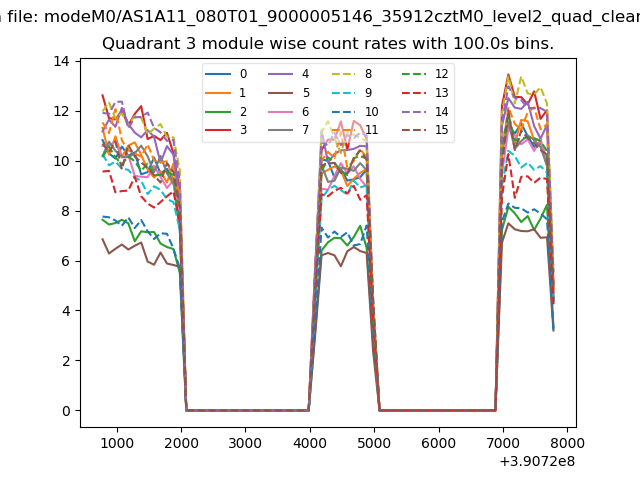 |
 |
| Parameter | Plot |
|---|---|
| CZT HV Monitor | 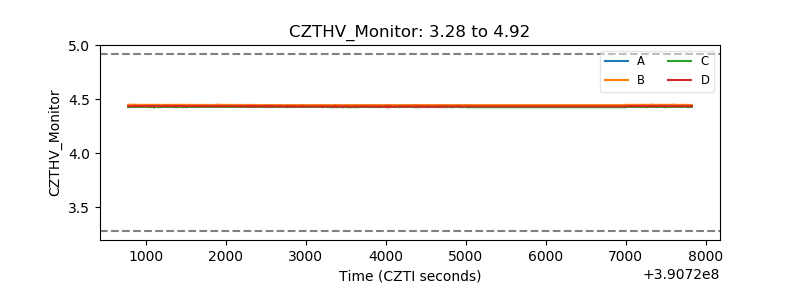 |
| D_VDD | 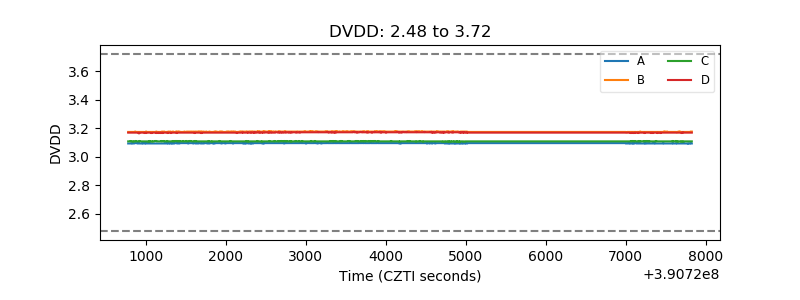 |
| Temperature 1 | 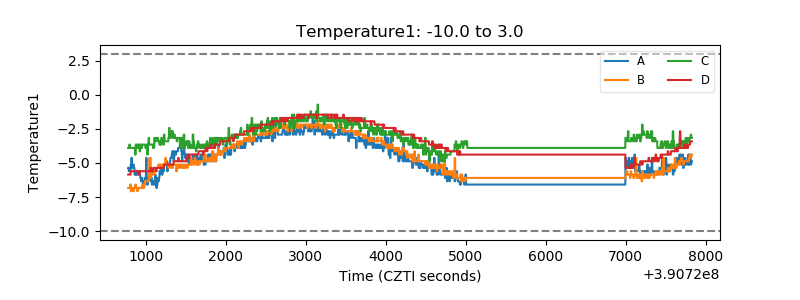 |
| Veto HV Monitor | 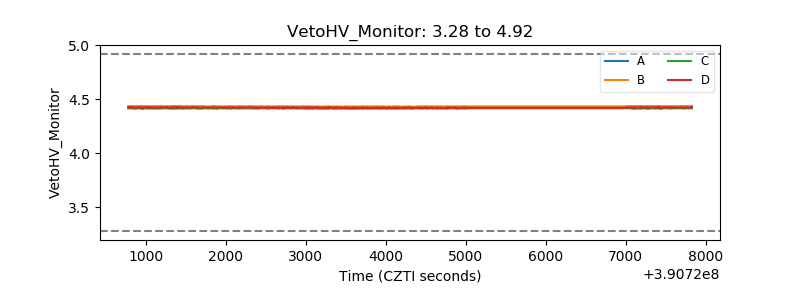 |
| Veto LLD | 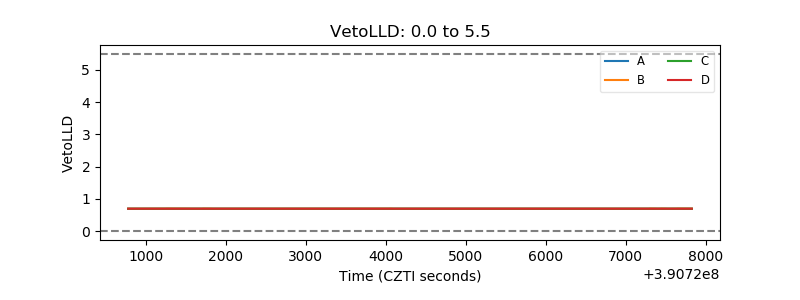 |
| Alpha Counter | 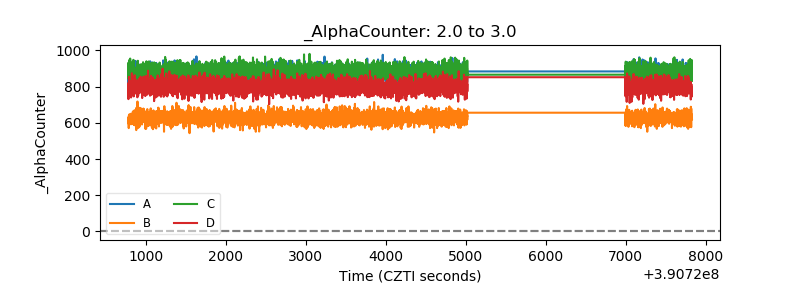 |
| _CPM_Rate | 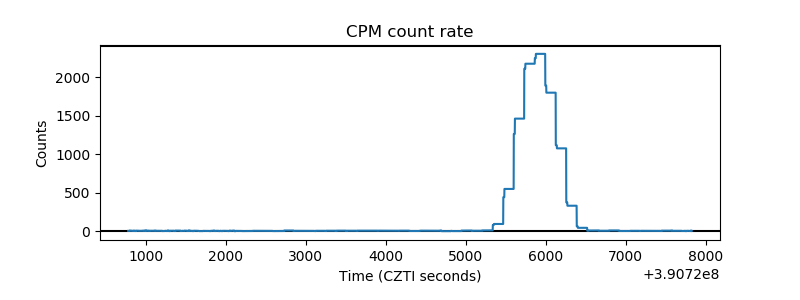 |
| CZT Counter | 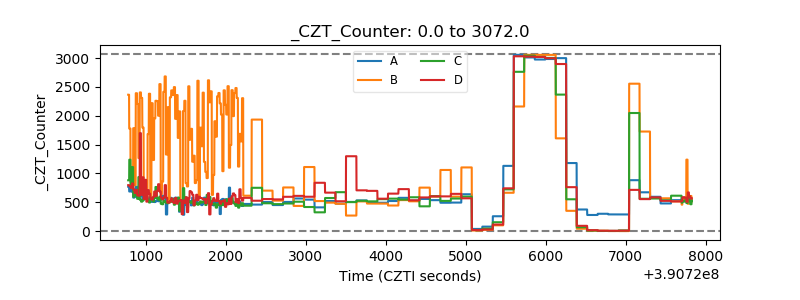 |
| +2.5 Volts monitor | 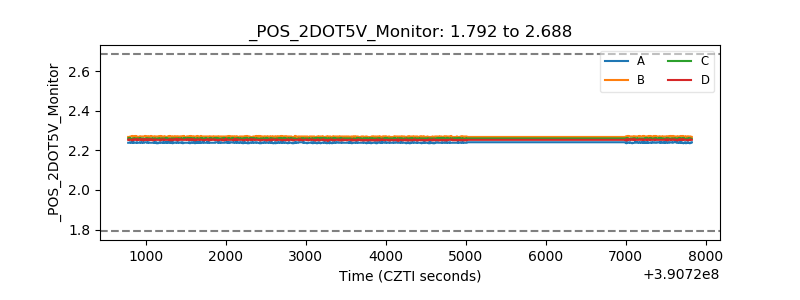 |
| +5 Volts monitor | 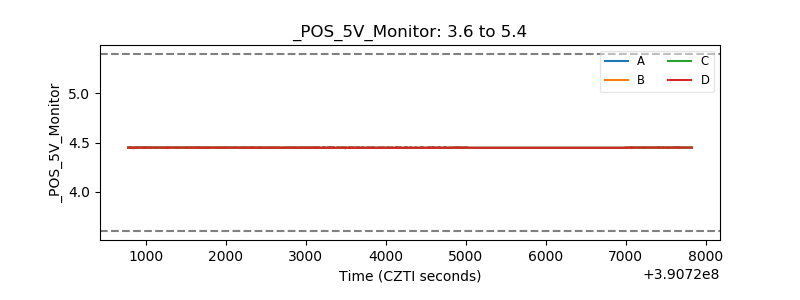 |
| _ROLL_ROT | 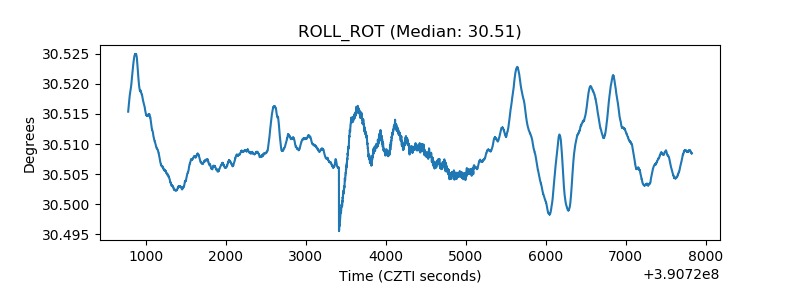 |
| _Roll_DEC | 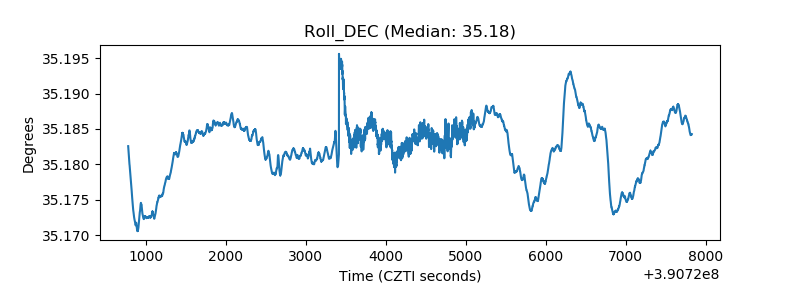 |
| _Roll_RA | 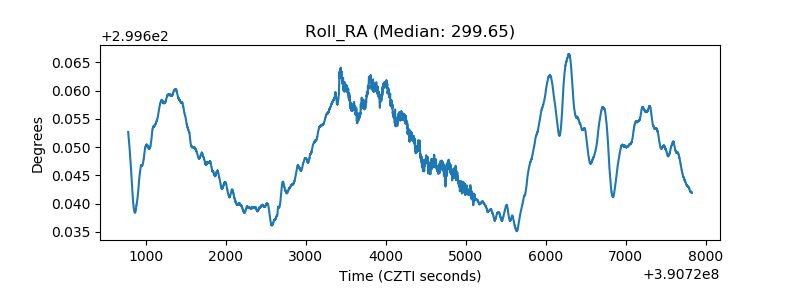 |
| Veto Counter | 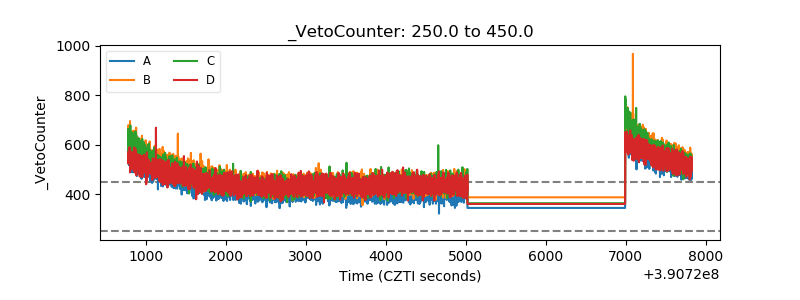 |