| Param | Original file | Final file |
|---|---|---|
| Filename | modeM0/AS1A11_080T01_9000005146_35911cztM0_level2.evt | modeM0/AS1A11_080T01_9000005146_35911cztM0_level2_quad_clean.evt |
| Size (bytes) | 306,521,280 | 38,162,880 |
| Size | 292.3 MB | 36.4 MB |
| Events in quadrant A | 1,706,680 | 255,965 |
| Events in quadrant B | 3,121,092 | 199,381 |
| Events in quadrant C | 1,764,478 | 252,884 |
| Events in quadrant D | 2,474,222 | 221,888 |
| Mode M9 | |||
|---|---|---|---|
| Quadrant | BADHDUFLAG | Total packets | Discarded packets |
| A | 0 | 19 | 2 |
| B | 0 | 19 | 2 |
| C | 0 | 19 | 2 |
| D | 0 | 18 | 1 |
| Mode SS | |||
|---|---|---|---|
| Quadrant | BADHDUFLAG | Total packets | Discarded packets |
| A | 0 | 91 | 34 |
| B | 0 | 98 | 28 |
| C | 0 | 101 | 28 |
| D | 0 | 94 | 24 |
| Mode M0 | |||
|---|---|---|---|
| Quadrant | BADHDUFLAG | Total packets | Discarded packets |
| A | 0 | 10370 | 3387 |
| B | 0 | 16900 | 5684 |
| C | 0 | 10377 | 3254 |
| D | 0 | 15801 | 6446 |
| Quadrant | Total seconds | Saturated seconds | Saturation percentage |
|---|---|---|---|
| A | 3255 | 11 | 0.337942% |
| B | 3049 | 628 | 20.596917% |
| C | 3309 | 29 | 0.876398% |
| D | 2966 | 174 | 5.866487% |
Noise dominated data is calculated using 1-second bins in cleaned event files. If a bin has >2000 counts, and if more than 50% of those come from <1% of pixels, then it is considered to be noise-dominated and hence unusable.
| Quadrant | # 1 sec bins | Bins with >0 counts | Bins with >2000 counts | High rate bins dominated by noise | Noise dominated (total time) | Noise dominated (detector-on time) | Marked lightcurve |
|---|---|---|---|---|---|---|---|
| A | 7024 | 3830 | 2 | 2 | 0.03% | 0.05% | 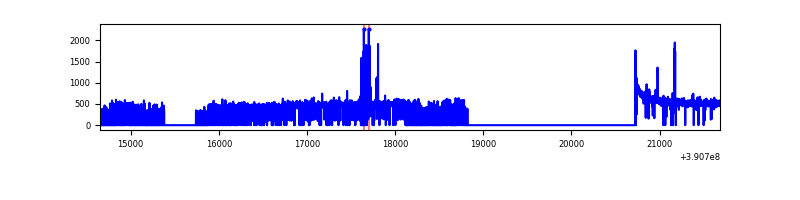 |
| B | 7034 | 3683 | 394 | 394 | 5.60% | 10.70% | 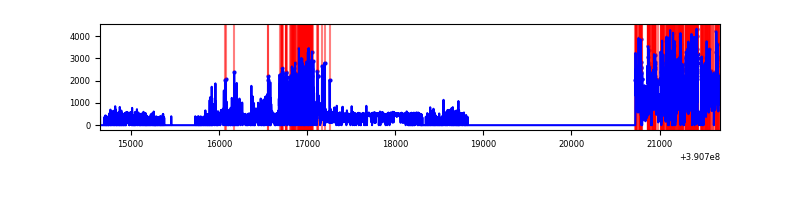 |
| C | 6985 | 3874 | 25 | 25 | 0.36% | 0.65% | 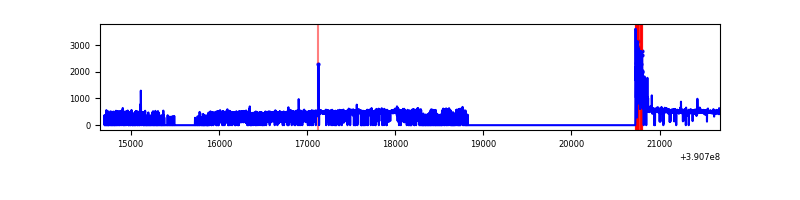 |
| D | 7014 | 3568 | 95 | 95 | 1.35% | 2.66% | 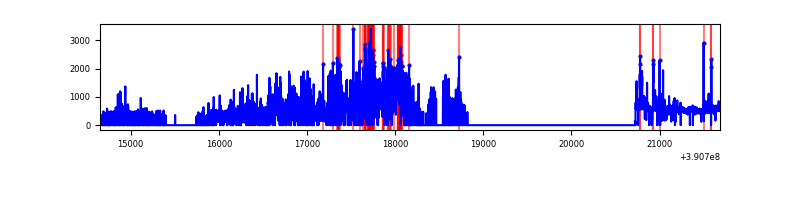 |
Top three noisy pixels from each quadrant. If the there are fewer than three noisy pixels in the level2.evt file, extra rows are filled as -1
| Pixel properties | Quadrant properties | ||||||
|---|---|---|---|---|---|---|---|
| Quadrant | DetID | PixID | Counts | Sigma | Mean | Median | Sigma |
| A | 10 | 83 | 91121 | 1112.36 | 400 | 395 | 81.6 |
| A | 9 | 143 | 61323 | 747.01 | 400 | 395 | 81.6 |
| A | 13 | 254 | 5278 | 59.87 | 400 | 395 | 81.6 |
| B | 5 | 172 | 1325176 | 20299.17 | 338 | 330 | 65.3 |
| B | 5 | 63 | 420094 | 6431.59 | 338 | 330 | 65.3 |
| B | 5 | 255 | 34687 | 526.41 | 338 | 330 | 65.3 |
| C | 15 | 214 | 138914 | 1553.18 | 384 | 387 | 89.2 |
| C | 0 | 10 | 121156 | 1354.08 | 384 | 387 | 89.2 |
| C | 12 | 251 | 8610 | 92.2 | 384 | 387 | 89.2 |
| D | 12 | 227 | 546188 | 6478.19 | 341 | 332 | 84.3 |
| D | 13 | 249 | 249988 | 2962.9 | 341 | 332 | 84.3 |
| D | 8 | 195 | 213053 | 2524.56 | 341 | 332 | 84.3 |
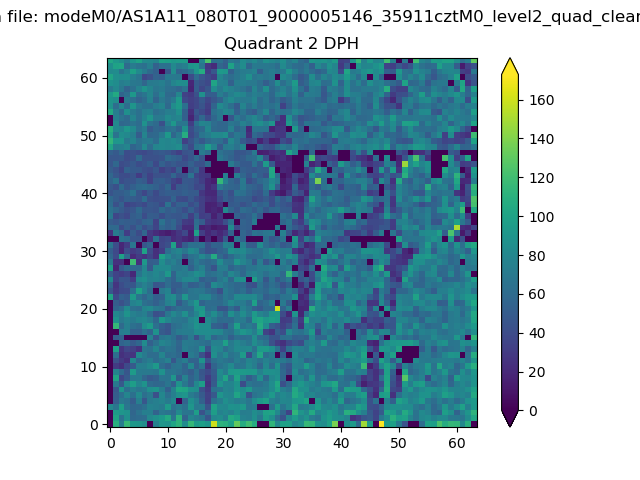
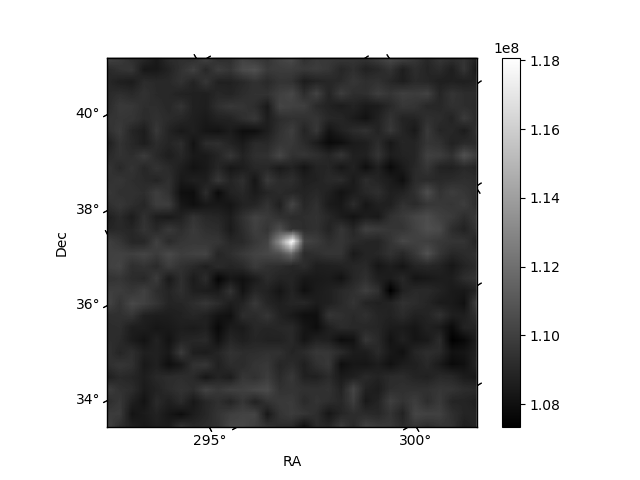
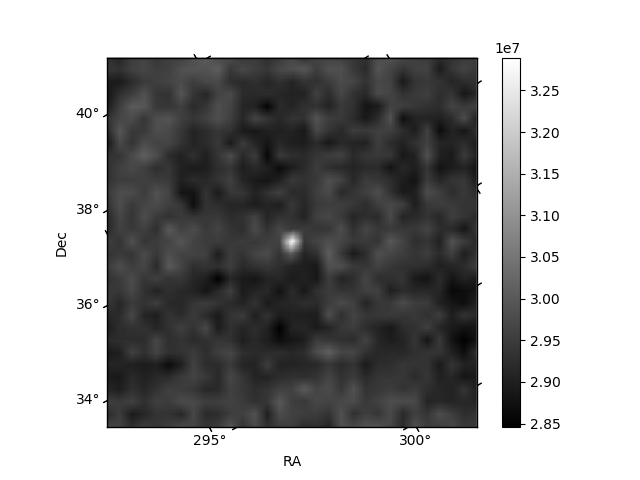
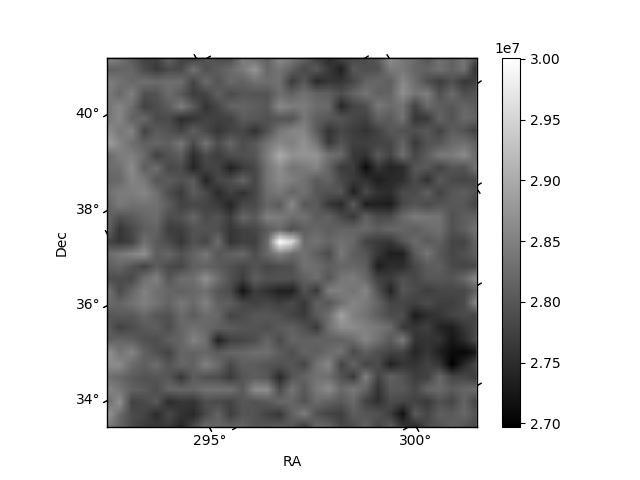
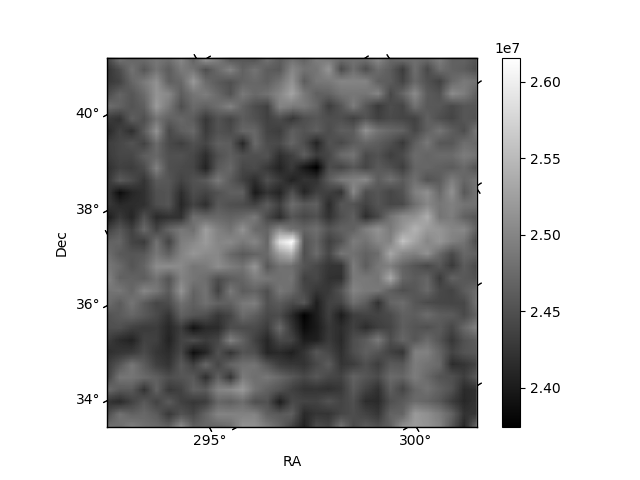
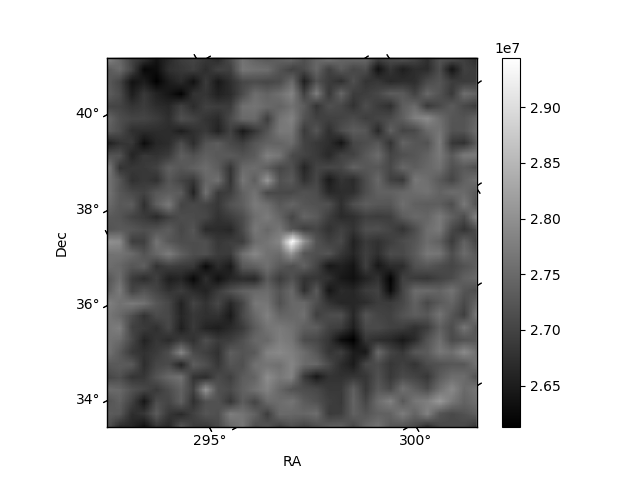
Histogram calculated using DETX and DETY for each event in the final _common_clean file
| Quadrant A | 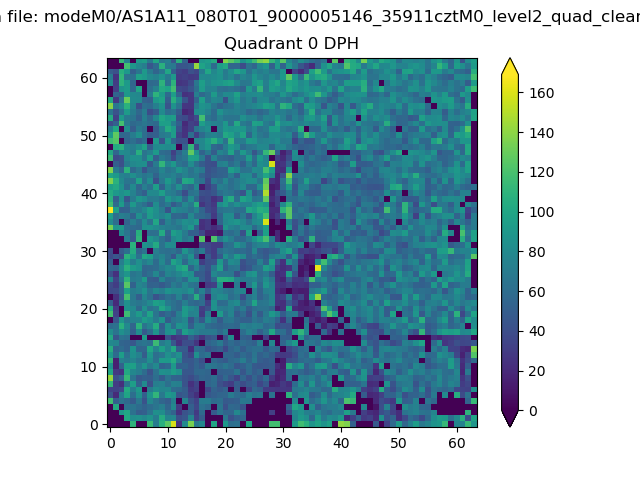 |
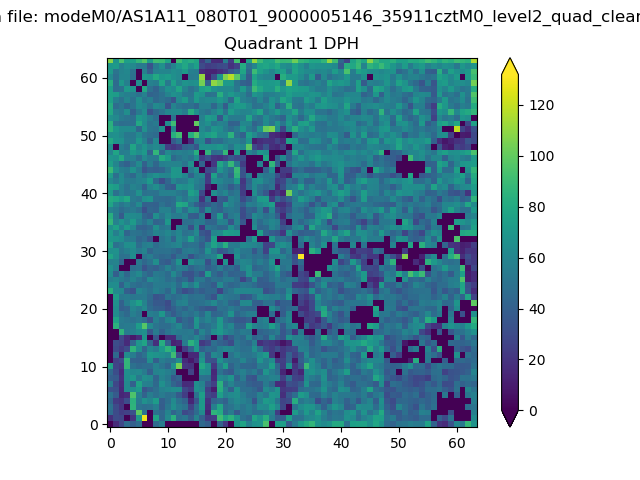 |
Quadrant B |
|---|---|---|---|
| Quadrant D | 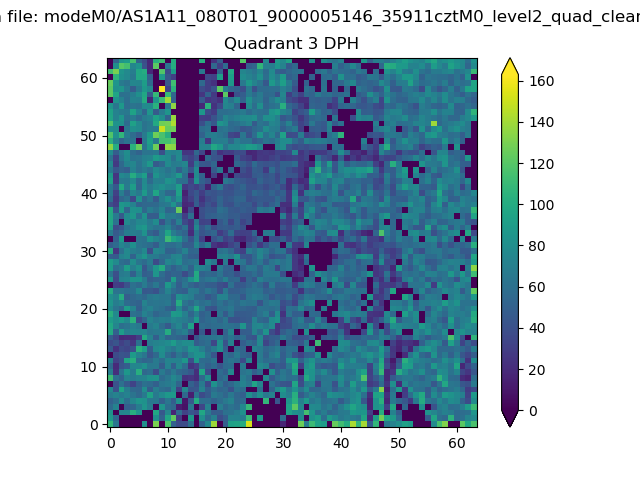 |
 |
Quadrant C |
| Plot type | Count rate plots | Images |
|---|---|---|
| Comparison with Poisson distribution Blue bars denote a histogram of data divided into 1 sec bins. Red curve is a Poisson curve with rate = median count rate of data. |
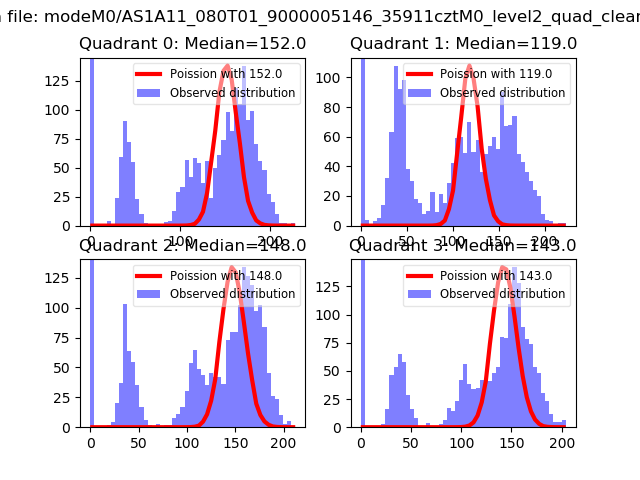 |
 |
| Quadrant-wise count rates Data is divided into 100 sec bins |
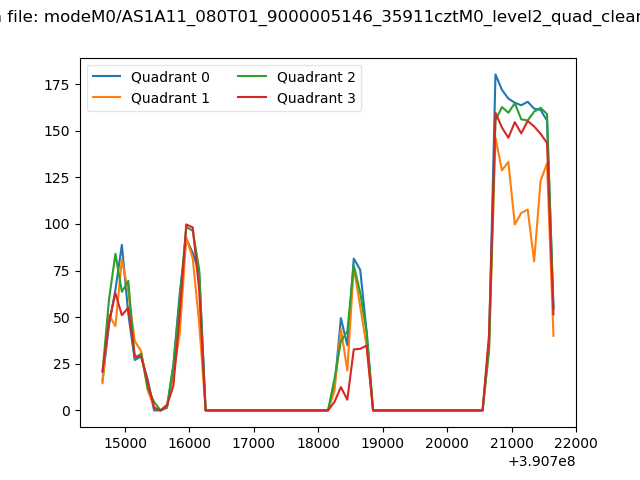 |
|
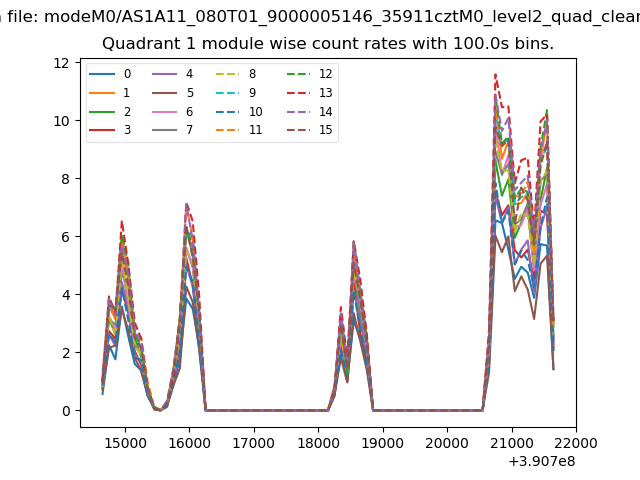
| Module-wise count rates for Quadrant A Data is divided into 100 sec bins |
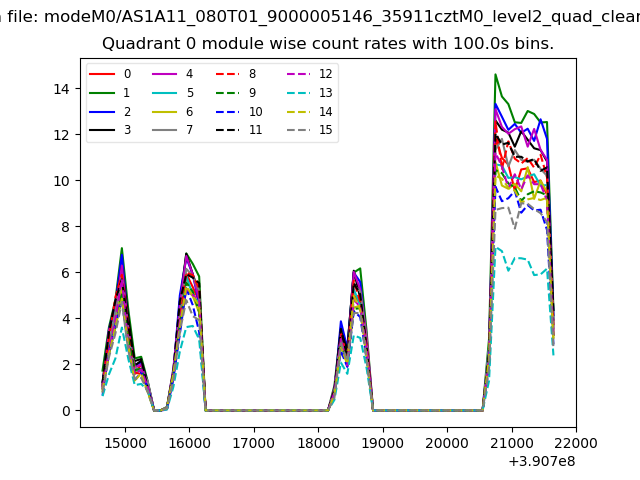 |
 |
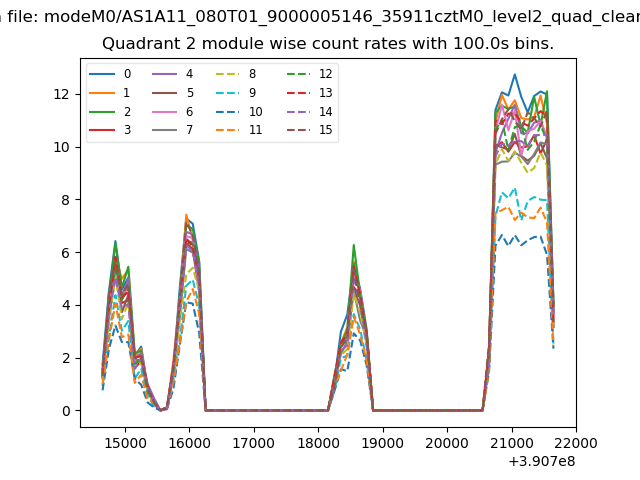
| Module-wise count rates for Quadrant B Data is divided into 100 sec bins |
 |
 |
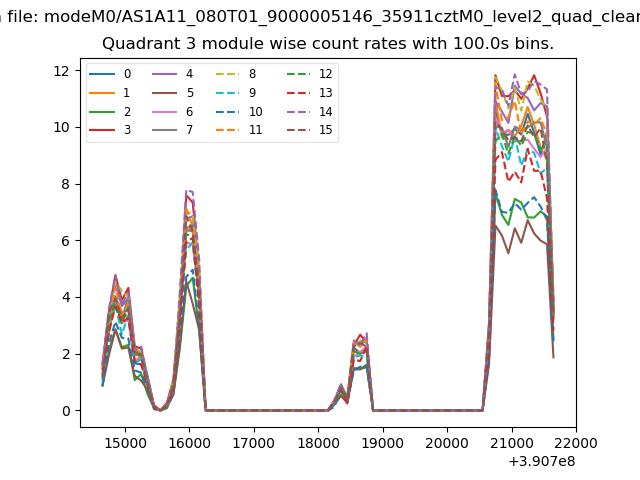
| Module-wise count rates for Quadrant C Data is divided into 100 sec bins |
 |
 |
| Module-wise count rates for Quadrant D Data is divided into 100 sec bins |
 |
 |
| Parameter | Plot |
|---|---|
| CZT HV Monitor | 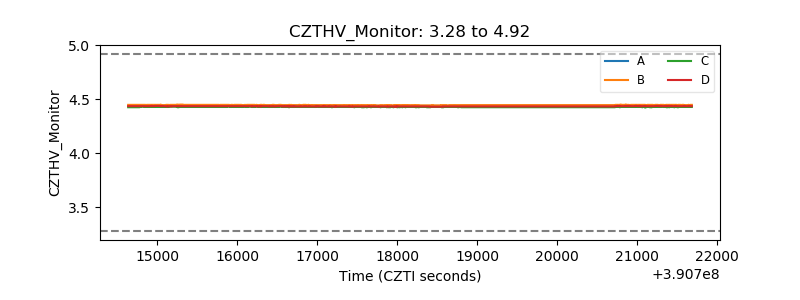 |
| D_VDD | 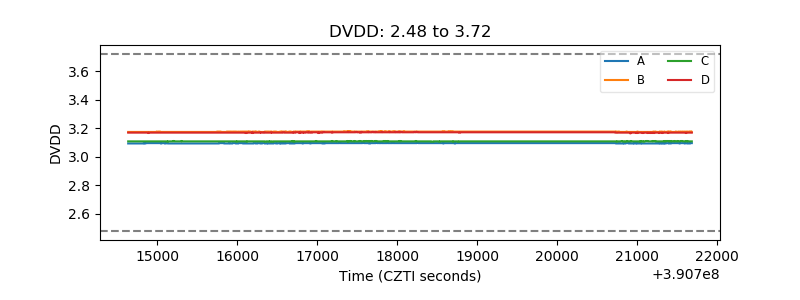 |
| Temperature 1 | 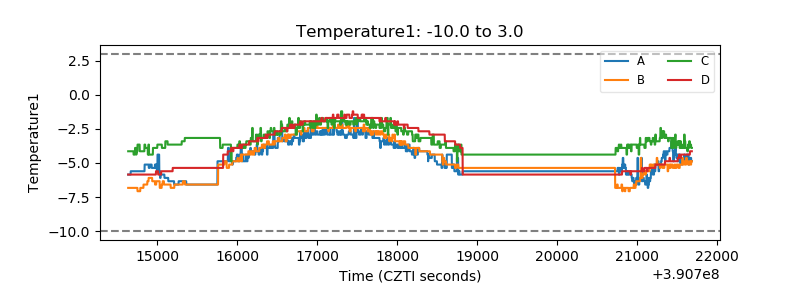 |
| Veto HV Monitor | 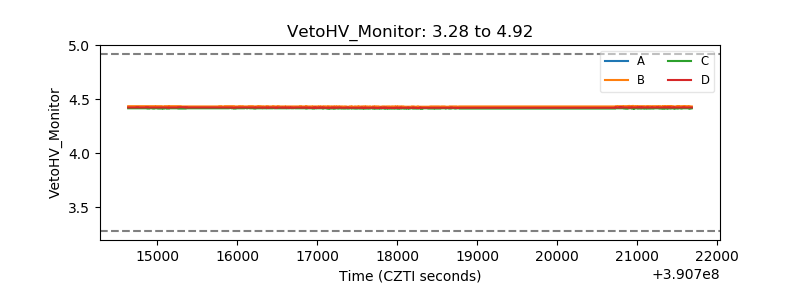 |
| Veto LLD | 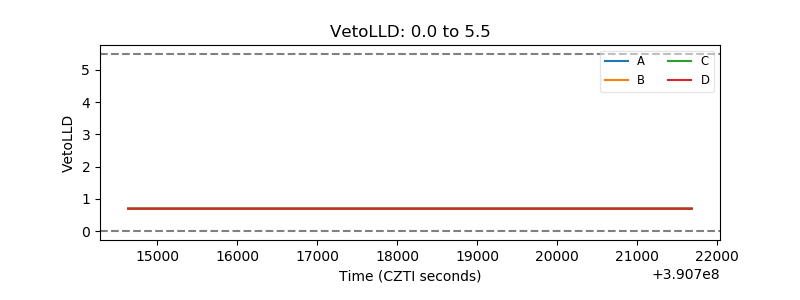 |
| Alpha Counter | 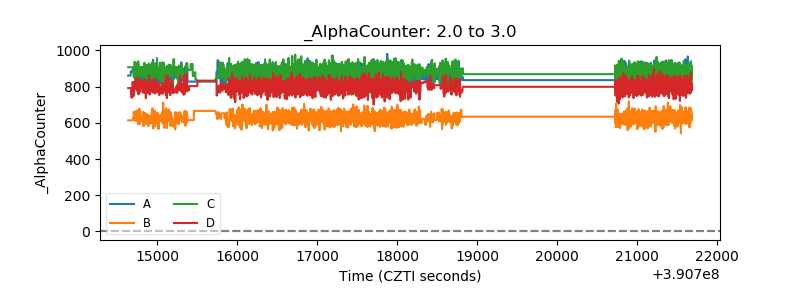 |
| _CPM_Rate | 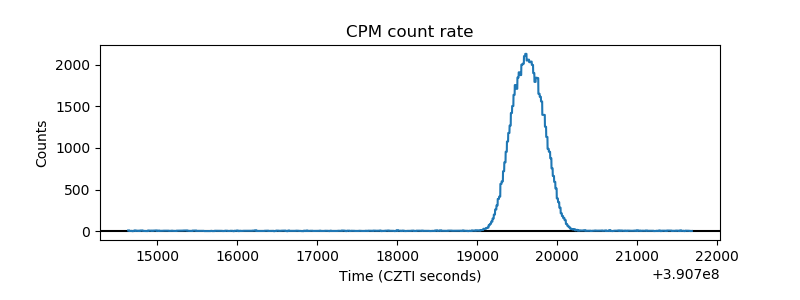 |
| CZT Counter | 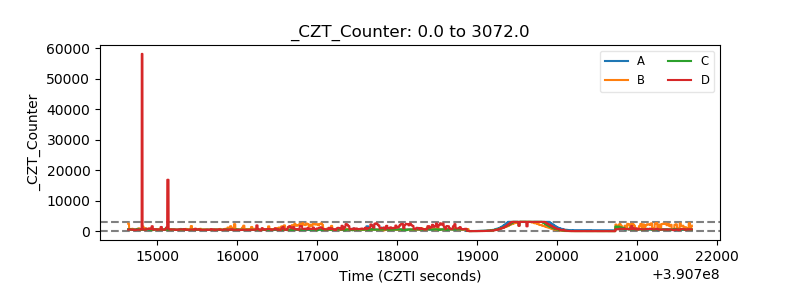 |
| +2.5 Volts monitor | 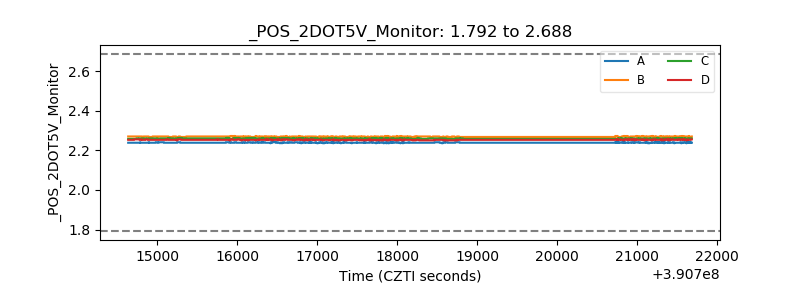 |
| +5 Volts monitor | 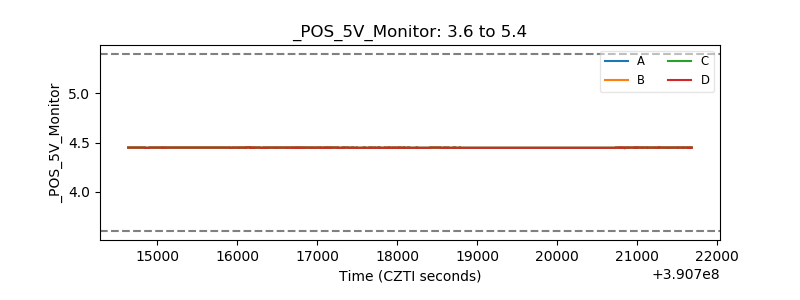 |
| _ROLL_ROT |  |
| _Roll_DEC | 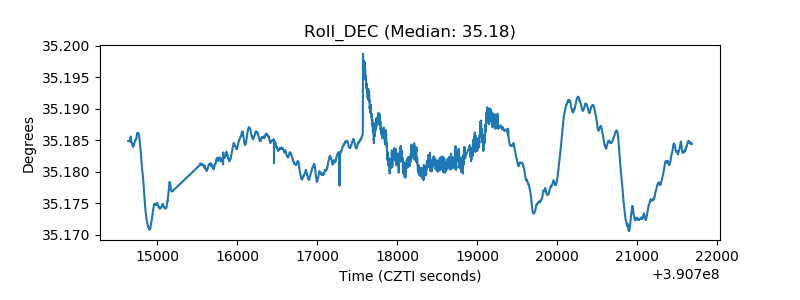 |
| _Roll_RA | 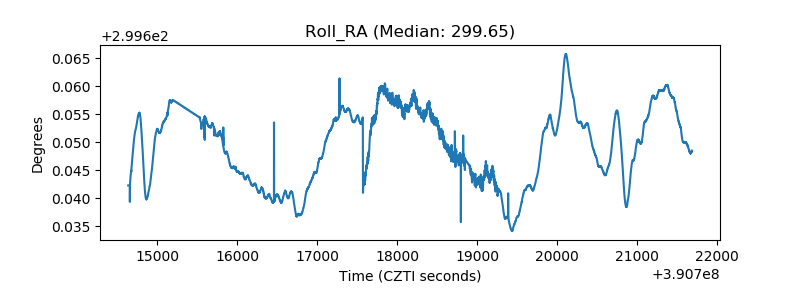 |
| Veto Counter | 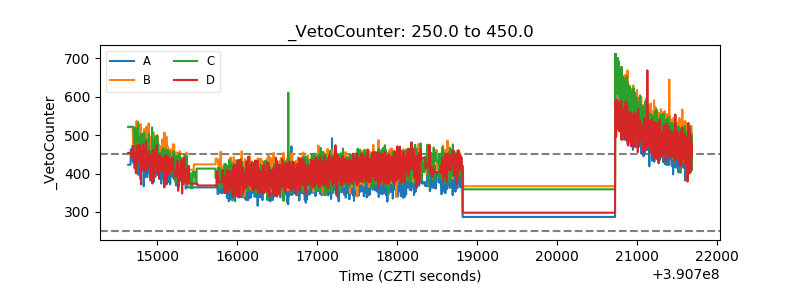 |