| Param | Original file | Final file |
|---|---|---|
| Filename | modeM0/AS1A11_080T01_9000005146_35909cztM0_level2.evt | modeM0/AS1A11_080T01_9000005146_35909cztM0_level2_quad_clean.evt |
| Size (bytes) | 501,056,640 | 79,836,480 |
| Size | 477.8 MB | 76.1 MB |
| Events in quadrant A | 2,824,915 | 528,410 |
| Events in quadrant B | 4,993,207 | 487,497 |
| Events in quadrant C | 3,007,259 | 518,512 |
| Events in quadrant D | 3,967,637 | 489,544 |
| Mode M9 | |||
|---|---|---|---|
| Quadrant | BADHDUFLAG | Total packets | Discarded packets |
| A | 0 | 29 | 0 |
| B | 0 | 29 | 0 |
| C | 0 | 29 | 0 |
| D | 0 | 30 | 0 |
| Mode SS | |||
|---|---|---|---|
| Quadrant | BADHDUFLAG | Total packets | Discarded packets |
| A | 0 | 116 | 0 |
| B | 0 | 116 | 0 |
| C | 0 | 116 | 0 |
| D | 0 | 116 | 0 |
| Mode M0 | |||
|---|---|---|---|
| Quadrant | BADHDUFLAG | Total packets | Discarded packets |
| A | 0 | 11901 | 3 |
| B | 0 | 18490 | 2 |
| C | 0 | 12326 | 2 |
| D | 0 | 15511 | 2 |
| Quadrant | Total seconds | Saturated seconds | Saturation percentage |
|---|---|---|---|
| A | 5619 | 23 | 0.409326% |
| B | 5619 | 671 | 11.941627% |
| C | 5619 | 71 | 1.263570% |
| D | 5619 | 139 | 2.473750% |
Noise dominated data is calculated using 1-second bins in cleaned event files. If a bin has >2000 counts, and if more than 50% of those come from <1% of pixels, then it is considered to be noise-dominated and hence unusable.
| Quadrant | # 1 sec bins | Bins with >0 counts | Bins with >2000 counts | High rate bins dominated by noise | Noise dominated (total time) | Noise dominated (detector-on time) | Marked lightcurve |
|---|---|---|---|---|---|---|---|
| A | 7353 | 5620 | 15 | 15 | 0.20% | 0.27% | 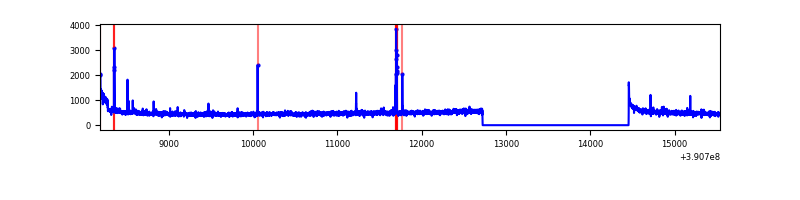 |
| B | 7353 | 5620 | 478 | 478 | 6.50% | 8.51% | 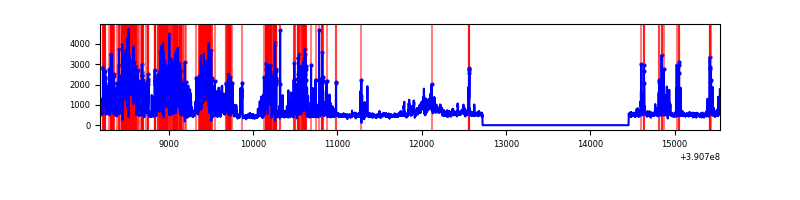 |
| C | 7353 | 5620 | 63 | 63 | 0.86% | 1.12% | 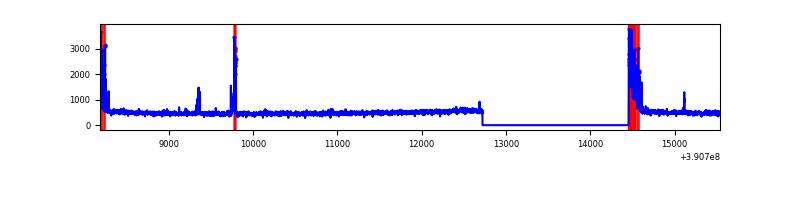 |
| D | 7353 | 5620 | 113 | 113 | 1.54% | 2.01% | 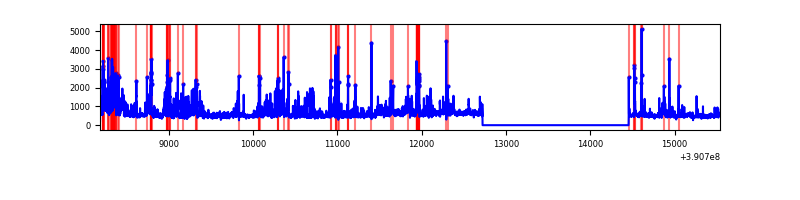 |
Top three noisy pixels from each quadrant. If the there are fewer than three noisy pixels in the level2.evt file, extra rows are filled as -1
| Pixel properties | Quadrant properties | ||||||
|---|---|---|---|---|---|---|---|
| Quadrant | DetID | PixID | Counts | Sigma | Mean | Median | Sigma |
| A | 10 | 83 | 168162 | 1252.4 | 658 | 648 | 133.8 |
| A | 9 | 143 | 57345 | 423.89 | 658 | 648 | 133.8 |
| A | 15 | 169 | 47371 | 349.32 | 658 | 648 | 133.8 |
| B | 5 | 172 | 2170329 | 18184.3 | 623 | 608 | 119.3 |
| B | 5 | 63 | 199542 | 1667.25 | 623 | 608 | 119.3 |
| B | 5 | 255 | 145096 | 1210.95 | 623 | 608 | 119.3 |
| C | 0 | 10 | 242932 | 1647.85 | 631 | 637 | 147.0 |
| C | 15 | 214 | 239422 | 1623.98 | 631 | 637 | 147.0 |
| C | 9 | 69 | 63394 | 426.81 | 631 | 637 | 147.0 |
| D | 7 | 223 | 572964 | 3706.38 | 627 | 611 | 154.4 |
| D | 8 | 195 | 326196 | 2108.39 | 627 | 611 | 154.4 |
| D | 13 | 249 | 260630 | 1683.8 | 627 | 611 | 154.4 |
Histogram calculated using DETX and DETY for each event in the final _common_clean file
| Quadrant A |  |
 |
Quadrant B |
|---|---|---|---|
| Quadrant D | 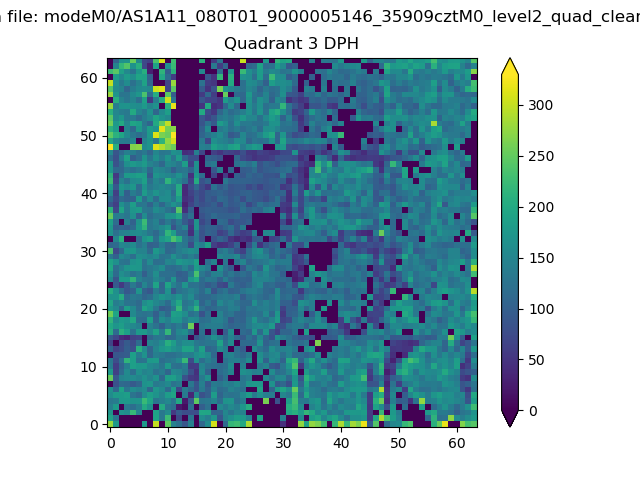 |
 |
Quadrant C |
| Plot type | Count rate plots | Images |
|---|---|---|
| Comparison with Poisson distribution Blue bars denote a histogram of data divided into 1 sec bins. Red curve is a Poisson curve with rate = median count rate of data. |
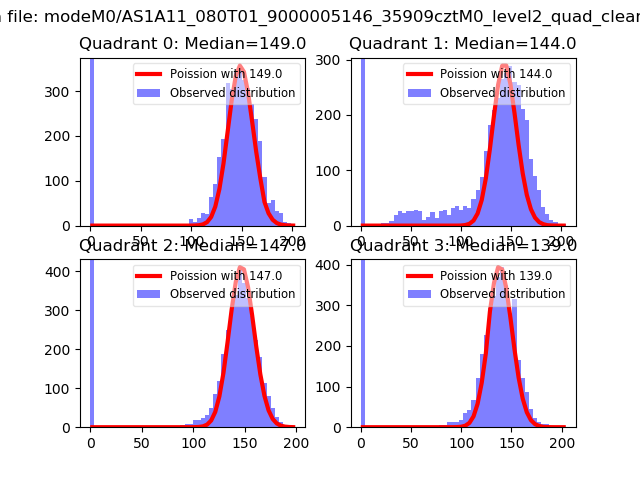 |
 |
| Quadrant-wise count rates Data is divided into 100 sec bins |
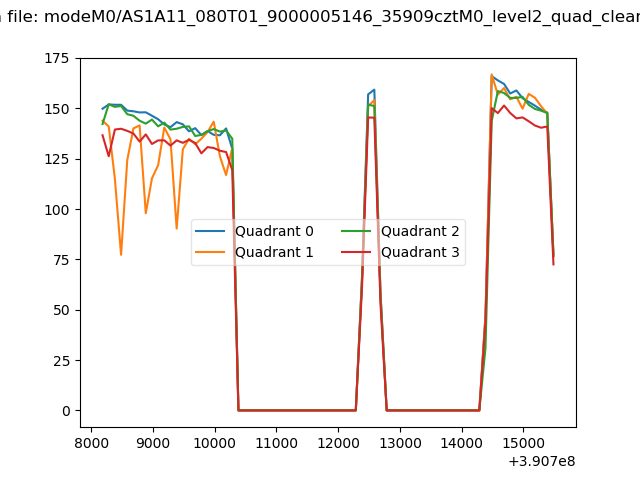 |
|
| Module-wise count rates for Quadrant A Data is divided into 100 sec bins |
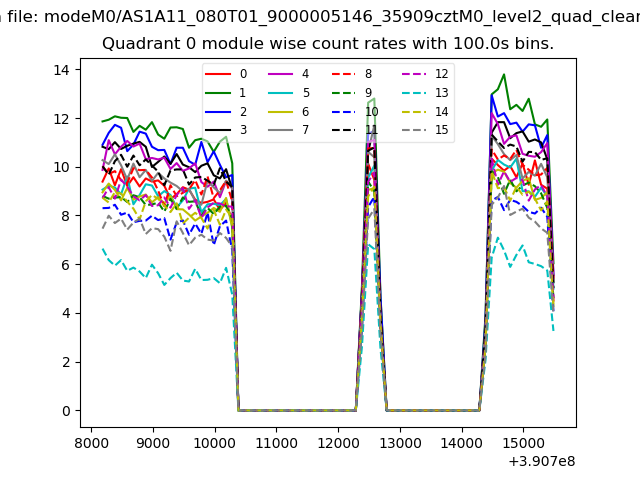 |
 |
| Module-wise count rates for Quadrant B Data is divided into 100 sec bins |
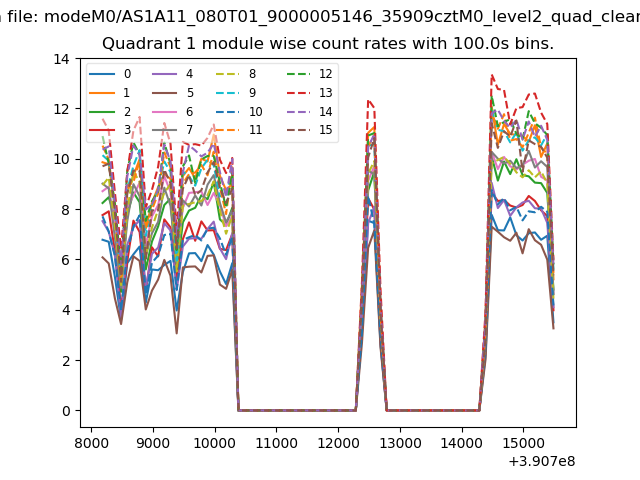 |
 |
| Module-wise count rates for Quadrant C Data is divided into 100 sec bins |
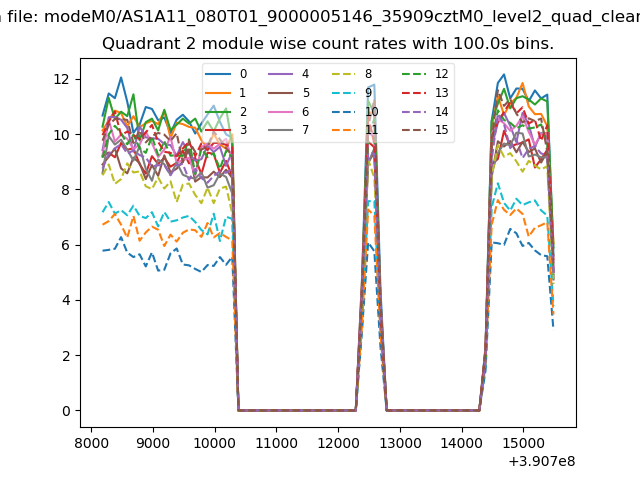 |
 |
| Module-wise count rates for Quadrant D Data is divided into 100 sec bins |
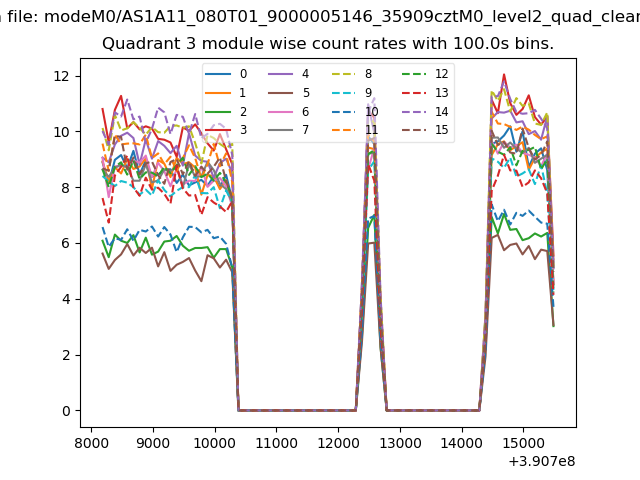 |
 |
| Parameter | Plot |
|---|---|
| CZT HV Monitor | 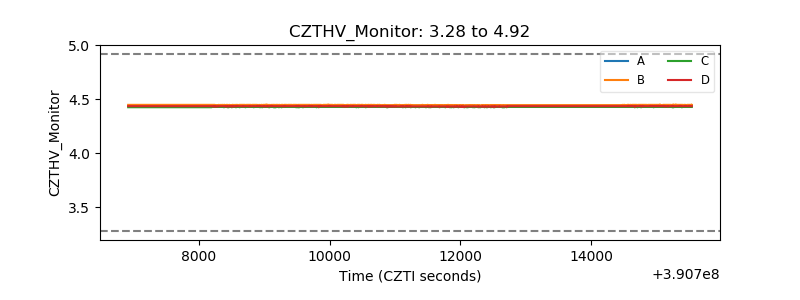 |
| D_VDD | 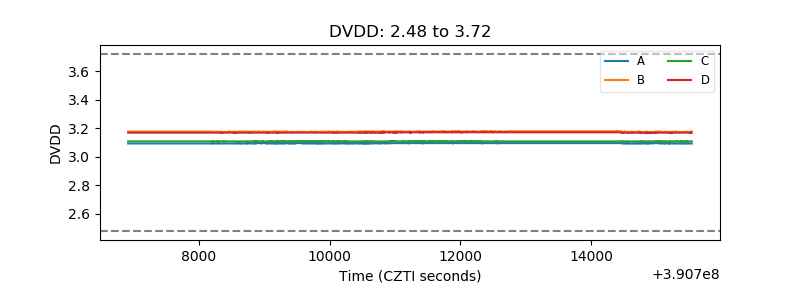 |
| Temperature 1 | 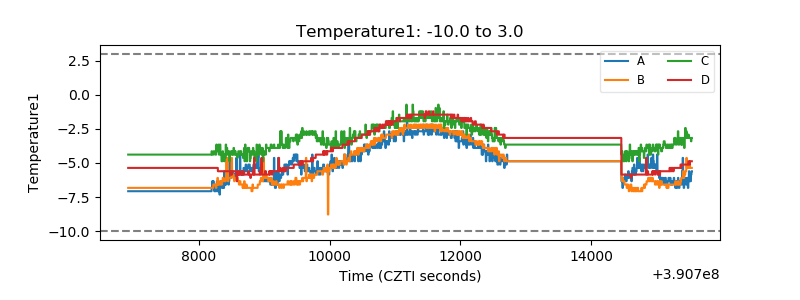 |
| Veto HV Monitor | 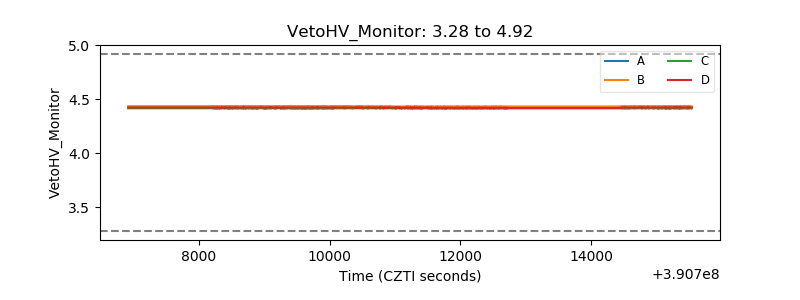 |
| Veto LLD | 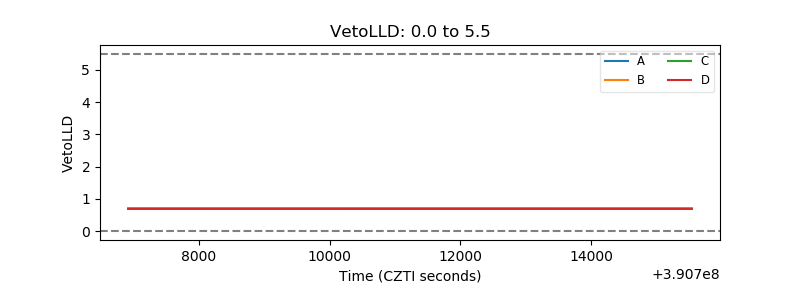 |
| Alpha Counter | 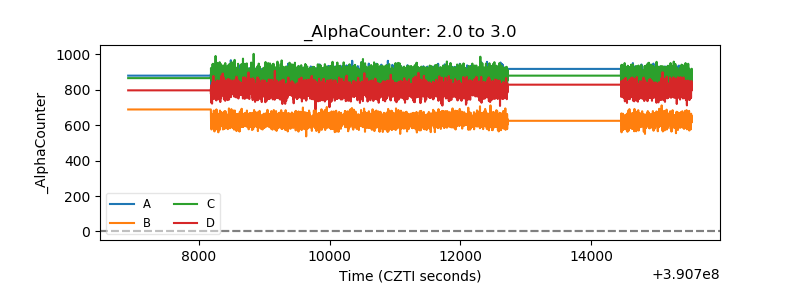 |
| _CPM_Rate | 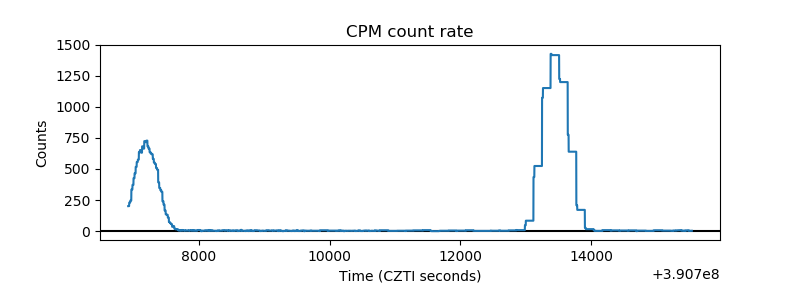 |
| CZT Counter | 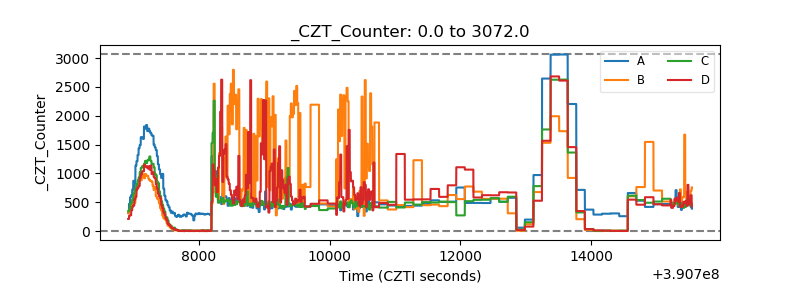 |
| +2.5 Volts monitor | 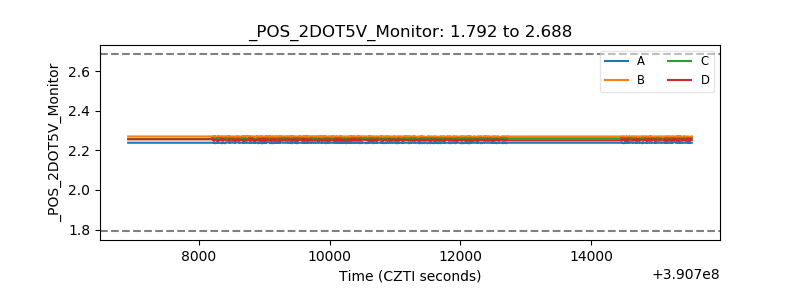 |
| +5 Volts monitor | 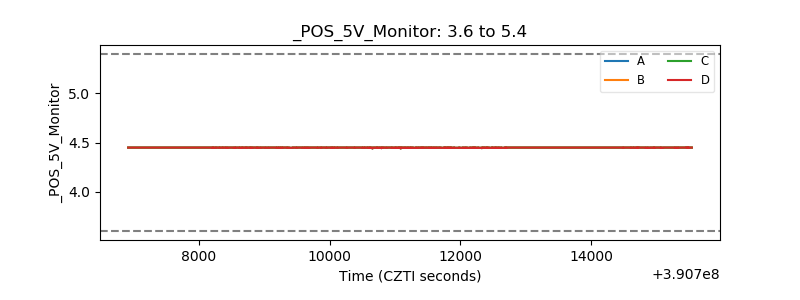 |
| _ROLL_ROT | 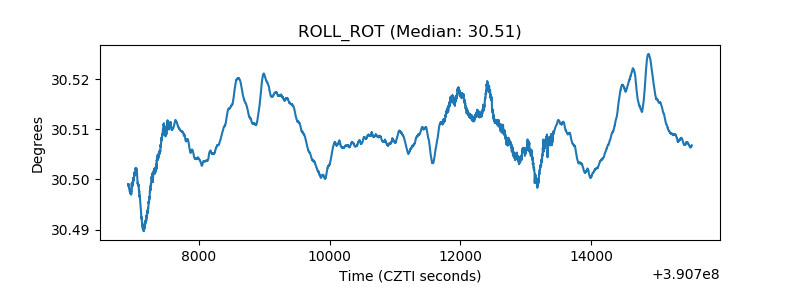 |
| _Roll_DEC | 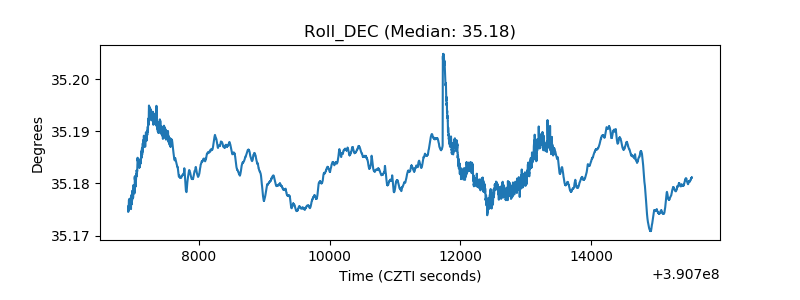 |
| _Roll_RA | 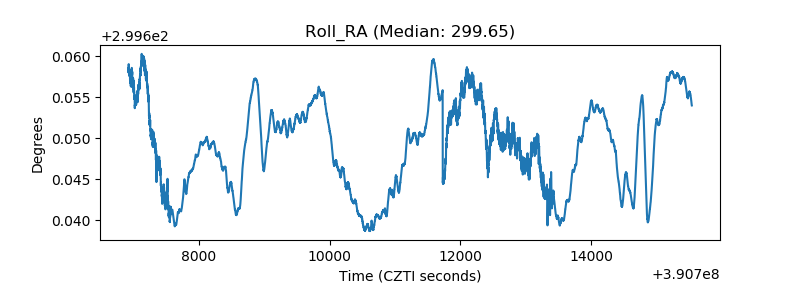 |
| Veto Counter | 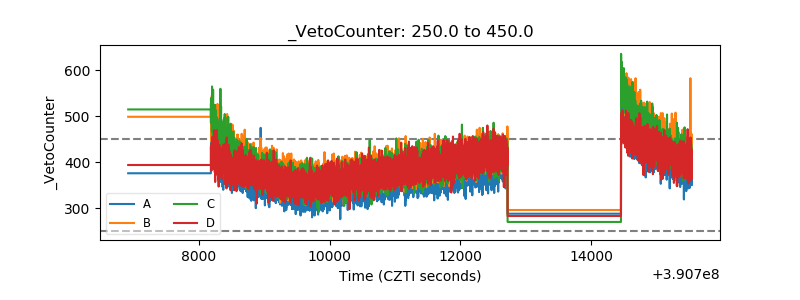 |