| Param | Original file | Final file |
|---|---|---|
| Filename | modeM0/AS1A11_080T01_9000005146_35904cztM0_level2.evt | modeM0/AS1A11_080T01_9000005146_35904cztM0_level2_quad_clean.evt |
| Size (bytes) | 466,320,960 | 100,681,920 |
| Size | 444.7 MB | 96.0 MB |
| Events in quadrant A | 2,984,867 | 678,322 |
| Events in quadrant B | 3,457,638 | 665,516 |
| Events in quadrant C | 3,133,764 | 665,990 |
| Events in quadrant D | 4,148,356 | 629,696 |
| Mode M9 | |||
|---|---|---|---|
| Quadrant | BADHDUFLAG | Total packets | Discarded packets |
| A | 0 | 21 | 0 |
| B | 0 | 21 | 0 |
| C | 0 | 21 | 0 |
| D | 0 | 22 | 0 |
| Mode SS | |||
|---|---|---|---|
| Quadrant | BADHDUFLAG | Total packets | Discarded packets |
| A | 0 | 118 | 0 |
| B | 0 | 118 | 0 |
| C | 0 | 118 | 0 |
| D | 0 | 118 | 0 |
| Mode M0 | |||
|---|---|---|---|
| Quadrant | BADHDUFLAG | Total packets | Discarded packets |
| A | 0 | 12416 | 3 |
| B | 0 | 13939 | 2 |
| C | 0 | 12572 | 2 |
| D | 0 | 16266 | 2 |
| Quadrant | Total seconds | Saturated seconds | Saturation percentage |
|---|---|---|---|
| A | 5867 | 12 | 0.204534% |
| B | 5867 | 149 | 2.539628% |
| C | 5867 | 82 | 1.397648% |
| D | 5867 | 182 | 3.102096% |
Noise dominated data is calculated using 1-second bins in cleaned event files. If a bin has >2000 counts, and if more than 50% of those come from <1% of pixels, then it is considered to be noise-dominated and hence unusable.
| Quadrant | # 1 sec bins | Bins with >0 counts | Bins with >2000 counts | High rate bins dominated by noise | Noise dominated (total time) | Noise dominated (detector-on time) | Marked lightcurve |
|---|---|---|---|---|---|---|---|
| A | 7179 | 5868 | 3 | 3 | 0.04% | 0.05% | 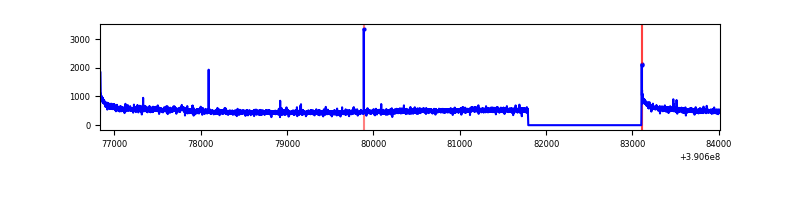 |
| B | 7179 | 5868 | 95 | 95 | 1.32% | 1.62% | 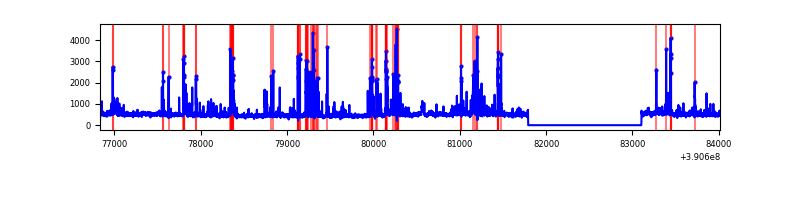 |
| C | 7179 | 5868 | 46 | 46 | 0.64% | 0.78% | 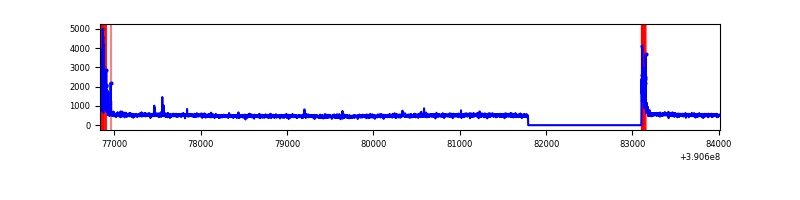 |
| D | 7179 | 5868 | 129 | 129 | 1.80% | 2.20% | 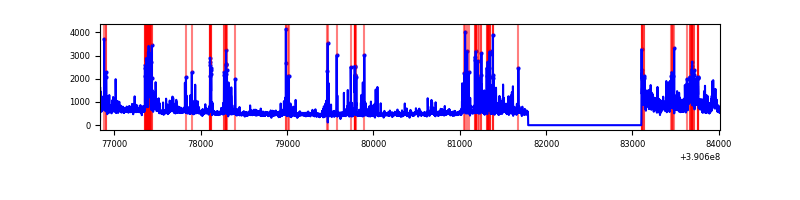 |
Top three noisy pixels from each quadrant. If the there are fewer than three noisy pixels in the level2.evt file, extra rows are filled as -1
| Pixel properties | Quadrant properties | ||||||
|---|---|---|---|---|---|---|---|
| Quadrant | DetID | PixID | Counts | Sigma | Mean | Median | Sigma |
| A | 10 | 83 | 174189 | 1190.12 | 707 | 694 | 145.8 |
| A | 15 | 169 | 53326 | 361.04 | 707 | 694 | 145.8 |
| A | 13 | 254 | 10087 | 64.43 | 707 | 694 | 145.8 |
| B | 5 | 172 | 476018 | 3572.33 | 692 | 676 | 133.1 |
| B | 5 | 255 | 141785 | 1060.47 | 692 | 676 | 133.1 |
| B | 0 | 213 | 60791 | 451.78 | 692 | 676 | 133.1 |
| C | 15 | 214 | 245813 | 1538.83 | 682 | 689 | 159.3 |
| C | 0 | 10 | 221939 | 1388.96 | 682 | 689 | 159.3 |
| C | 0 | 207 | 7414 | 42.22 | 682 | 689 | 159.3 |
| D | 8 | 195 | 409382 | 2454.19 | 677 | 660 | 166.5 |
| D | 2 | 250 | 311658 | 1867.4 | 677 | 660 | 166.5 |
| D | 12 | 227 | 282157 | 1690.26 | 677 | 660 | 166.5 |
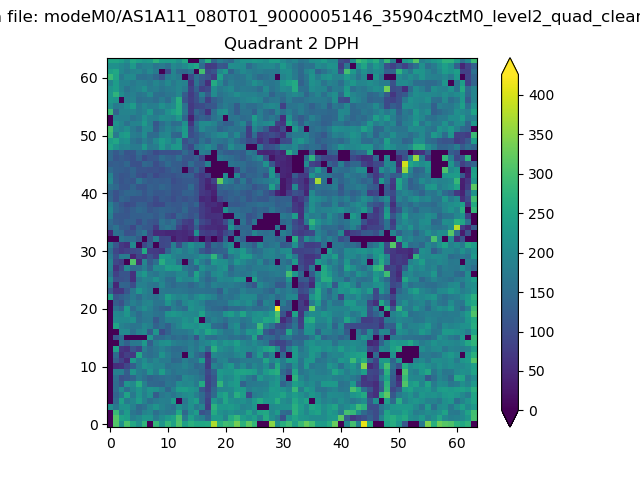
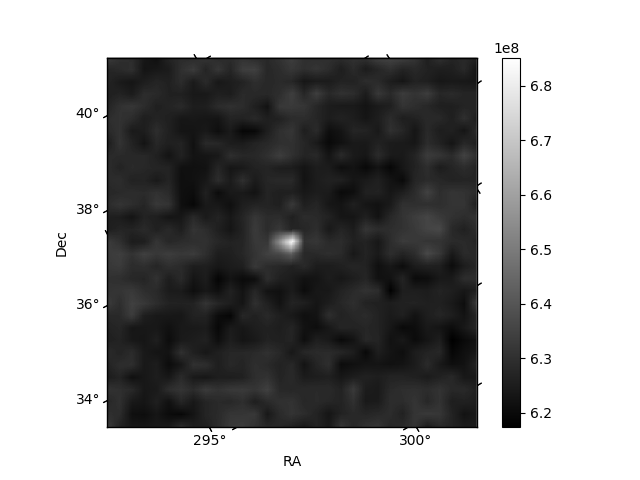
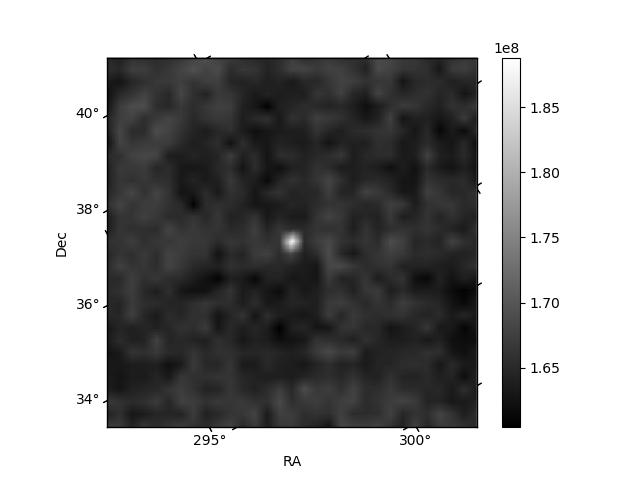
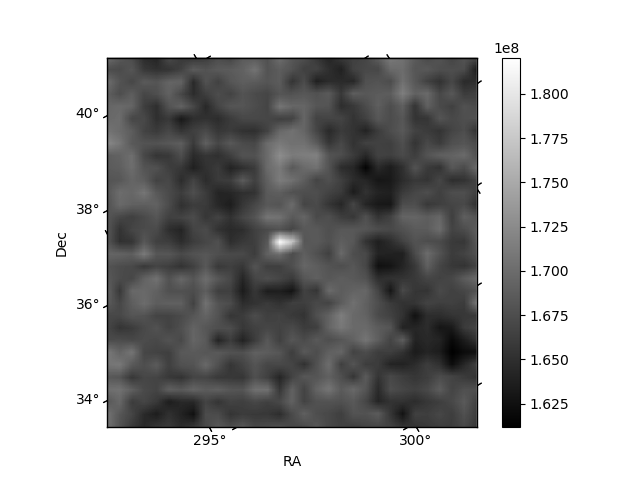
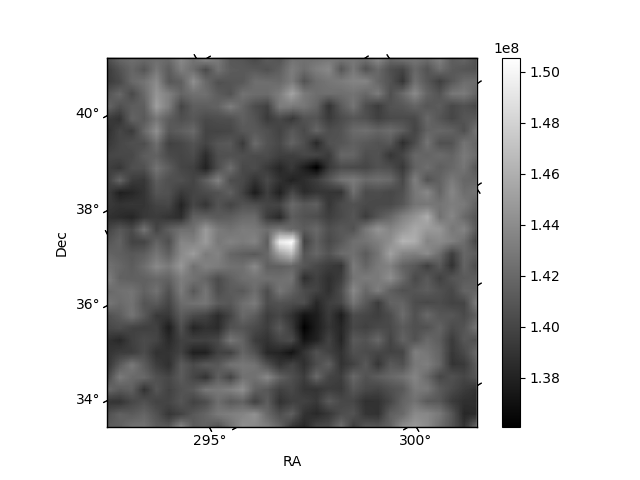
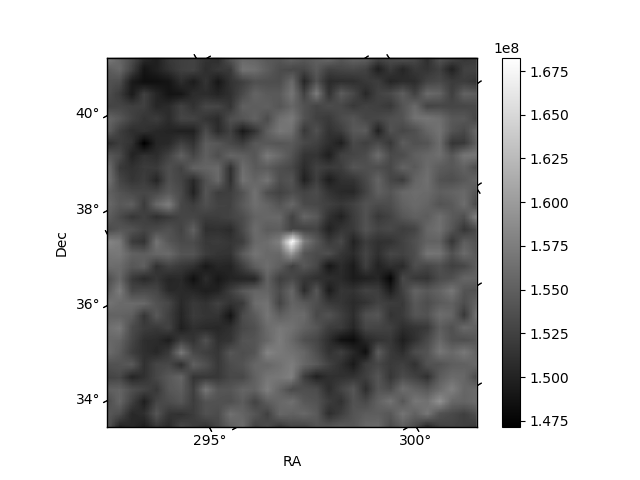
Histogram calculated using DETX and DETY for each event in the final _common_clean file
| Quadrant A | 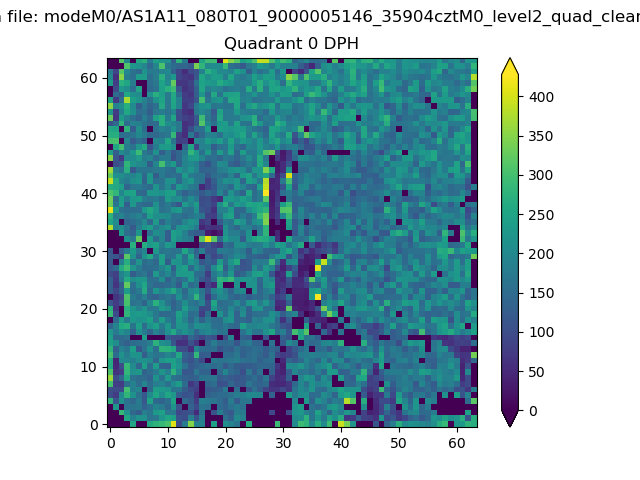 |
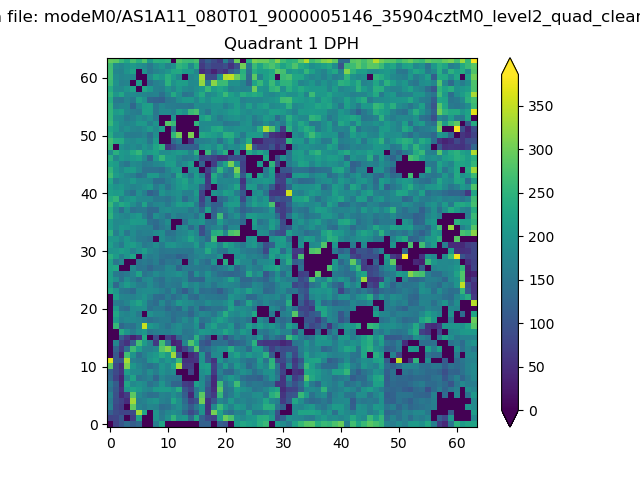 |
Quadrant B |
|---|---|---|---|
| Quadrant D | 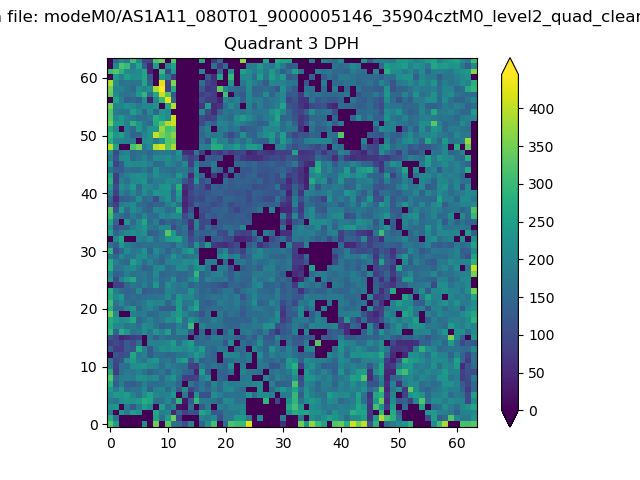 |
 |
Quadrant C |
| Plot type | Count rate plots | Images |
|---|---|---|
| Comparison with Poisson distribution Blue bars denote a histogram of data divided into 1 sec bins. Red curve is a Poisson curve with rate = median count rate of data. |
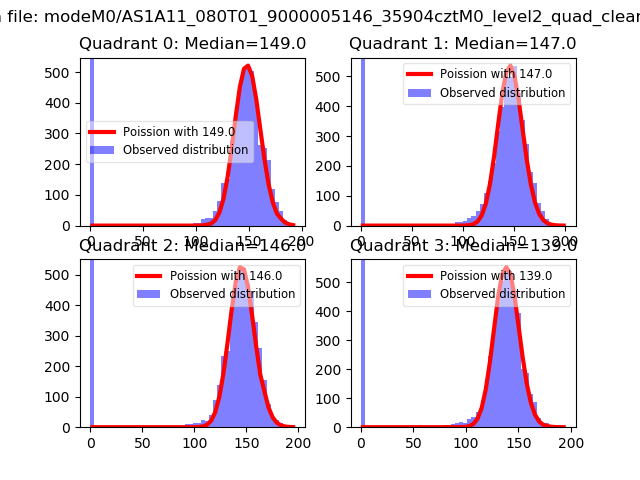 |
 |
| Quadrant-wise count rates Data is divided into 100 sec bins |
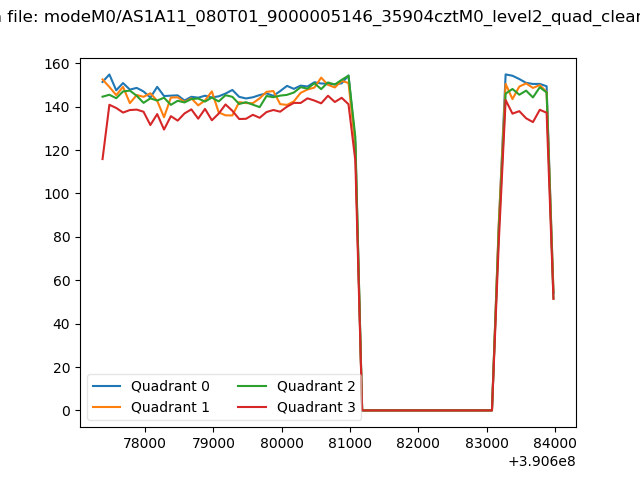 |
|
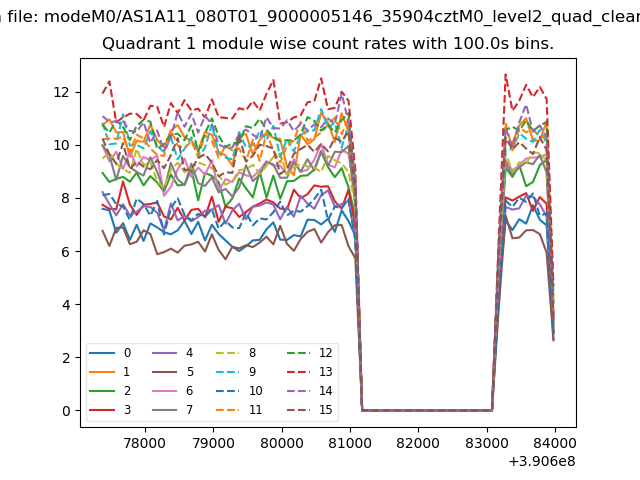
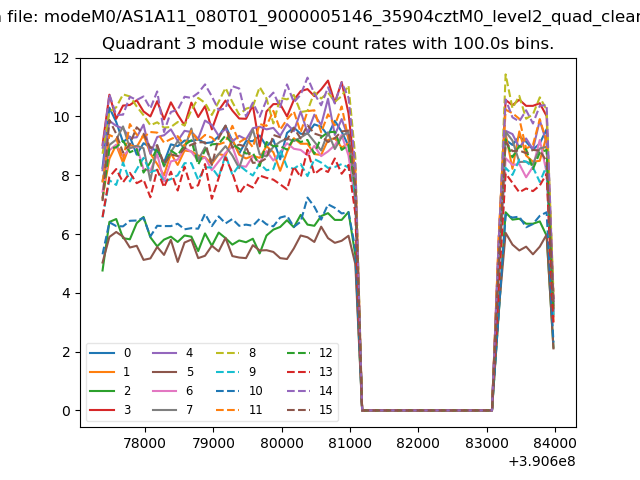
| Module-wise count rates for Quadrant A Data is divided into 100 sec bins |
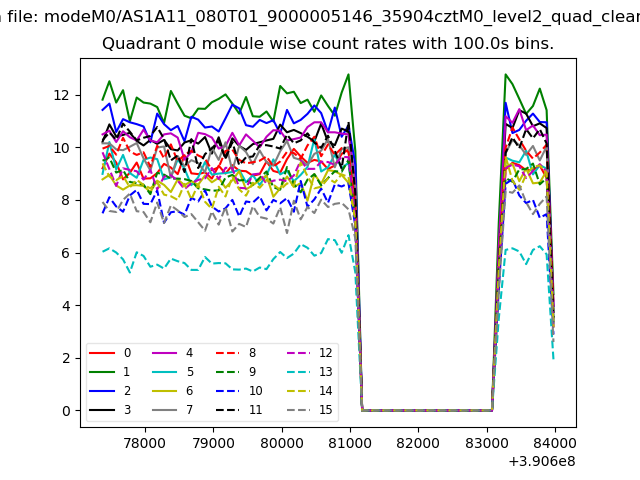 |
 |
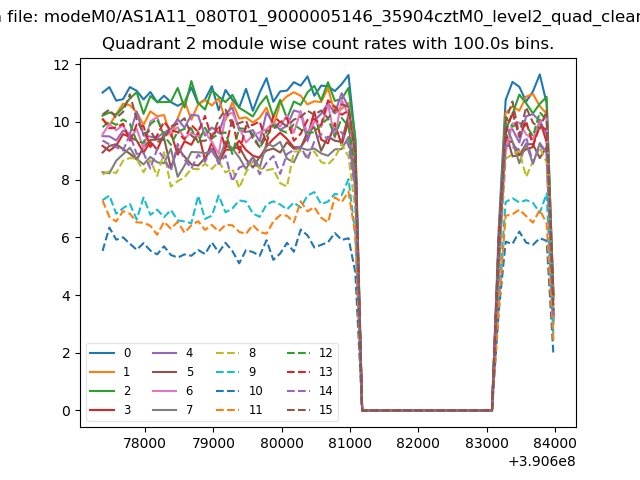
| Module-wise count rates for Quadrant B Data is divided into 100 sec bins |
 |
 |
| Module-wise count rates for Quadrant C Data is divided into 100 sec bins |
 |
 |
| Module-wise count rates for Quadrant D Data is divided into 100 sec bins |
 |
 |
| Parameter | Plot |
|---|---|
| CZT HV Monitor | 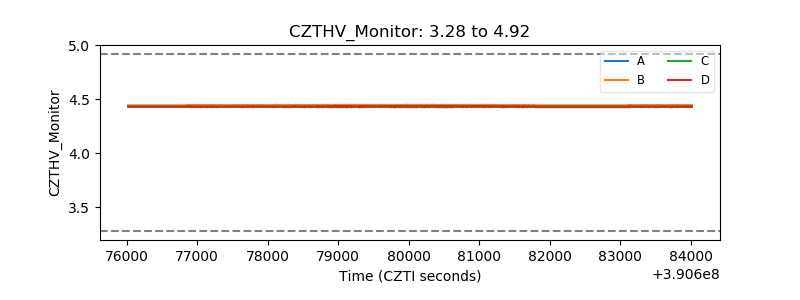 |
| D_VDD | 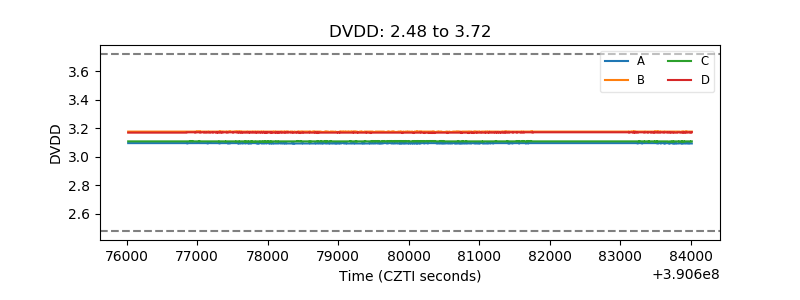 |
| Temperature 1 | 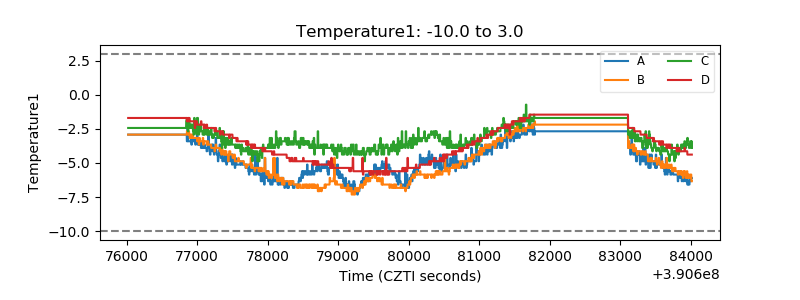 |
| Veto HV Monitor | 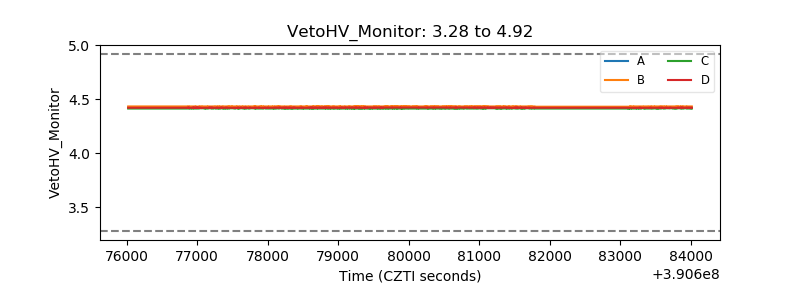 |
| Veto LLD | 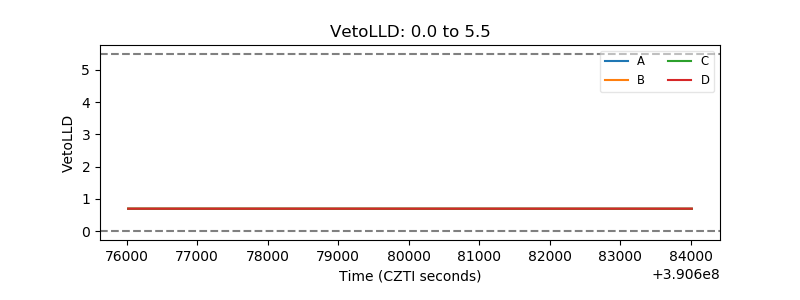 |
| Alpha Counter | 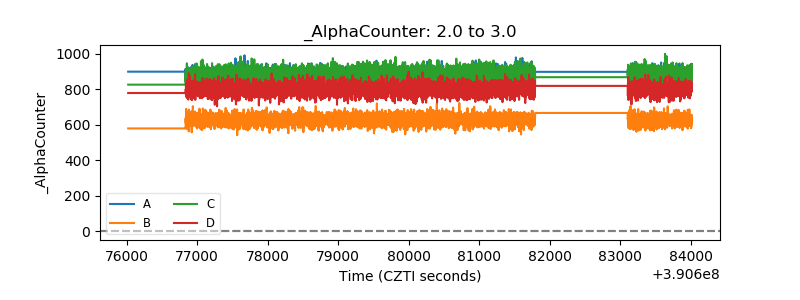 |
| _CPM_Rate | 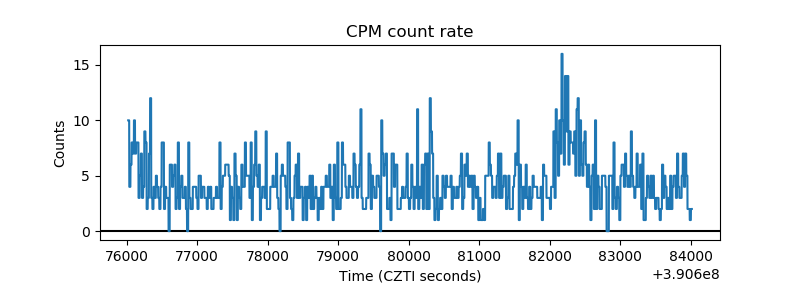 |
| CZT Counter | 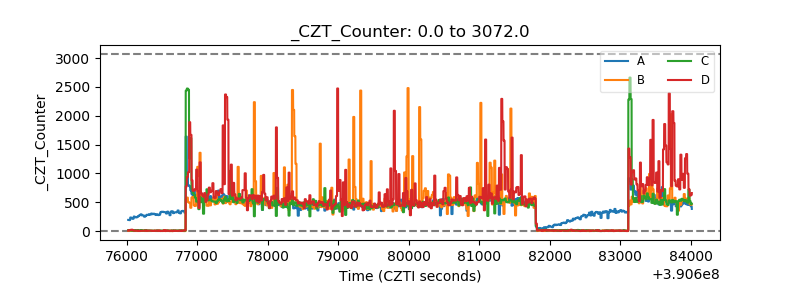 |
| +2.5 Volts monitor | 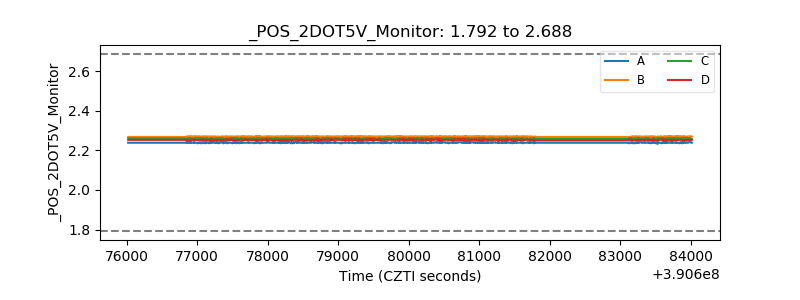 |
| +5 Volts monitor | 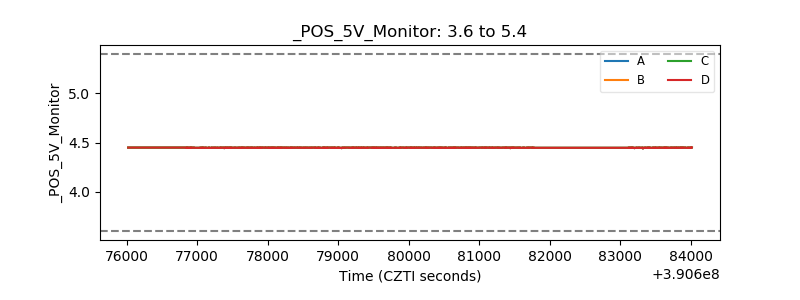 |
| _ROLL_ROT | 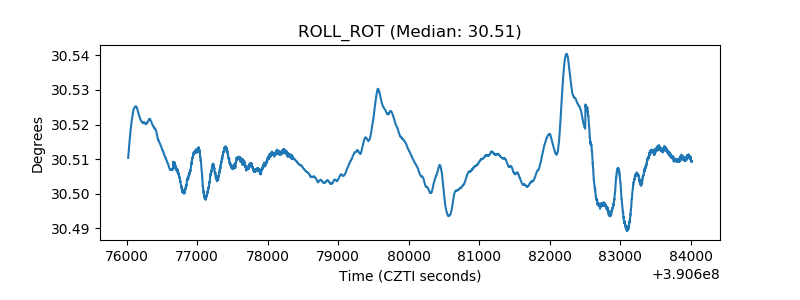 |
| _Roll_DEC | 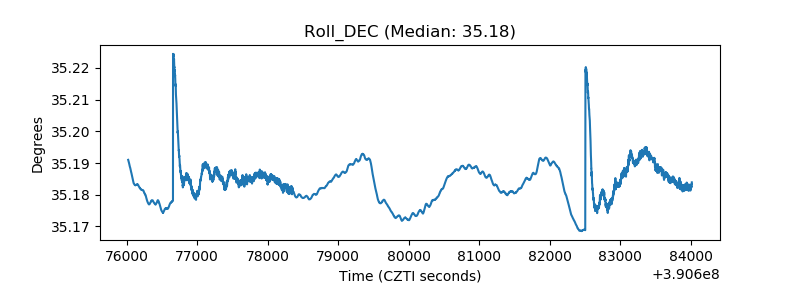 |
| _Roll_RA | 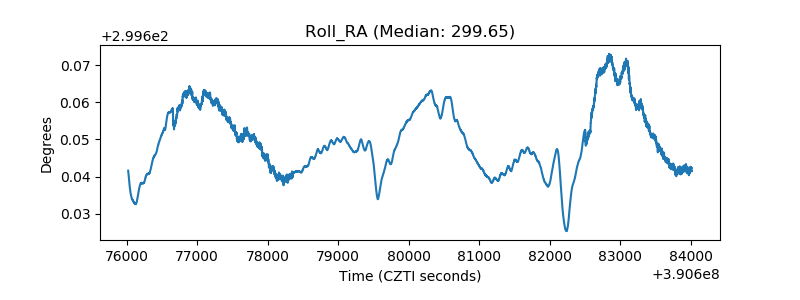 |
| Veto Counter | 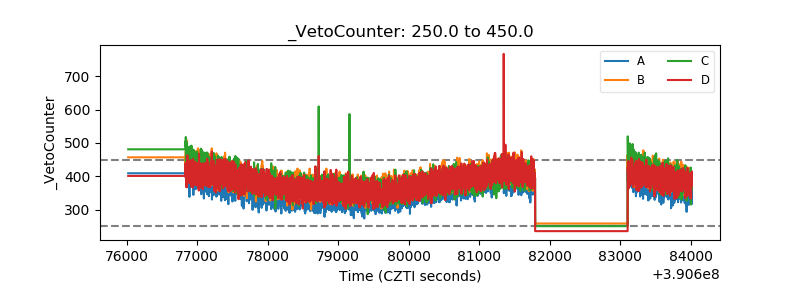 |