| Param | Original file | Final file |
|---|---|---|
| Filename | modeM0/AS1A11_080T01_9000005146_35903cztM0_level2.evt | modeM0/AS1A11_080T01_9000005146_35903cztM0_level2_quad_clean.evt |
| Size (bytes) | 475,810,560 | 100,728,000 |
| Size | 453.8 MB | 96.1 MB |
| Events in quadrant A | 3,240,040 | 674,316 |
| Events in quadrant B | 3,250,999 | 667,455 |
| Events in quadrant C | 3,343,834 | 659,191 |
| Events in quadrant D | 4,165,039 | 627,758 |
| Mode M9 | |||
|---|---|---|---|
| Quadrant | BADHDUFLAG | Total packets | Discarded packets |
| A | 0 | 33 | 0 |
| B | 0 | 33 | 0 |
| C | 0 | 33 | 0 |
| D | 0 | 33 | 0 |
| Mode SS | |||
|---|---|---|---|
| Quadrant | BADHDUFLAG | Total packets | Discarded packets |
| A | 0 | 124 | 0 |
| B | 0 | 124 | 0 |
| C | 0 | 124 | 0 |
| D | 0 | 124 | 0 |
| Mode M0 | |||
|---|---|---|---|
| Quadrant | BADHDUFLAG | Total packets | Discarded packets |
| A | 0 | 13262 | 3 |
| B | 0 | 13253 | 2 |
| C | 0 | 13235 | 2 |
| D | 0 | 16273 | 2 |
| Quadrant | Total seconds | Saturated seconds | Saturation percentage |
|---|---|---|---|
| A | 6044 | 10 | 0.165453% |
| B | 6044 | 69 | 1.141628% |
| C | 6044 | 130 | 2.150893% |
| D | 6044 | 224 | 3.706155% |
Noise dominated data is calculated using 1-second bins in cleaned event files. If a bin has >2000 counts, and if more than 50% of those come from <1% of pixels, then it is considered to be noise-dominated and hence unusable.
| Quadrant | # 1 sec bins | Bins with >0 counts | Bins with >2000 counts | High rate bins dominated by noise | Noise dominated (total time) | Noise dominated (detector-on time) | Marked lightcurve |
|---|---|---|---|---|---|---|---|
| A | 9299 | 6046 | 0 | 0 | 0.00% | 0.00% | 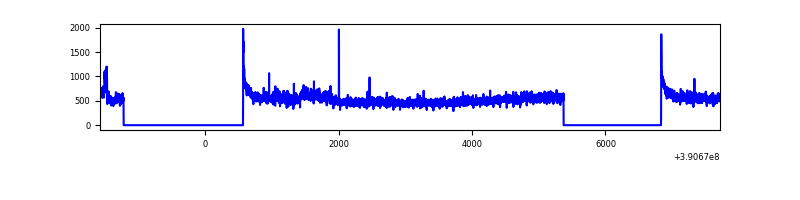 |
| B | 9299 | 6046 | 38 | 38 | 0.41% | 0.63% | 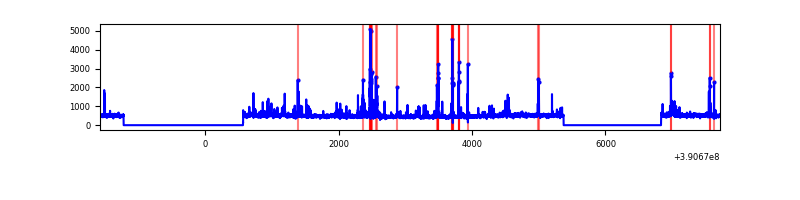 |
| C | 9299 | 6046 | 83 | 83 | 0.89% | 1.37% | 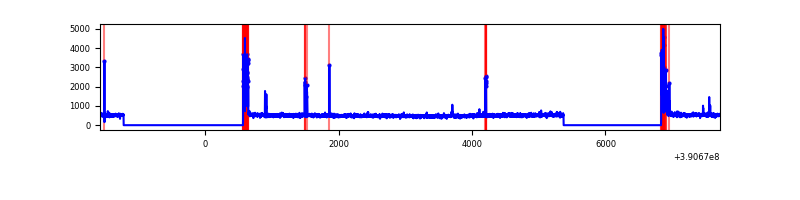 |
| D | 9299 | 6046 | 167 | 167 | 1.80% | 2.76% | 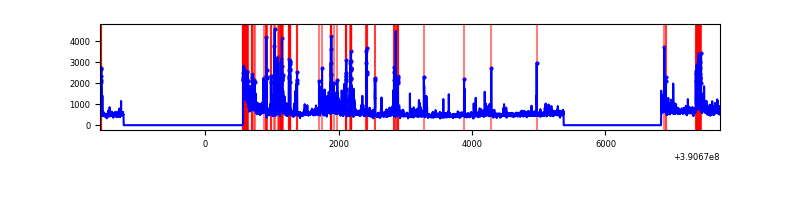 |
Top three noisy pixels from each quadrant. If the there are fewer than three noisy pixels in the level2.evt file, extra rows are filled as -1
| Pixel properties | Quadrant properties | ||||||
|---|---|---|---|---|---|---|---|
| Quadrant | DetID | PixID | Counts | Sigma | Mean | Median | Sigma |
| A | 15 | 169 | 205062 | 1359.64 | 734 | 722 | 150.3 |
| A | 10 | 83 | 178500 | 1182.9 | 734 | 722 | 150.3 |
| A | 13 | 254 | 10302 | 63.74 | 734 | 722 | 150.3 |
| B | 5 | 172 | 175211 | 1262.55 | 723 | 709 | 138.2 |
| B | 5 | 255 | 93297 | 669.89 | 723 | 709 | 138.2 |
| B | 0 | 213 | 59305 | 423.95 | 723 | 709 | 138.2 |
| C | 0 | 10 | 339534 | 2066.44 | 703 | 711 | 164.0 |
| C | 15 | 214 | 251372 | 1528.75 | 703 | 711 | 164.0 |
| C | 9 | 69 | 5581 | 29.7 | 703 | 711 | 164.0 |
| D | 8 | 195 | 336733 | 1941.81 | 701 | 684 | 173.1 |
| D | 13 | 249 | 264823 | 1526.29 | 701 | 684 | 173.1 |
| D | 2 | 250 | 198927 | 1145.52 | 701 | 684 | 173.1 |
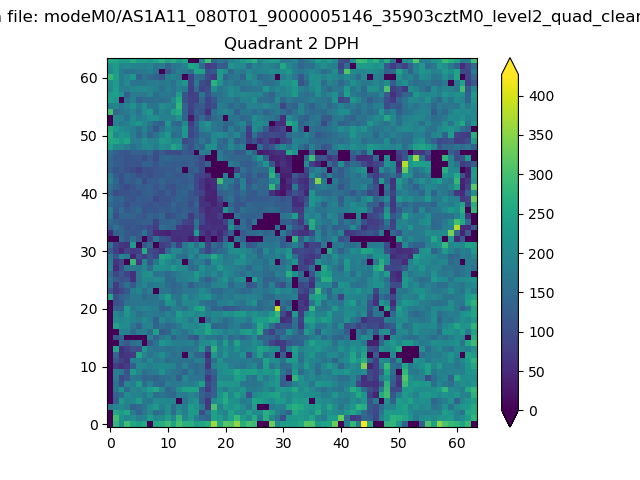
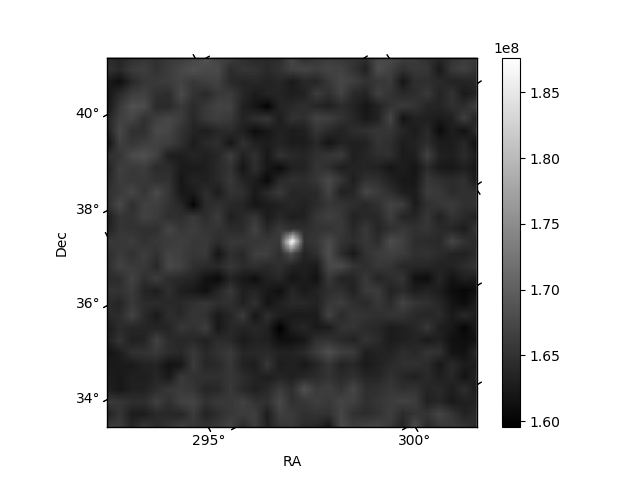
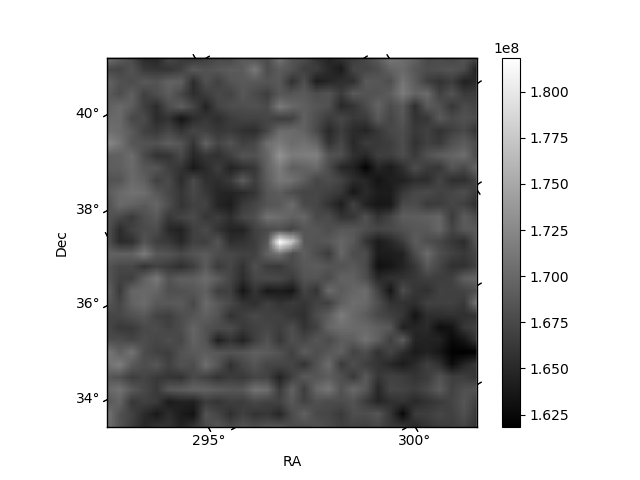
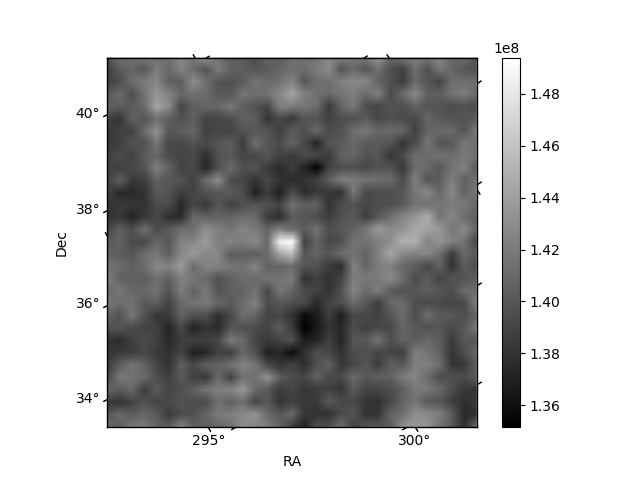
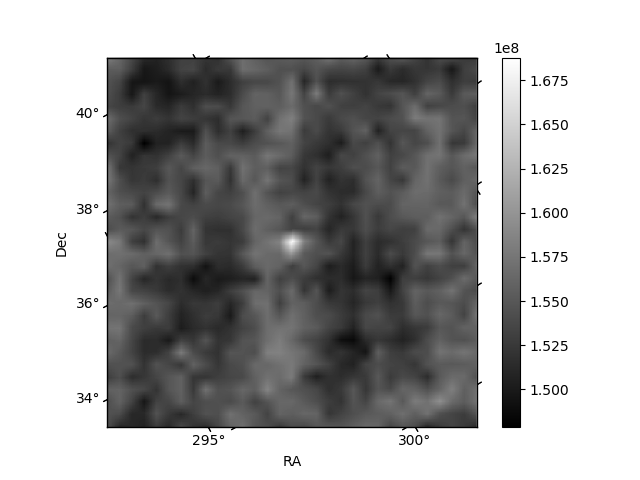
Histogram calculated using DETX and DETY for each event in the final _common_clean file
| Quadrant A | 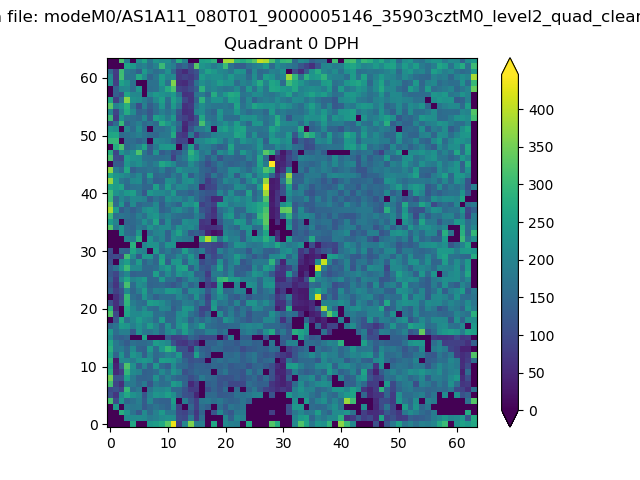 |
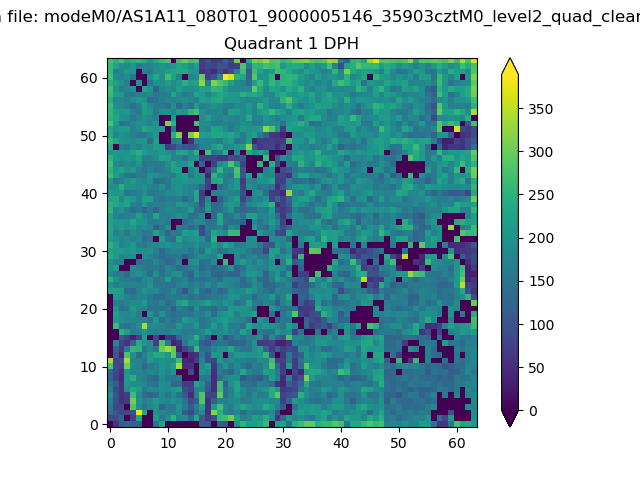 |
Quadrant B |
|---|---|---|---|
| Quadrant D | 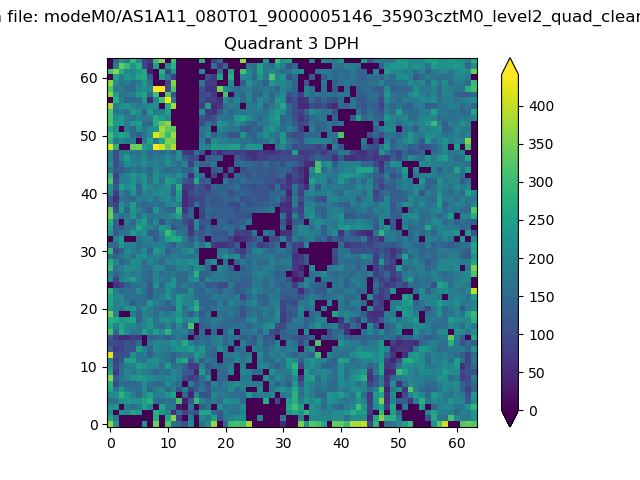 |
 |
Quadrant C |
| Plot type | Count rate plots | Images |
|---|---|---|
| Comparison with Poisson distribution Blue bars denote a histogram of data divided into 1 sec bins. Red curve is a Poisson curve with rate = median count rate of data. |
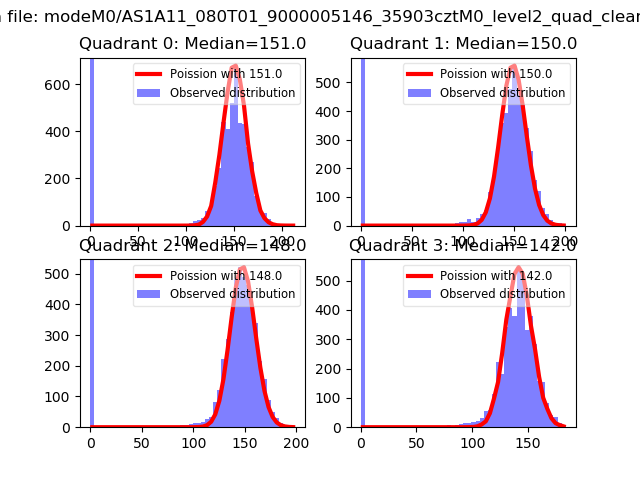 |
 |
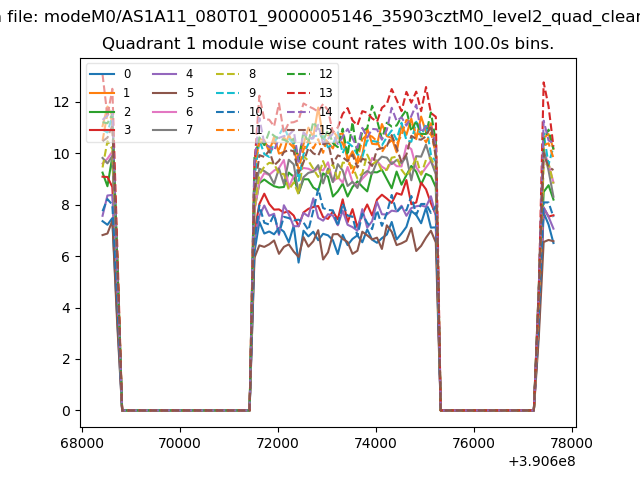
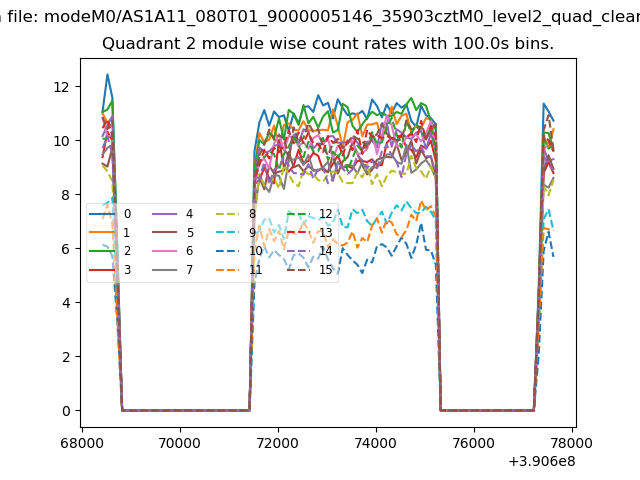
| Quadrant-wise count rates Data is divided into 100 sec bins |
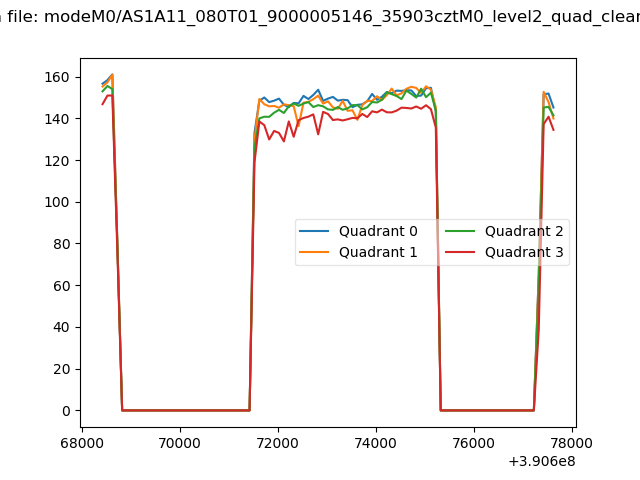 |
|
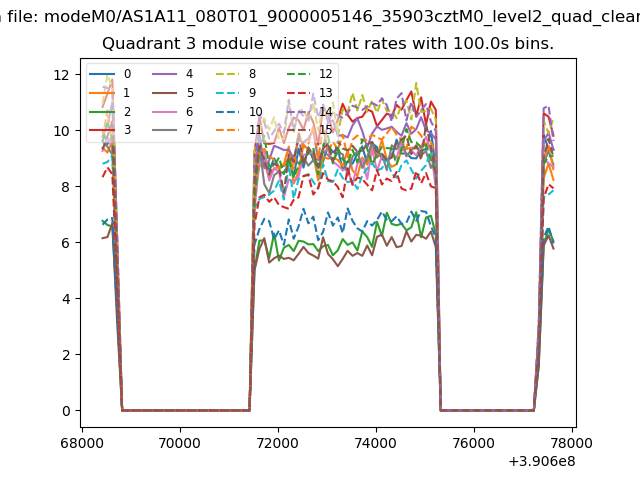
| Module-wise count rates for Quadrant A Data is divided into 100 sec bins |
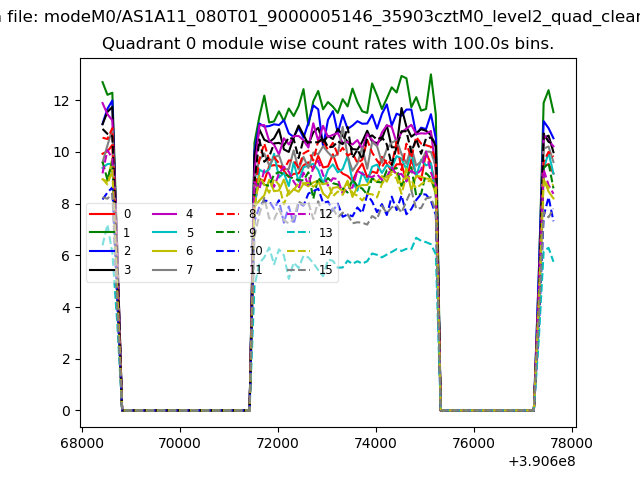 |
 |
| Module-wise count rates for Quadrant B Data is divided into 100 sec bins |
 |
 |
| Module-wise count rates for Quadrant C Data is divided into 100 sec bins |
 |
 |
| Module-wise count rates for Quadrant D Data is divided into 100 sec bins |
 |
 |
| Parameter | Plot |
|---|---|
| CZT HV Monitor | 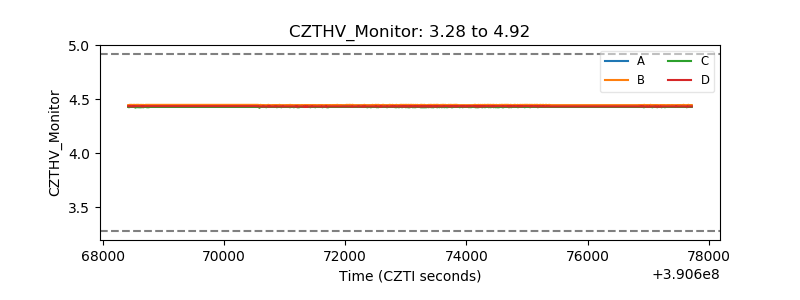 |
| D_VDD | 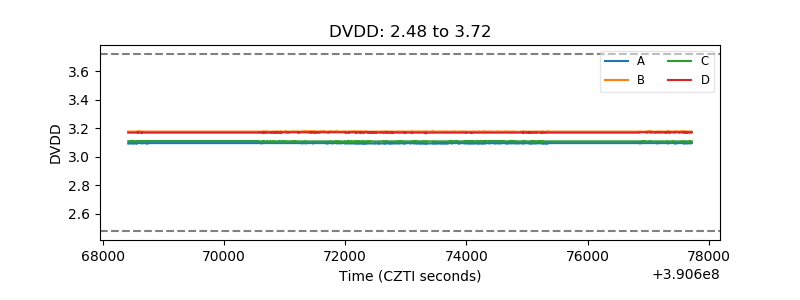 |
| Temperature 1 | 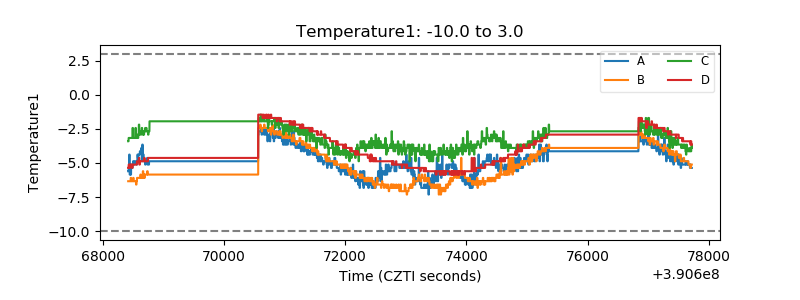 |
| Veto HV Monitor | 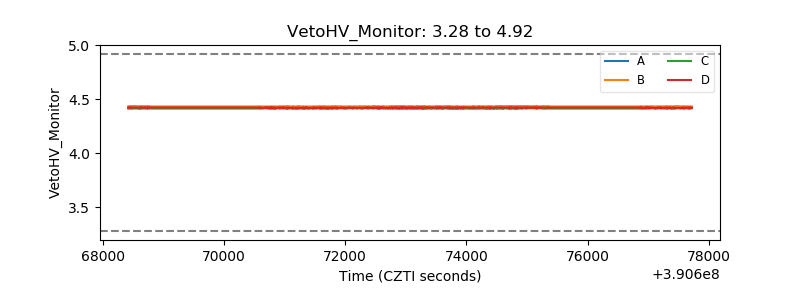 |
| Veto LLD | 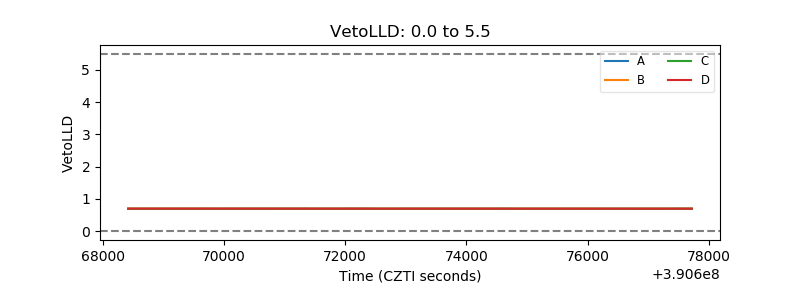 |
| Alpha Counter | 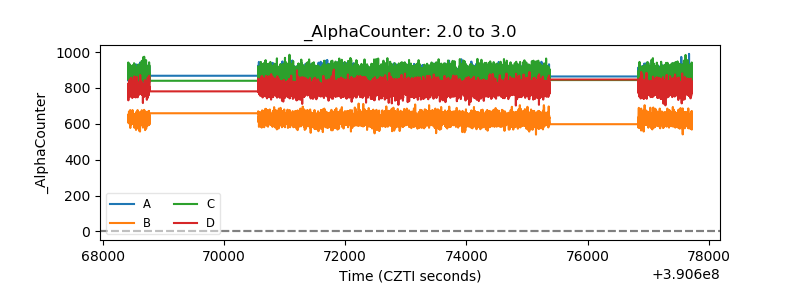 |
| _CPM_Rate | 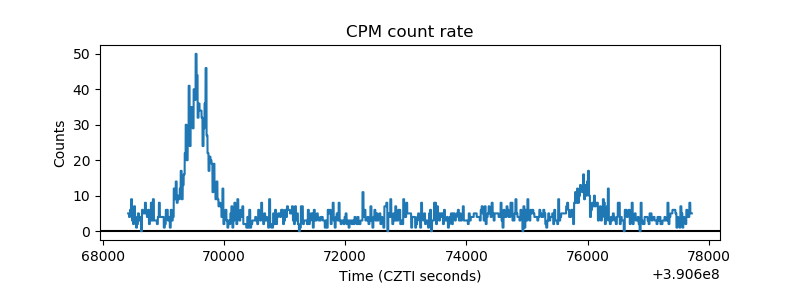 |
| CZT Counter | 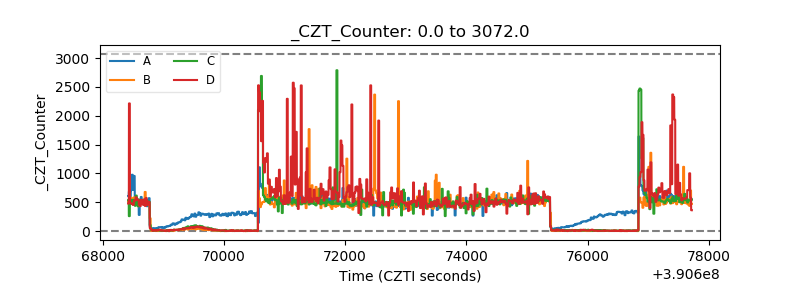 |
| +2.5 Volts monitor | 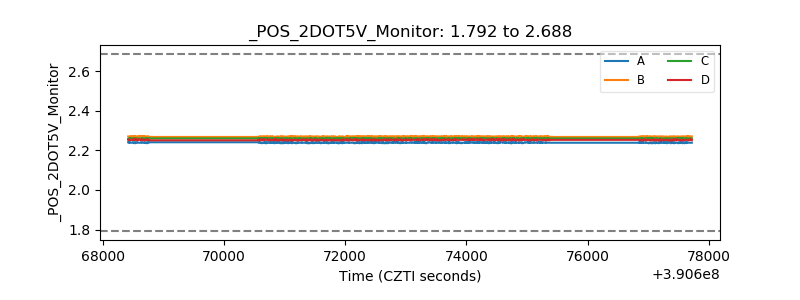 |
| +5 Volts monitor | 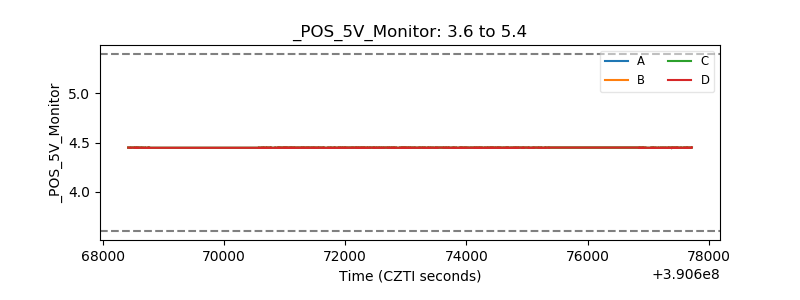 |
| _ROLL_ROT | 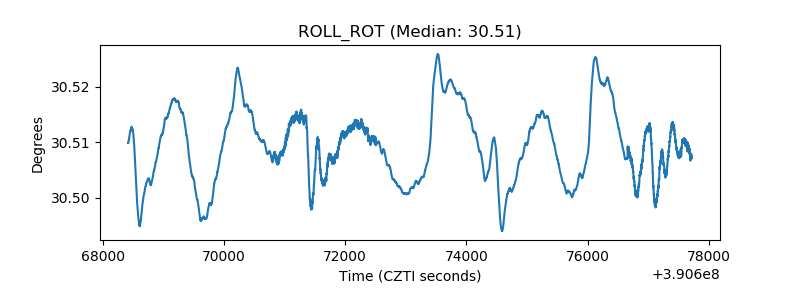 |
| _Roll_DEC | 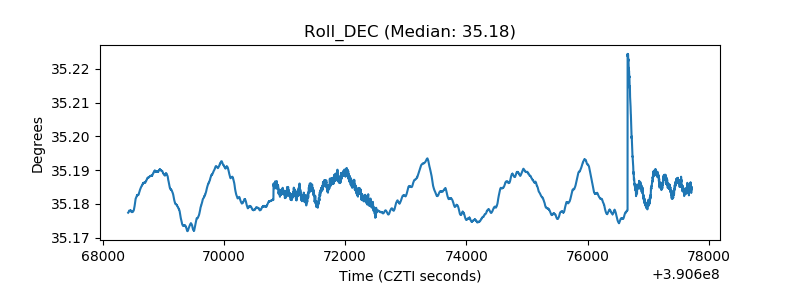 |
| _Roll_RA | 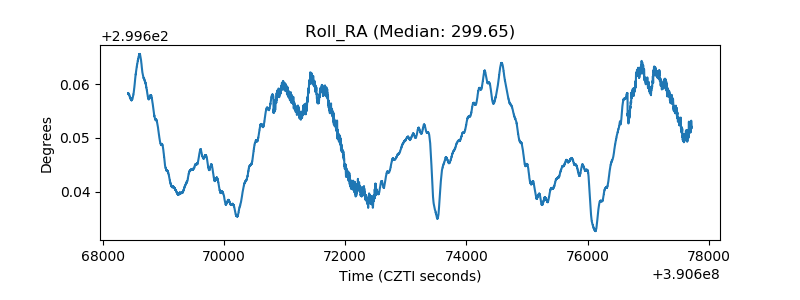 |
| Veto Counter | 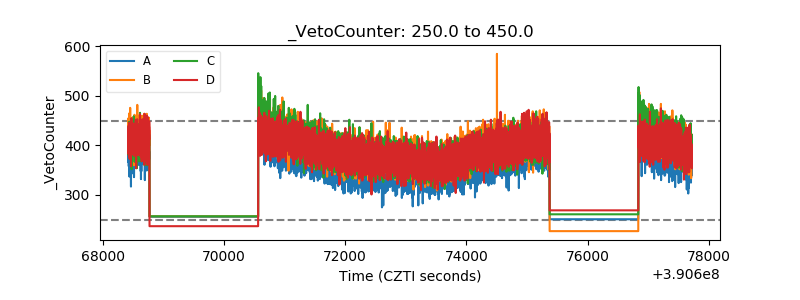 |