| Param | Original file | Final file |
|---|---|---|
| Filename | modeM0/AS1A11_080T01_9000005146_35900cztM0_level2.evt | modeM0/AS1A11_080T01_9000005146_35900cztM0_level2_quad_clean.evt |
| Size (bytes) | 446,906,880 | 56,897,280 |
| Size | 426.2 MB | 54.3 MB |
| Events in quadrant A | 2,858,933 | 361,071 |
| Events in quadrant B | 3,051,094 | 353,436 |
| Events in quadrant C | 2,990,957 | 344,080 |
| Events in quadrant D | 4,290,381 | 309,267 |
| Mode M9 | |||
|---|---|---|---|
| Quadrant | BADHDUFLAG | Total packets | Discarded packets |
| A | 0 | 29 | 0 |
| B | 0 | 29 | 0 |
| C | 0 | 29 | 0 |
| D | 0 | 30 | 0 |
| Mode SS | |||
|---|---|---|---|
| Quadrant | BADHDUFLAG | Total packets | Discarded packets |
| A | 0 | 102 | 0 |
| B | 0 | 102 | 0 |
| C | 0 | 102 | 0 |
| D | 0 | 102 | 0 |
| Mode M0 | |||
|---|---|---|---|
| Quadrant | BADHDUFLAG | Total packets | Discarded packets |
| A | 0 | 11353 | 3 |
| B | 0 | 11963 | 2 |
| C | 0 | 11532 | 2 |
| D | 0 | 16459 | 2 |
| Quadrant | Total seconds | Saturated seconds | Saturation percentage |
|---|---|---|---|
| A | 5062 | 11 | 0.217305% |
| B | 5062 | 92 | 1.817463% |
| C | 5062 | 113 | 2.232319% |
| D | 5062 | 356 | 7.032793% |
Noise dominated data is calculated using 1-second bins in cleaned event files. If a bin has >2000 counts, and if more than 50% of those come from <1% of pixels, then it is considered to be noise-dominated and hence unusable.
| Quadrant | # 1 sec bins | Bins with >0 counts | Bins with >2000 counts | High rate bins dominated by noise | Noise dominated (total time) | Noise dominated (detector-on time) | Marked lightcurve |
|---|---|---|---|---|---|---|---|
| A | 7184 | 5063 | 3 | 3 | 0.04% | 0.06% | 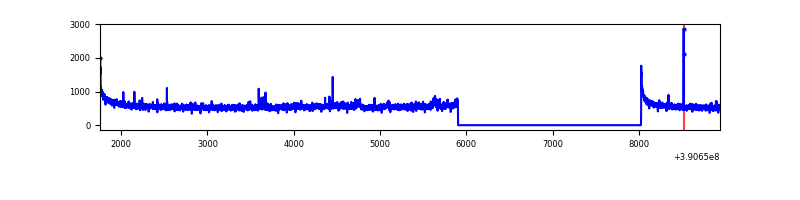 |
| B | 7184 | 5063 | 50 | 50 | 0.70% | 0.99% | 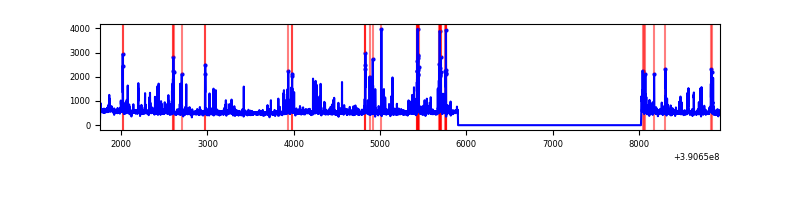 |
| C | 7184 | 5063 | 75 | 75 | 1.04% | 1.48% | 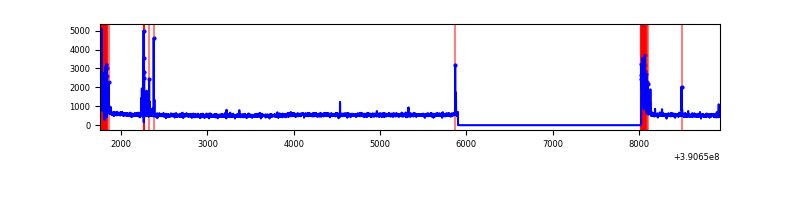 |
| D | 7184 | 5063 | 288 | 288 | 4.01% | 5.69% | 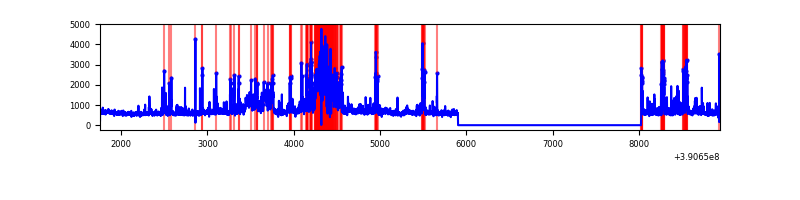 |
Top three noisy pixels from each quadrant. If the there are fewer than three noisy pixels in the level2.evt file, extra rows are filled as -1
| Pixel properties | Quadrant properties | ||||||
|---|---|---|---|---|---|---|---|
| Quadrant | DetID | PixID | Counts | Sigma | Mean | Median | Sigma |
| A | 10 | 83 | 164003 | 1212.7 | 670 | 660 | 134.7 |
| A | 15 | 169 | 82624 | 608.52 | 670 | 660 | 134.7 |
| A | 13 | 6 | 13098 | 92.34 | 670 | 660 | 134.7 |
| B | 5 | 172 | 267154 | 2169.9 | 651 | 638 | 122.8 |
| B | 5 | 255 | 160029 | 1297.72 | 651 | 638 | 122.8 |
| B | 15 | 85 | 29462 | 234.68 | 651 | 638 | 122.8 |
| C | 0 | 10 | 273711 | 1899.13 | 631 | 638 | 143.8 |
| C | 15 | 214 | 213901 | 1483.17 | 631 | 638 | 143.8 |
| C | 9 | 69 | 32314 | 220.3 | 631 | 638 | 143.8 |
| D | 13 | 153 | 902988 | 5918.92 | 623 | 607 | 152.5 |
| D | 8 | 195 | 439594 | 2879.42 | 623 | 607 | 152.5 |
| D | 10 | 118 | 176500 | 1153.72 | 623 | 607 | 152.5 |
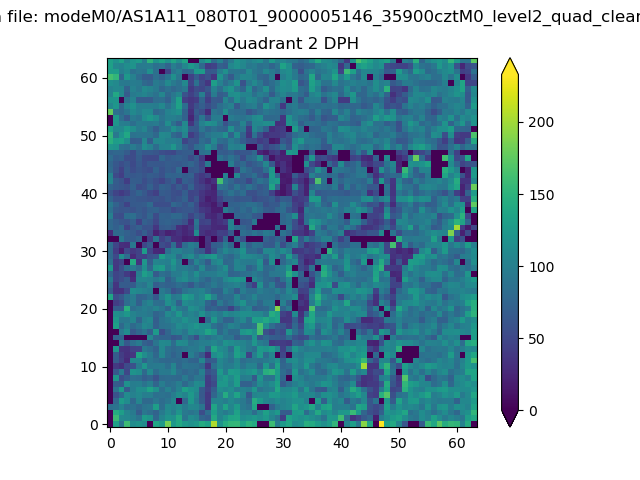
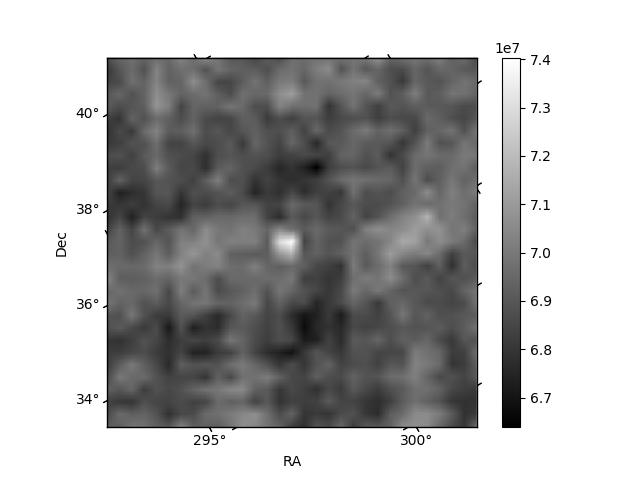
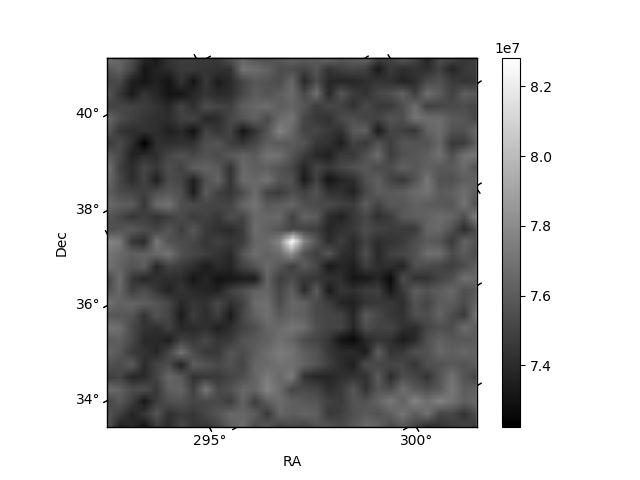
Histogram calculated using DETX and DETY for each event in the final _common_clean file
| Quadrant A | 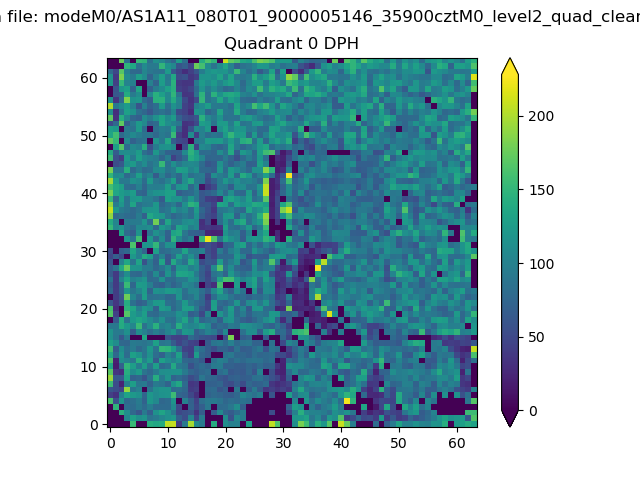 |
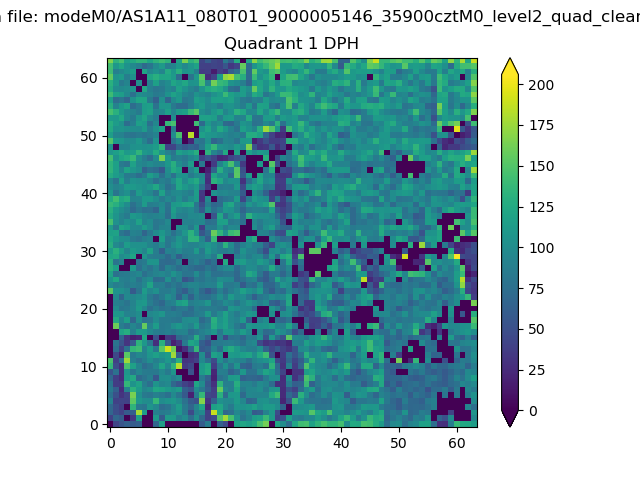 |
Quadrant B |
|---|---|---|---|
| Quadrant D | 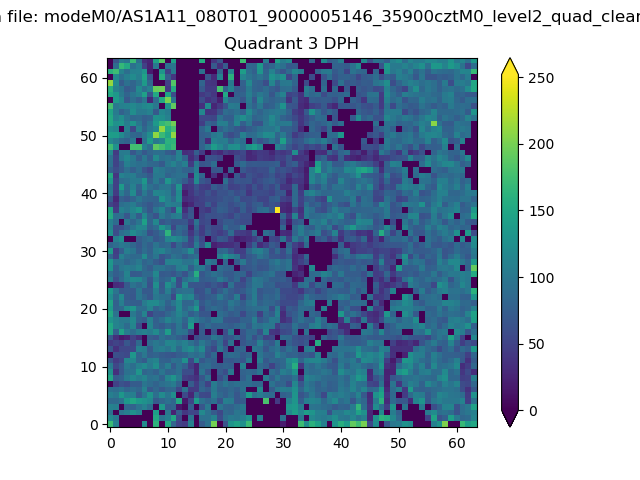 |
 |
Quadrant C |
| Plot type | Count rate plots | Images |
|---|---|---|
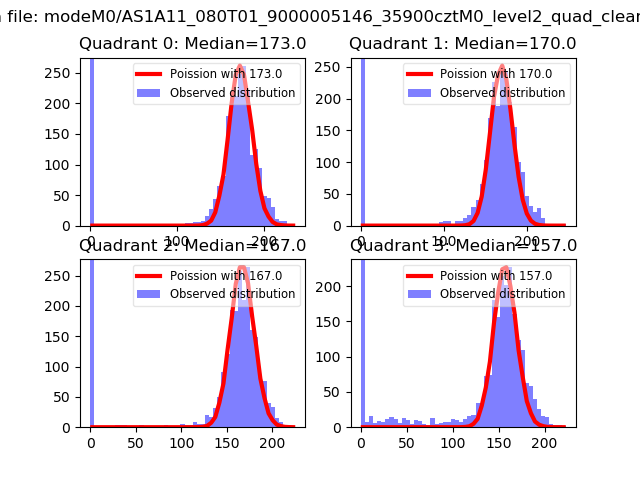
| Comparison with Poisson distribution Blue bars denote a histogram of data divided into 1 sec bins. Red curve is a Poisson curve with rate = median count rate of data. |
 |
 |
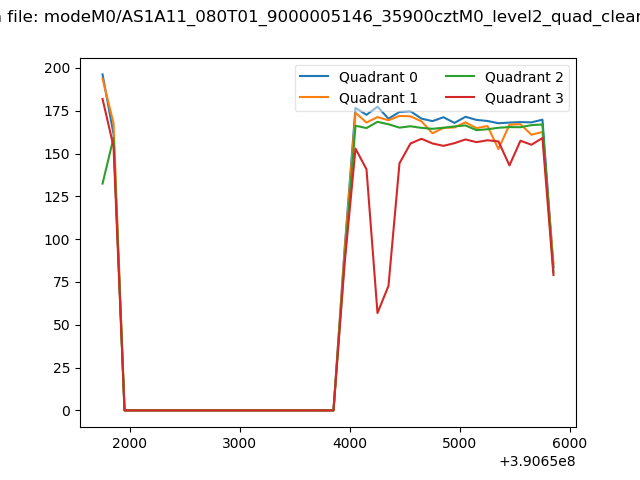
| Quadrant-wise count rates Data is divided into 100 sec bins |
 |
|
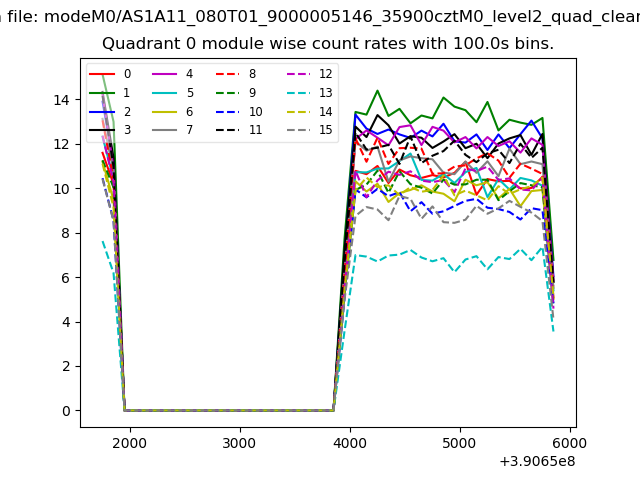
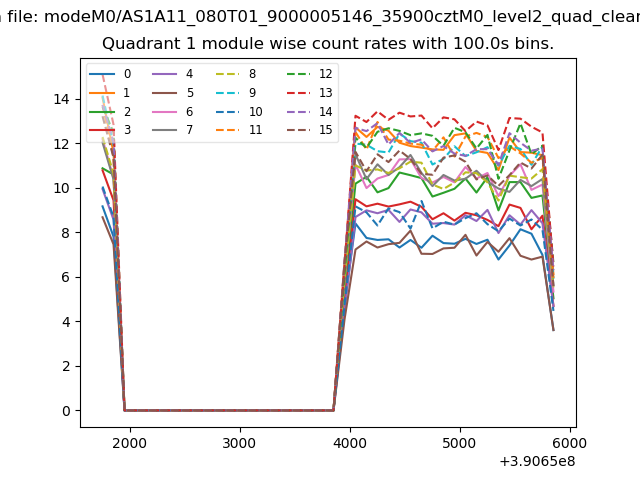
| Module-wise count rates for Quadrant A Data is divided into 100 sec bins |
 |
 |
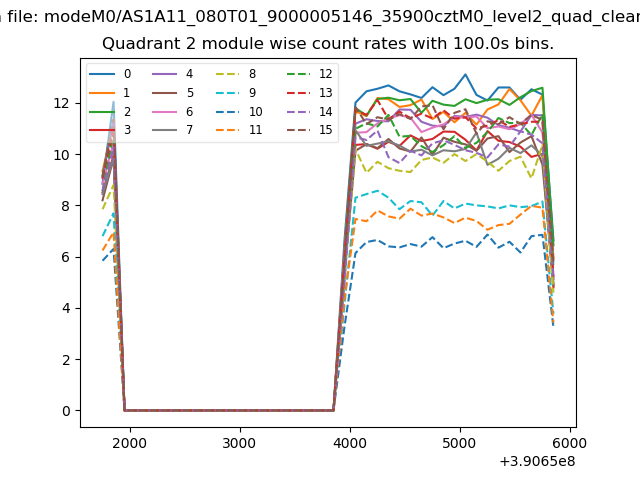
| Module-wise count rates for Quadrant B Data is divided into 100 sec bins |
 |
 |
| Module-wise count rates for Quadrant C Data is divided into 100 sec bins |
 |
 |
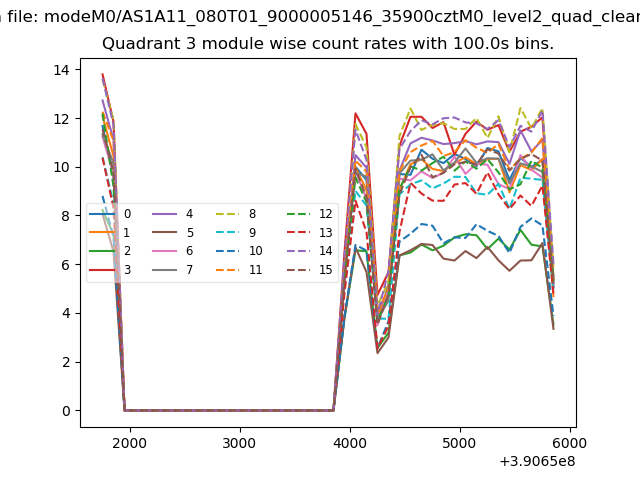
| Module-wise count rates for Quadrant D Data is divided into 100 sec bins |
 |
 |
| Parameter | Plot |
|---|---|
| CZT HV Monitor | 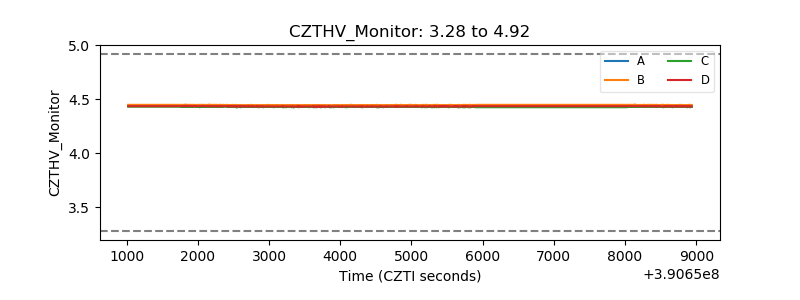 |
| D_VDD | 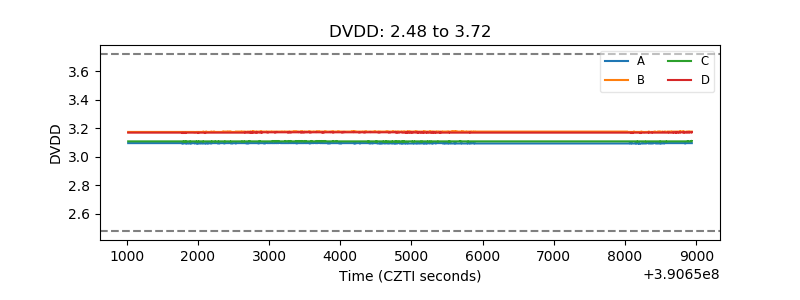 |
| Temperature 1 | 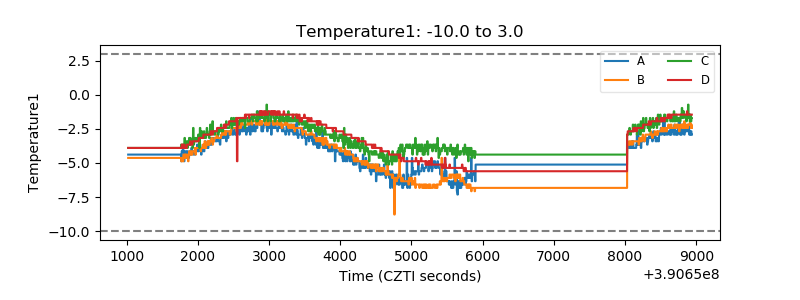 |
| Veto HV Monitor | 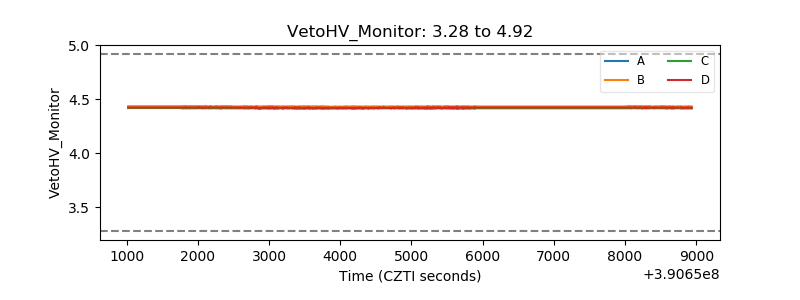 |
| Veto LLD | 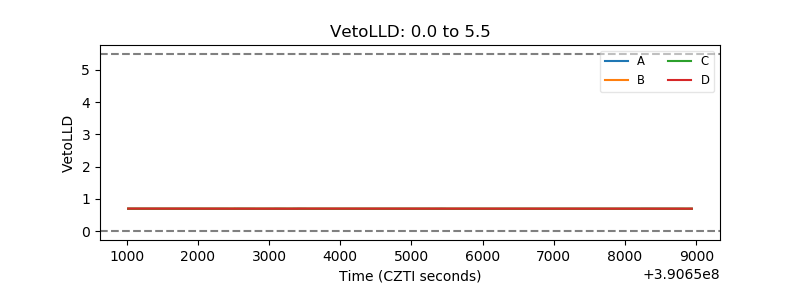 |
| Alpha Counter | 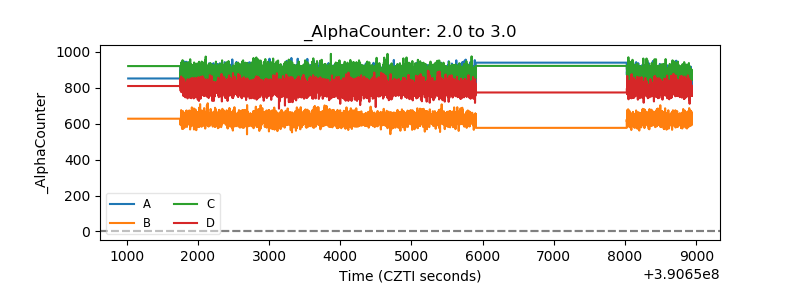 |
| _CPM_Rate | 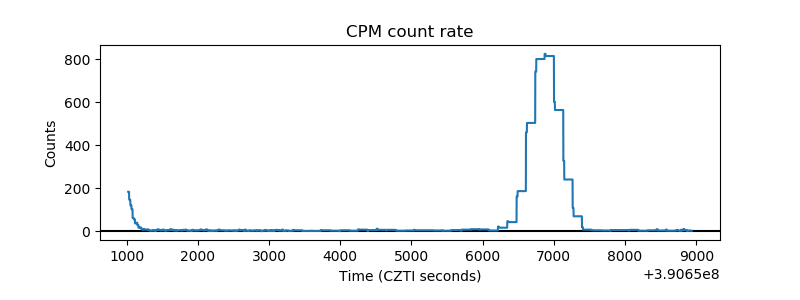 |
| CZT Counter | 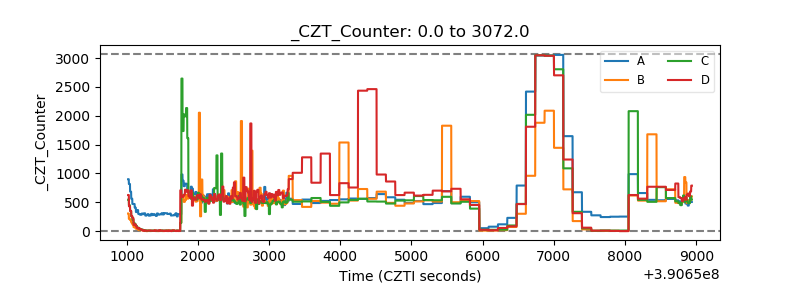 |
| +2.5 Volts monitor | 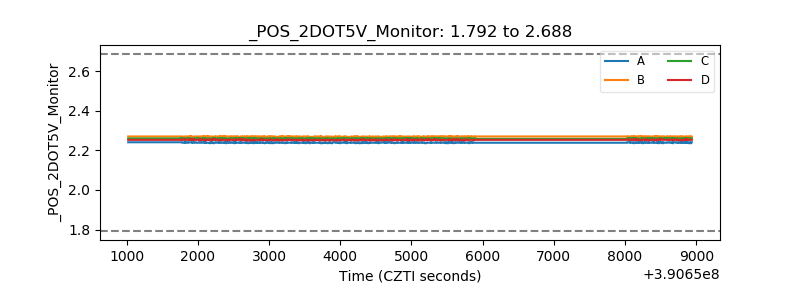 |
| +5 Volts monitor | 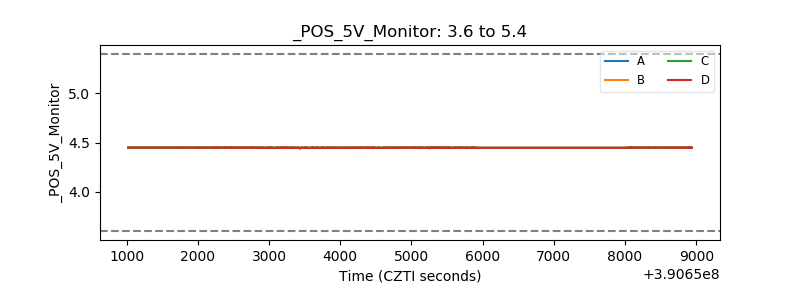 |
| _ROLL_ROT | 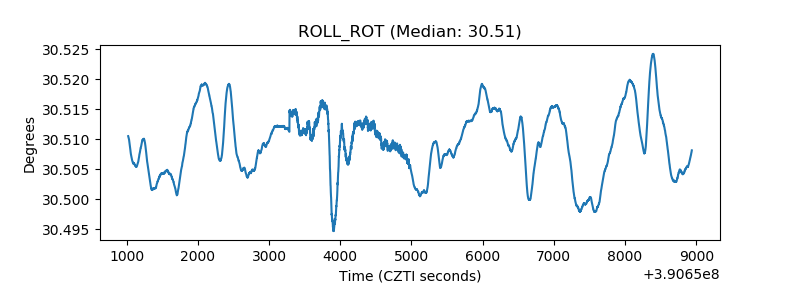 |
| _Roll_DEC | 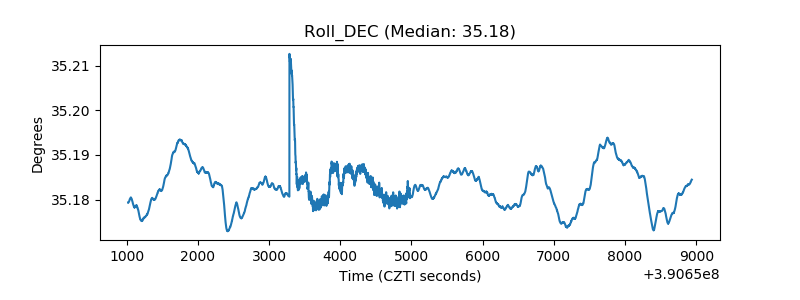 |
| _Roll_RA | 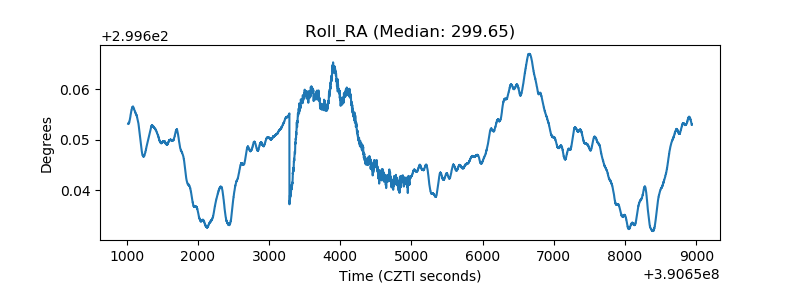 |
| Veto Counter | 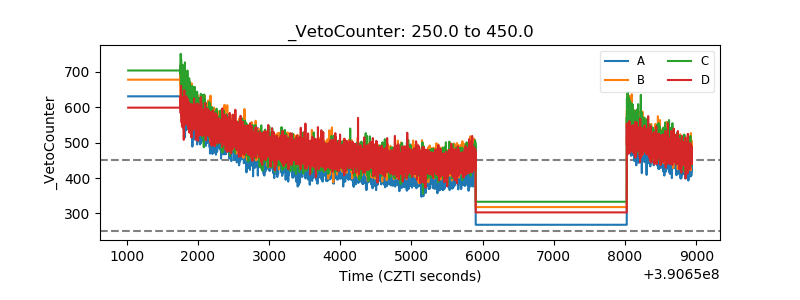 |