| Param | Original file | Final file |
|---|---|---|
| Filename | modeM0/AS1A11_080T01_9000005146_35890cztM0_level2.evt | modeM0/AS1A11_080T01_9000005146_35890cztM0_level2_quad_clean.evt |
| Size (bytes) | 606,824,640 | 99,757,440 |
| Size | 578.7 MB | 95.1 MB |
| Events in quadrant A | 2,979,016 | 689,633 |
| Events in quadrant B | 5,295,923 | 644,920 |
| Events in quadrant C | 3,100,987 | 676,551 |
| Events in quadrant D | 6,601,221 | 595,990 |
| Mode M9 | |||
|---|---|---|---|
| Quadrant | BADHDUFLAG | Total packets | Discarded packets |
| A | 0 | 17 | 0 |
| B | 0 | 17 | 0 |
| C | 0 | 17 | 0 |
| D | 0 | 18 | 0 |
| Mode SS | |||
|---|---|---|---|
| Quadrant | BADHDUFLAG | Total packets | Discarded packets |
| A | 0 | 120 | 0 |
| B | 0 | 120 | 0 |
| C | 0 | 120 | 0 |
| D | 0 | 120 | 0 |
| Mode M0 | |||
|---|---|---|---|
| Quadrant | BADHDUFLAG | Total packets | Discarded packets |
| A | 0 | 12445 | 3 |
| B | 0 | 19670 | 2 |
| C | 0 | 12606 | 2 |
| D | 0 | 23695 | 2 |
| Quadrant | Total seconds | Saturated seconds | Saturation percentage |
|---|---|---|---|
| A | 5918 | 8 | 0.135181% |
| B | 5918 | 884 | 14.937479% |
| C | 5918 | 53 | 0.895573% |
| D | 5918 | 1050 | 17.742481% |
Noise dominated data is calculated using 1-second bins in cleaned event files. If a bin has >2000 counts, and if more than 50% of those come from <1% of pixels, then it is considered to be noise-dominated and hence unusable.
| Quadrant | # 1 sec bins | Bins with >0 counts | Bins with >2000 counts | High rate bins dominated by noise | Noise dominated (total time) | Noise dominated (detector-on time) | Marked lightcurve |
|---|---|---|---|---|---|---|---|
| A | 7200 | 5919 | 0 | 0 | 0.00% | 0.00% | 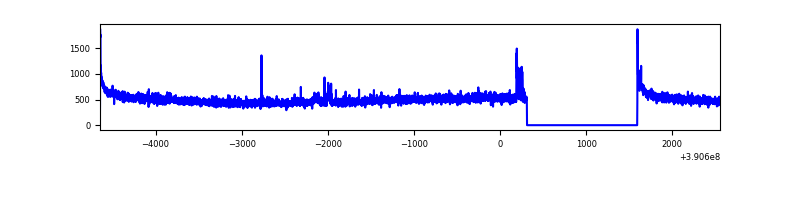 |
| B | 7200 | 5919 | 634 | 634 | 8.81% | 10.71% | 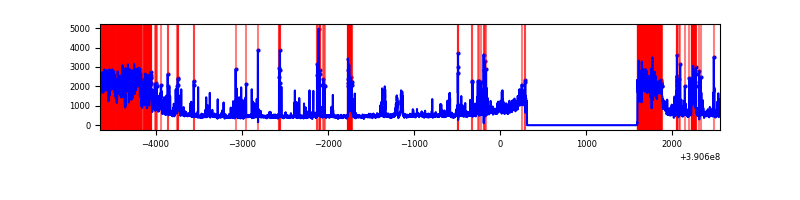 |
| C | 7200 | 5919 | 34 | 34 | 0.47% | 0.57% | 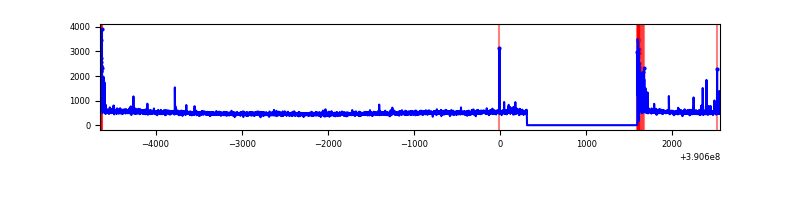 |
| D | 7200 | 5919 | 1027 | 1027 | 14.26% | 17.35% | 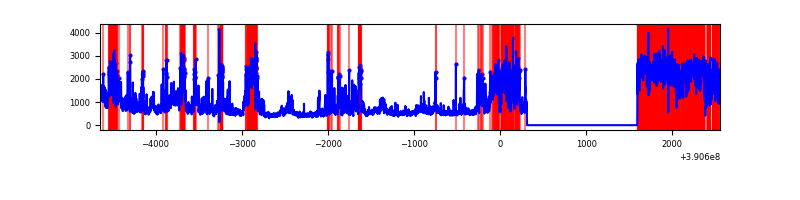 |
Top three noisy pixels from each quadrant. If the there are fewer than three noisy pixels in the level2.evt file, extra rows are filled as -1
| Pixel properties | Quadrant properties | ||||||
|---|---|---|---|---|---|---|---|
| Quadrant | DetID | PixID | Counts | Sigma | Mean | Median | Sigma |
| A | 10 | 83 | 169582 | 1168.65 | 708 | 697 | 144.5 |
| A | 15 | 169 | 31601 | 213.85 | 708 | 697 | 144.5 |
| A | 7 | 3 | 23058 | 154.73 | 708 | 697 | 144.5 |
| B | 5 | 63 | 1822435 | 14050.85 | 667 | 652 | 129.7 |
| B | 5 | 172 | 440479 | 3392.25 | 667 | 652 | 129.7 |
| B | 5 | 255 | 229054 | 1761.59 | 667 | 652 | 129.7 |
| C | 15 | 214 | 250386 | 1553.77 | 686 | 692 | 160.7 |
| C | 0 | 10 | 132138 | 817.95 | 686 | 692 | 160.7 |
| C | 0 | 207 | 46302 | 283.82 | 686 | 692 | 160.7 |
| D | 12 | 227 | 2966759 | 18574.81 | 650 | 634 | 159.7 |
| D | 1 | 52 | 501855 | 3138.8 | 650 | 634 | 159.7 |
| D | 8 | 195 | 206958 | 1292.07 | 650 | 634 | 159.7 |
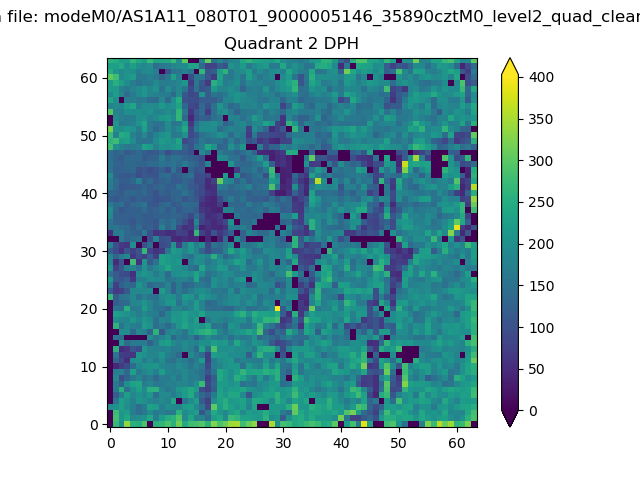
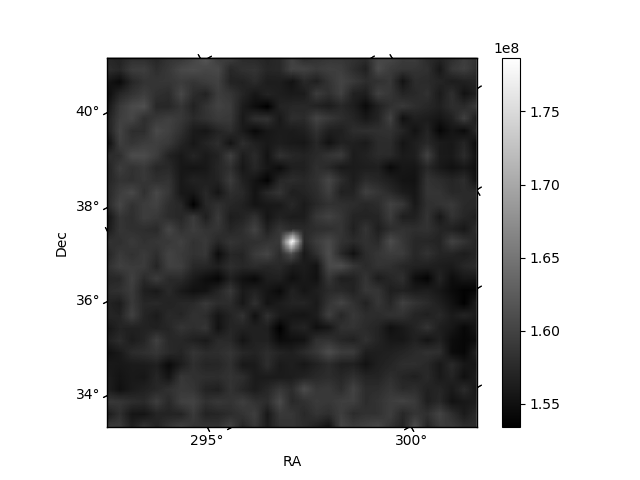
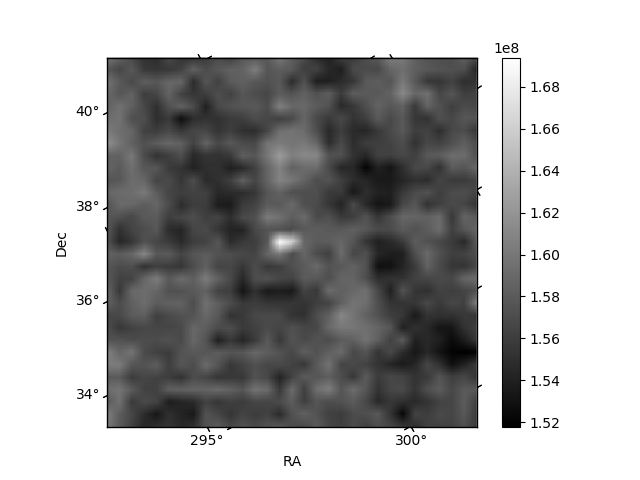
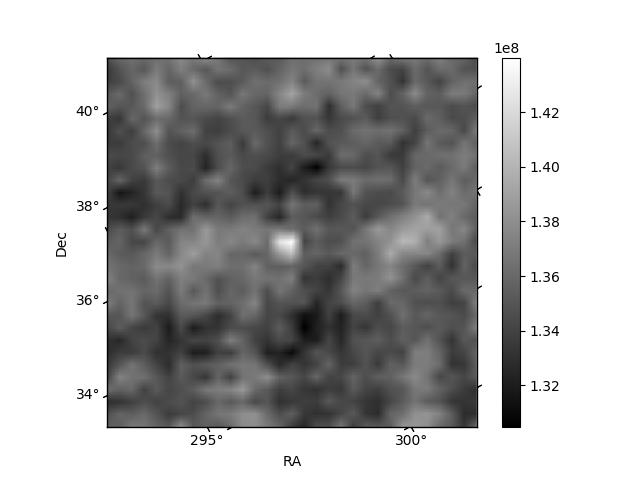
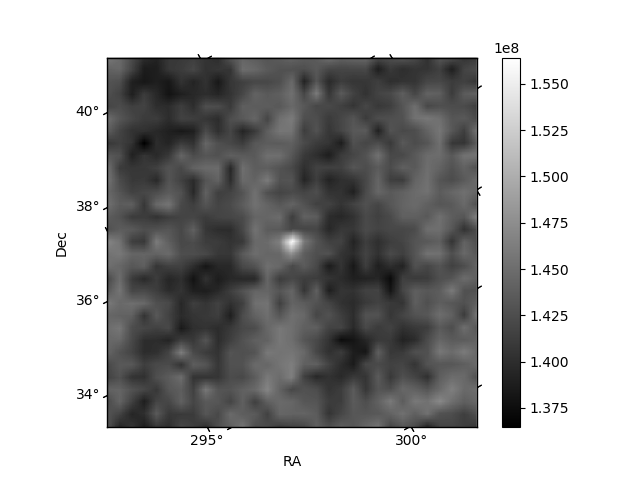
Histogram calculated using DETX and DETY for each event in the final _common_clean file
| Quadrant A | 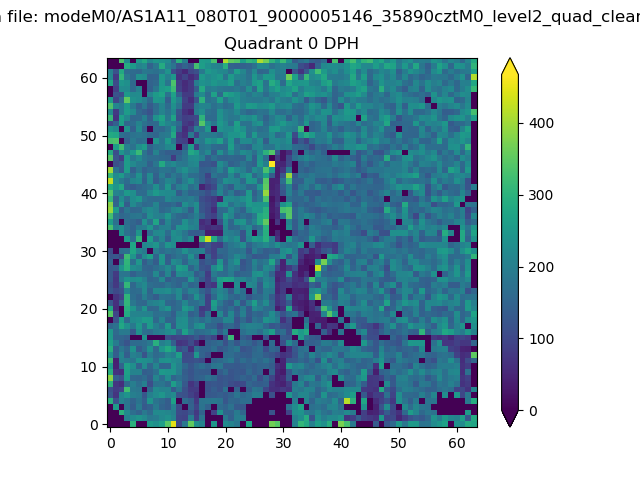 |
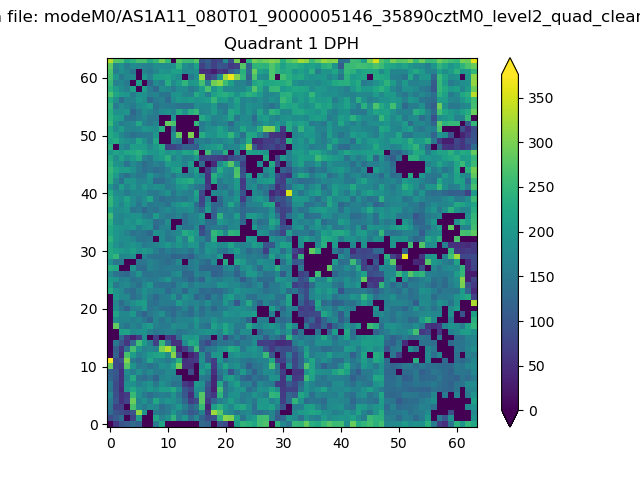 |
Quadrant B |
|---|---|---|---|
| Quadrant D | 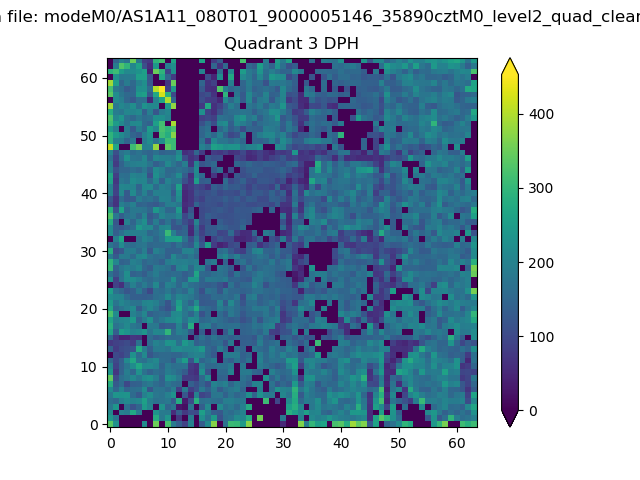 |
 |
Quadrant C |
| Plot type | Count rate plots | Images |
|---|---|---|
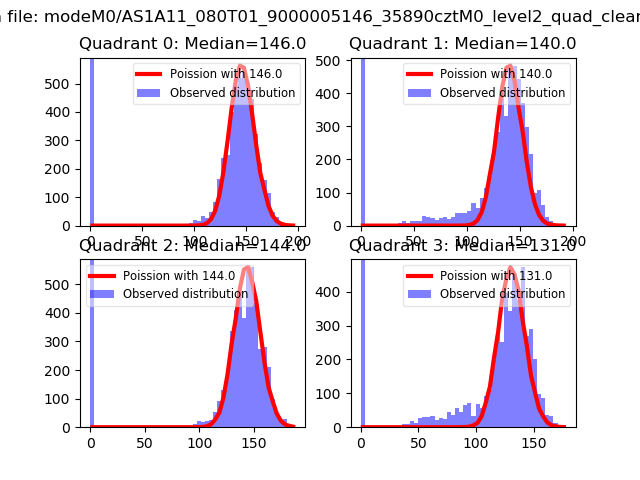
| Comparison with Poisson distribution Blue bars denote a histogram of data divided into 1 sec bins. Red curve is a Poisson curve with rate = median count rate of data. |
 |
 |
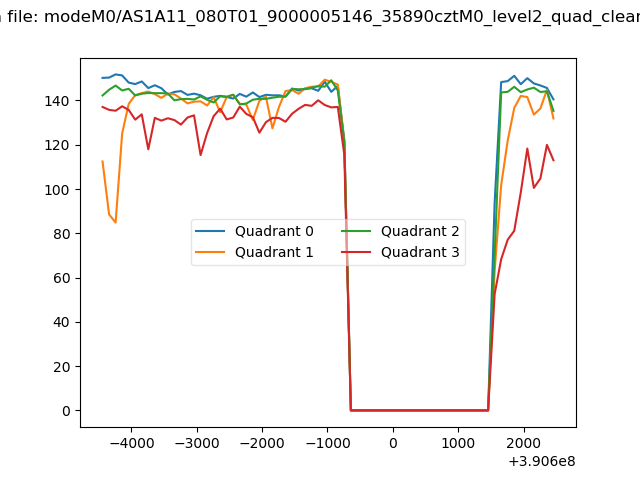
| Quadrant-wise count rates Data is divided into 100 sec bins |
 |
|
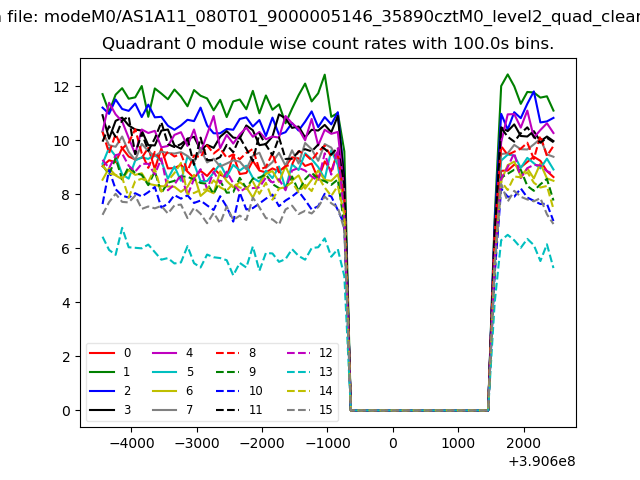
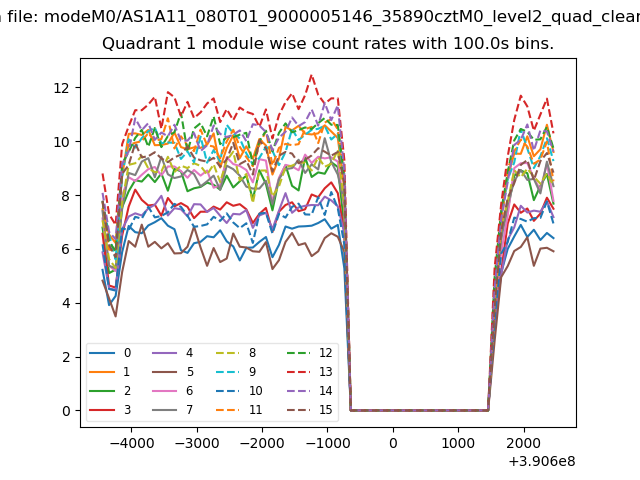
| Module-wise count rates for Quadrant A Data is divided into 100 sec bins |
 |
 |
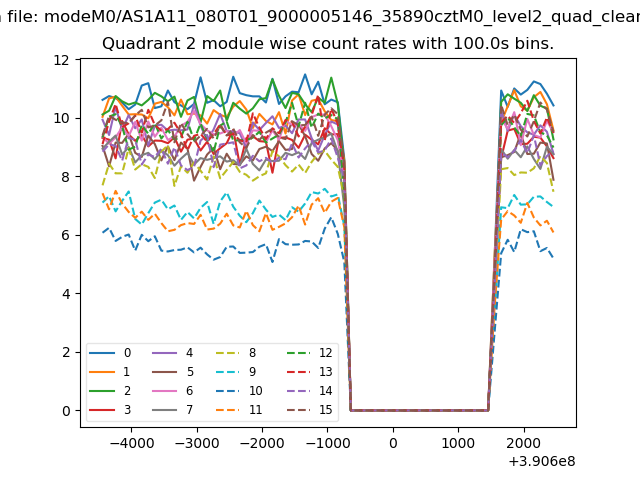
| Module-wise count rates for Quadrant B Data is divided into 100 sec bins |
 |
 |
| Module-wise count rates for Quadrant C Data is divided into 100 sec bins |
 |
 |
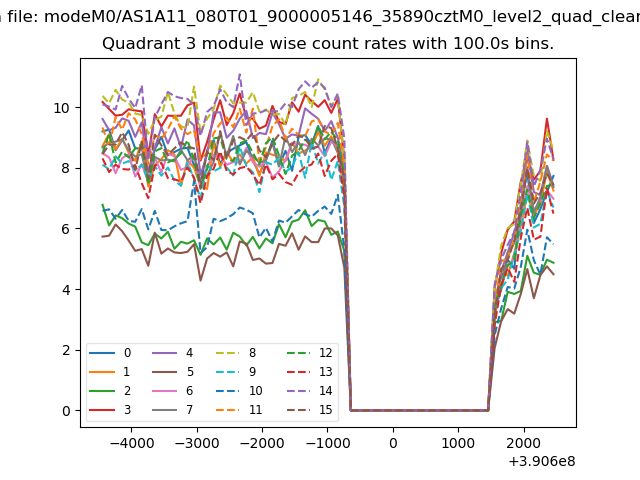
| Module-wise count rates for Quadrant D Data is divided into 100 sec bins |
 |
 |
| Parameter | Plot |
|---|---|
| CZT HV Monitor | 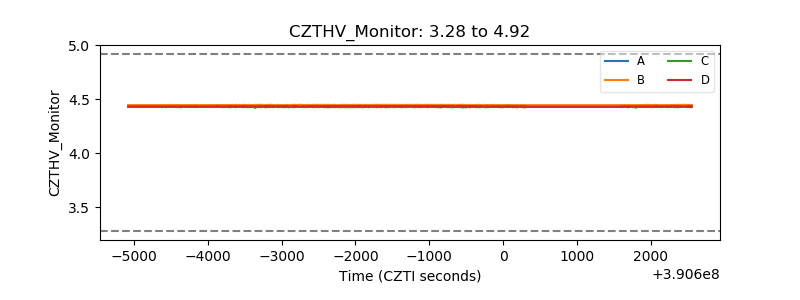 |
| D_VDD | 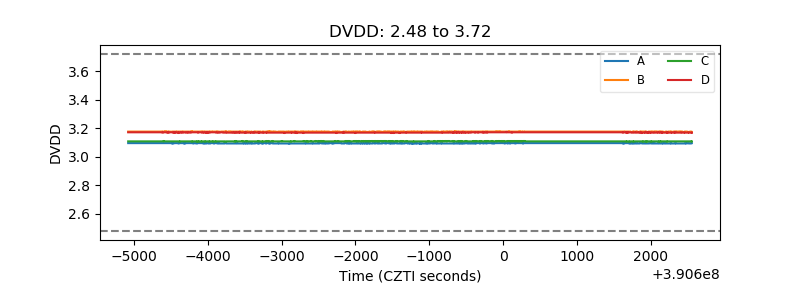 |
| Temperature 1 | 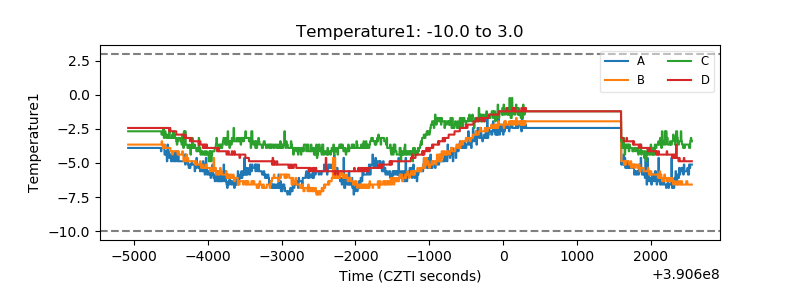 |
| Veto HV Monitor | 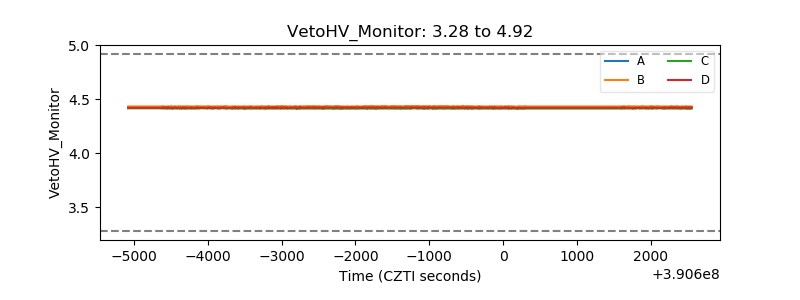 |
| Veto LLD | 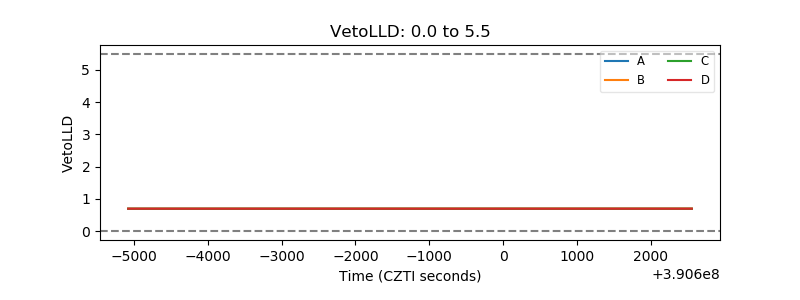 |
| Alpha Counter | 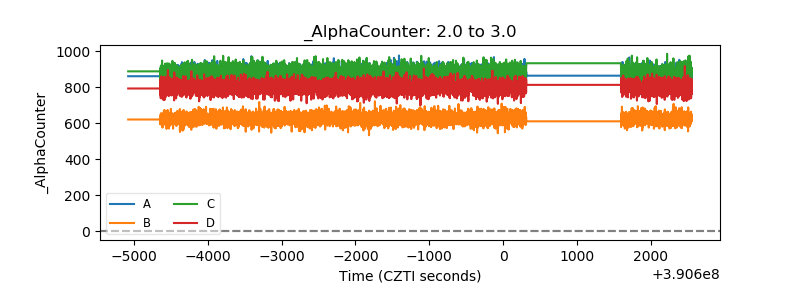 |
| _CPM_Rate | 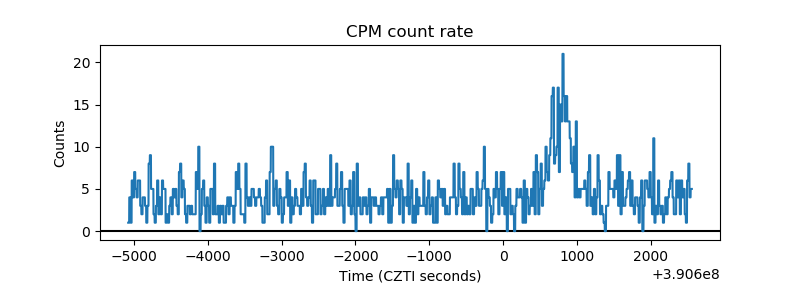 |
| CZT Counter | 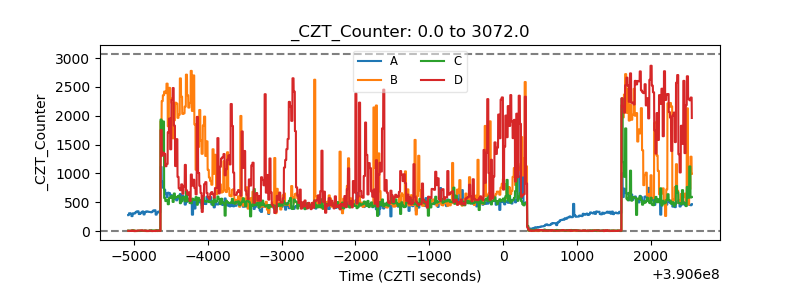 |
| +2.5 Volts monitor | 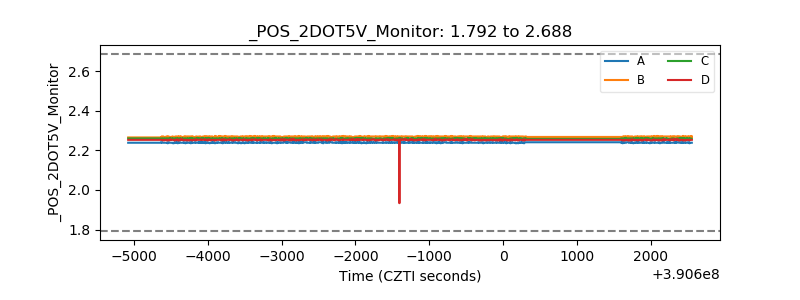 |
| +5 Volts monitor |  |
| _ROLL_ROT | 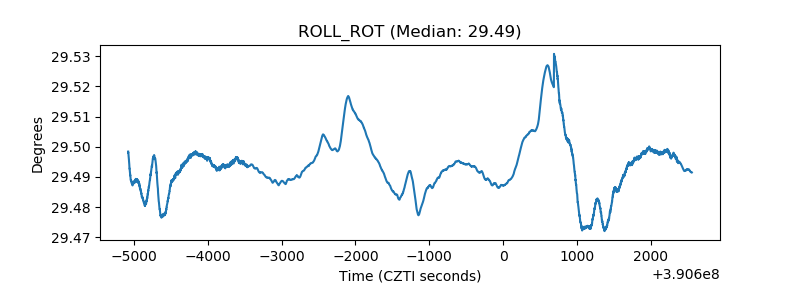 |
| _Roll_DEC | 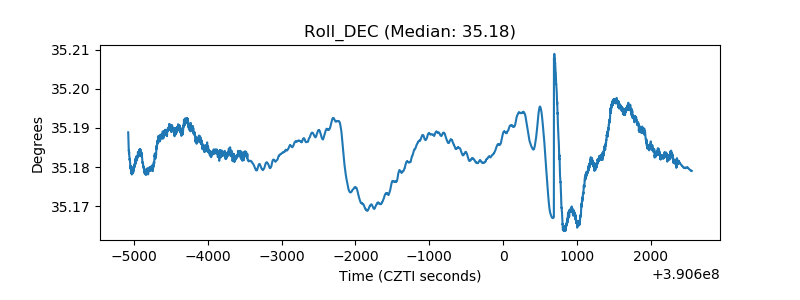 |
| _Roll_RA | 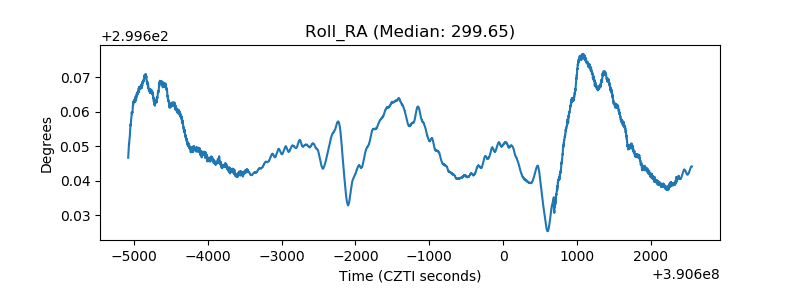 |
| Veto Counter | 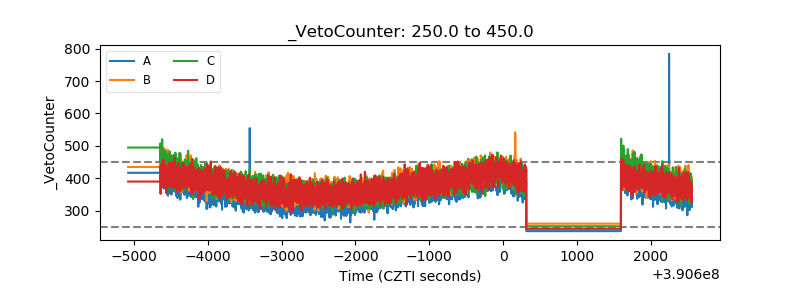 |