| Param | Original file | Final file |
|---|---|---|
| Filename | modeM0/AS1A11_080T01_9000005146_35887cztM0_level2.evt | modeM0/AS1A11_080T01_9000005146_35887cztM0_level2_quad_clean.evt |
| Size (bytes) | 568,506,240 | 67,207,680 |
| Size | 542.2 MB | 64.1 MB |
| Events in quadrant A | 2,677,553 | 444,010 |
| Events in quadrant B | 6,718,460 | 388,290 |
| Events in quadrant C | 3,023,543 | 429,664 |
| Events in quadrant D | 4,447,677 | 410,452 |
| Mode M9 | |||
|---|---|---|---|
| Quadrant | BADHDUFLAG | Total packets | Discarded packets |
| A | 0 | 31 | 0 |
| B | 0 | 31 | 0 |
| C | 0 | 31 | 0 |
| D | 0 | 32 | 0 |
| Mode SS | |||
|---|---|---|---|
| Quadrant | BADHDUFLAG | Total packets | Discarded packets |
| A | 0 | 106 | 0 |
| B | 0 | 106 | 0 |
| C | 0 | 106 | 0 |
| D | 0 | 106 | 0 |
| Mode M0 | |||
|---|---|---|---|
| Quadrant | BADHDUFLAG | Total packets | Discarded packets |
| A | 0 | 10864 | 3 |
| B | 0 | 23333 | 2 |
| C | 0 | 11850 | 2 |
| D | 0 | 16818 | 2 |
| Quadrant | Total seconds | Saturated seconds | Saturation percentage |
|---|---|---|---|
| A | 5167 | 10 | 0.193536% |
| B | 5167 | 1717 | 33.230114% |
| C | 5167 | 72 | 1.393458% |
| D | 5167 | 292 | 5.651248% |
Noise dominated data is calculated using 1-second bins in cleaned event files. If a bin has >2000 counts, and if more than 50% of those come from <1% of pixels, then it is considered to be noise-dominated and hence unusable.
| Quadrant | # 1 sec bins | Bins with >0 counts | Bins with >2000 counts | High rate bins dominated by noise | Noise dominated (total time) | Noise dominated (detector-on time) | Marked lightcurve |
|---|---|---|---|---|---|---|---|
| A | 7141 | 5168 | 1 | 1 | 0.01% | 0.02% | 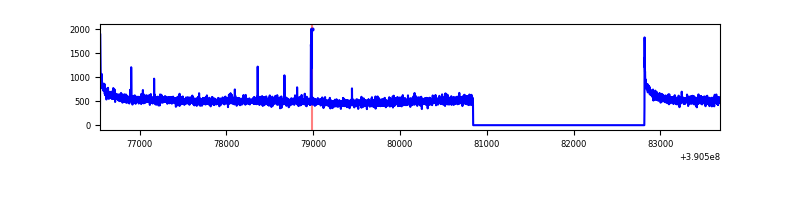 |
| B | 7141 | 5168 | 1570 | 1570 | 21.99% | 30.38% | 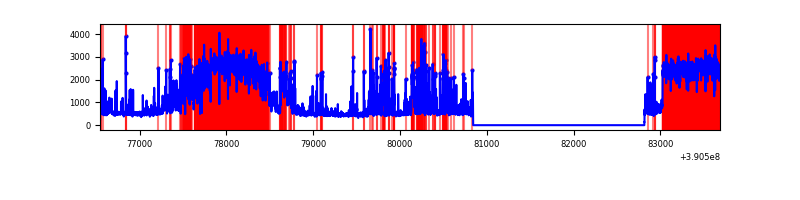 |
| C | 7141 | 5168 | 60 | 60 | 0.84% | 1.16% | 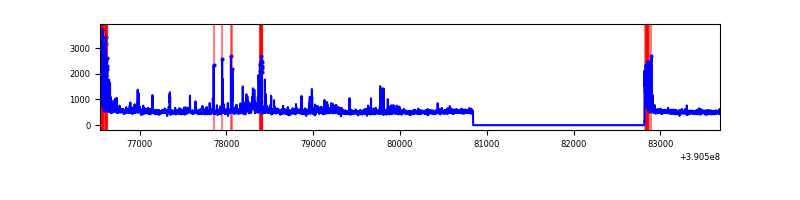 |
| D | 7141 | 5168 | 255 | 255 | 3.57% | 4.93% | 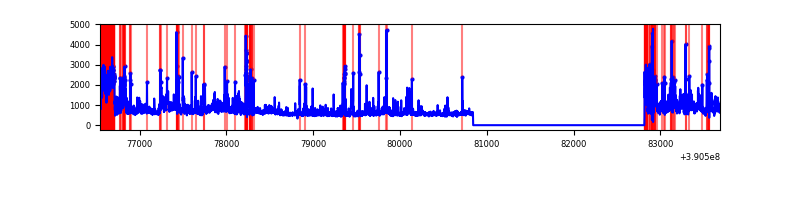 |
Top three noisy pixels from each quadrant. If the there are fewer than three noisy pixels in the level2.evt file, extra rows are filled as -1
| Pixel properties | Quadrant properties | ||||||
|---|---|---|---|---|---|---|---|
| Quadrant | DetID | PixID | Counts | Sigma | Mean | Median | Sigma |
| A | 10 | 83 | 163508 | 1256.77 | 641 | 631 | 129.6 |
| A | 15 | 233 | 14393 | 106.19 | 641 | 631 | 129.6 |
| A | 13 | 6 | 12528 | 91.8 | 641 | 631 | 129.6 |
| B | 5 | 63 | 3783178 | 37310.41 | 531 | 520 | 101.4 |
| B | 5 | 172 | 639598 | 6303.57 | 531 | 520 | 101.4 |
| B | 5 | 255 | 167359 | 1645.62 | 531 | 520 | 101.4 |
| C | 15 | 214 | 216100 | 1513.85 | 615 | 622 | 142.3 |
| C | 0 | 10 | 210369 | 1473.59 | 615 | 622 | 142.3 |
| C | 1 | 23 | 103886 | 725.49 | 615 | 622 | 142.3 |
| D | 12 | 227 | 715160 | 4788.07 | 608 | 593 | 149.2 |
| D | 8 | 195 | 387593 | 2593.15 | 608 | 593 | 149.2 |
| D | 13 | 249 | 346771 | 2319.62 | 608 | 593 | 149.2 |
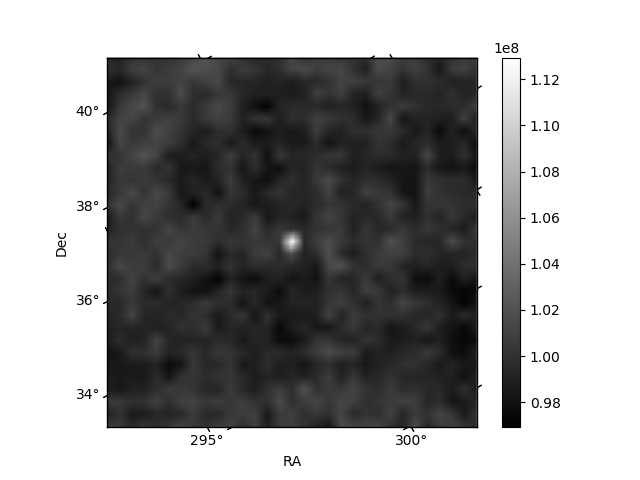
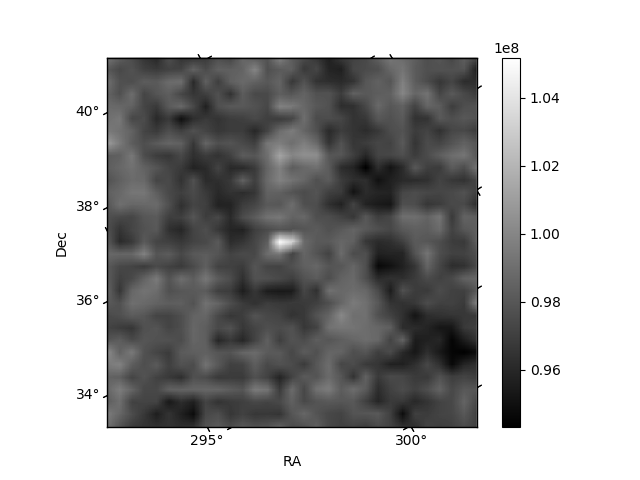
Histogram calculated using DETX and DETY for each event in the final _common_clean file
| Quadrant A | 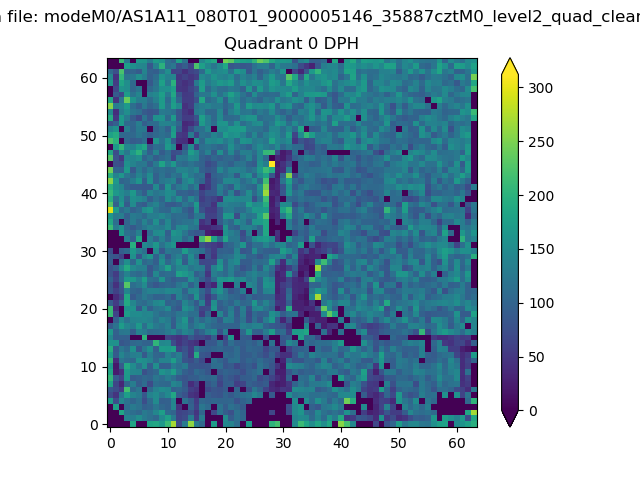 |
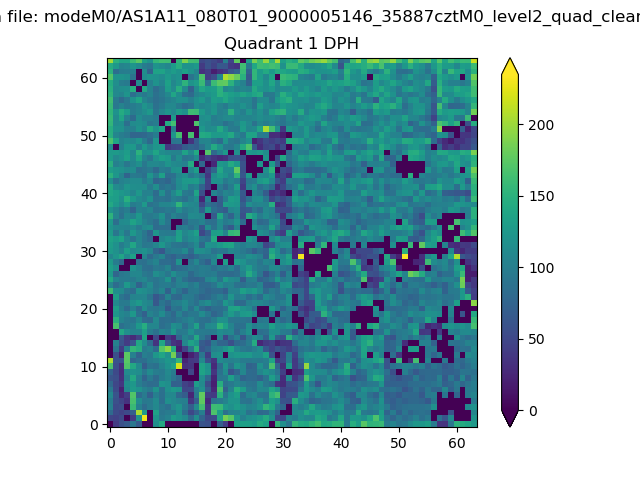 |
Quadrant B |
|---|---|---|---|
| Quadrant D | 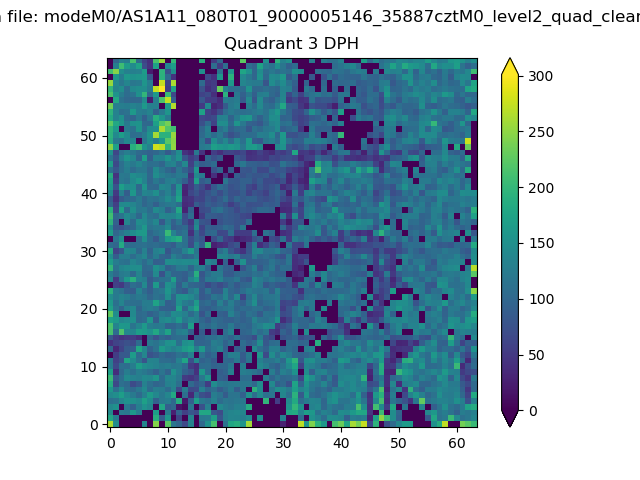 |
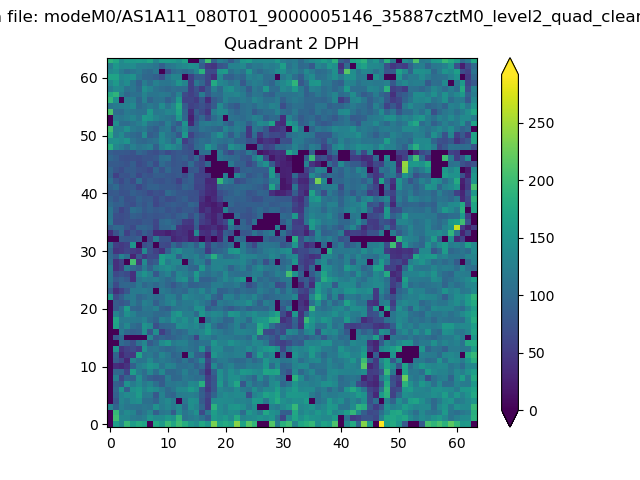 |
Quadrant C |
| Plot type | Count rate plots | Images |
|---|---|---|
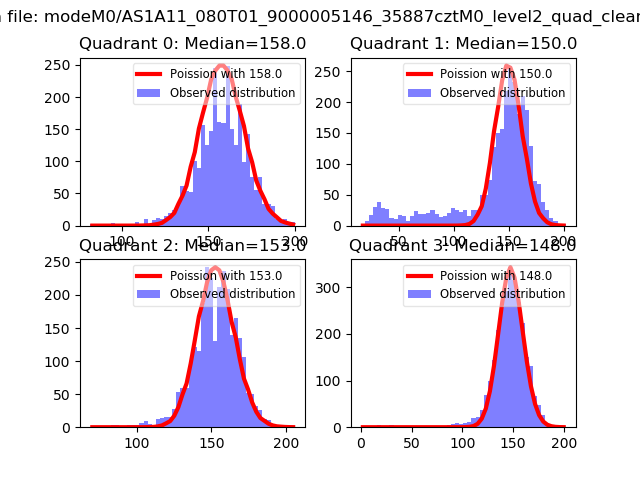
| Comparison with Poisson distribution Blue bars denote a histogram of data divided into 1 sec bins. Red curve is a Poisson curve with rate = median count rate of data. |
 |
 |
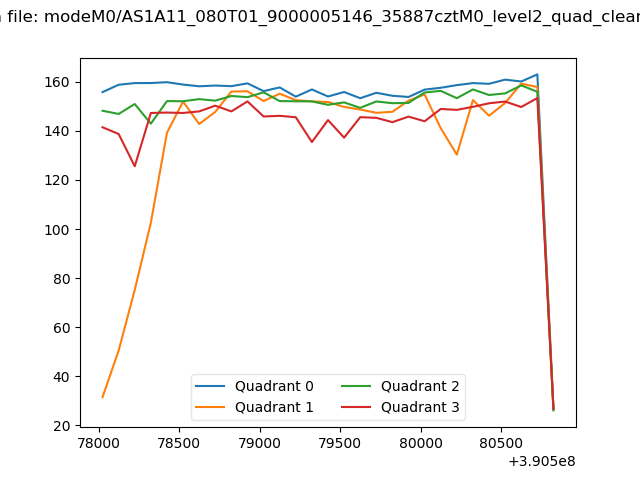
| Quadrant-wise count rates Data is divided into 100 sec bins |
 |
|
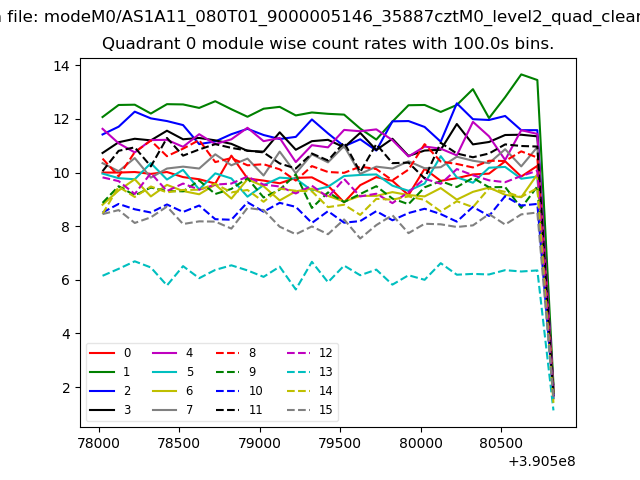
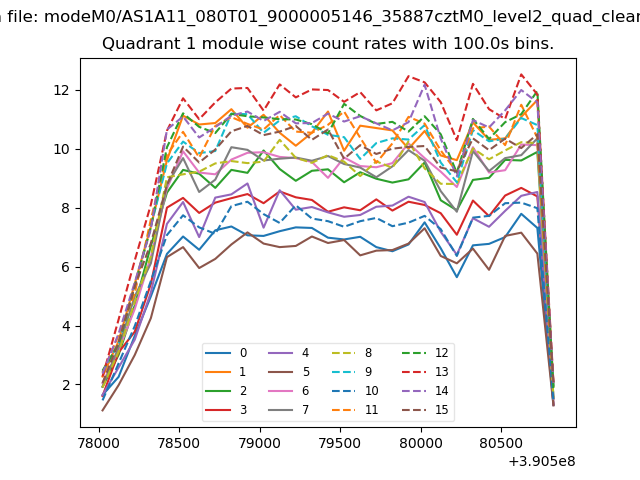
| Module-wise count rates for Quadrant A Data is divided into 100 sec bins |
 |
 |
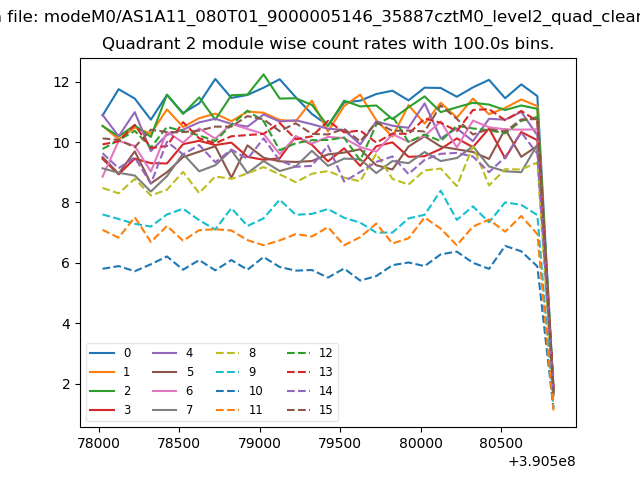
| Module-wise count rates for Quadrant B Data is divided into 100 sec bins |
 |
 |
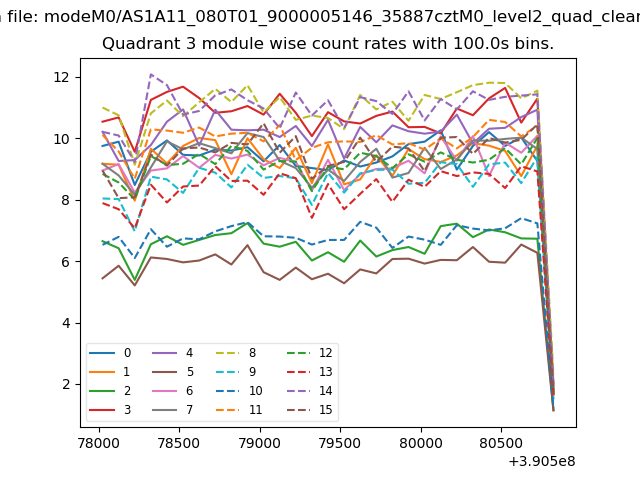
| Module-wise count rates for Quadrant C Data is divided into 100 sec bins |
 |
 |
| Module-wise count rates for Quadrant D Data is divided into 100 sec bins |
 |
 |
| Parameter | Plot |
|---|---|
| CZT HV Monitor | 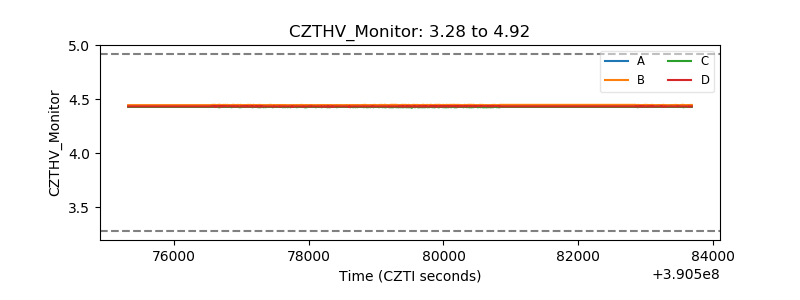 |
| D_VDD | 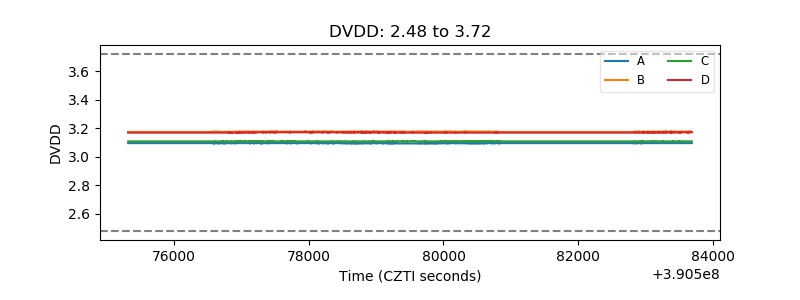 |
| Temperature 1 | 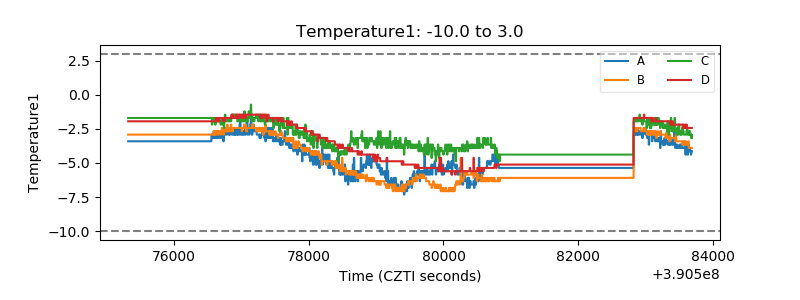 |
| Veto HV Monitor | 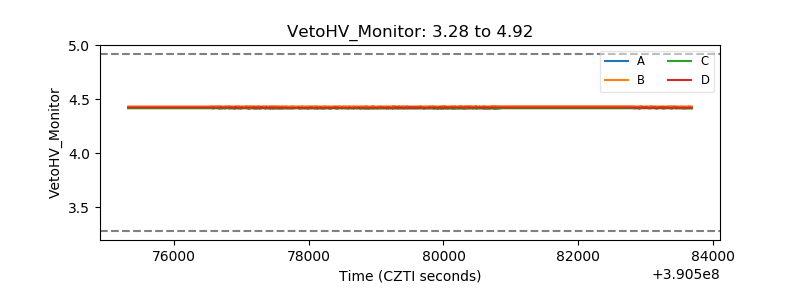 |
| Veto LLD | 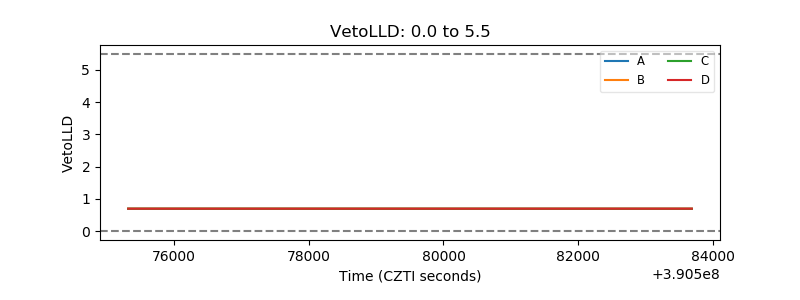 |
| Alpha Counter | 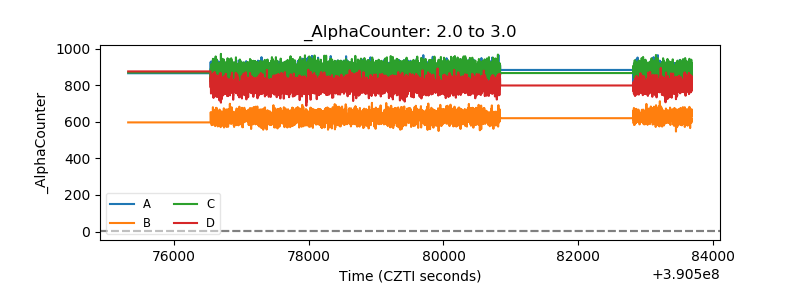 |
| _CPM_Rate | 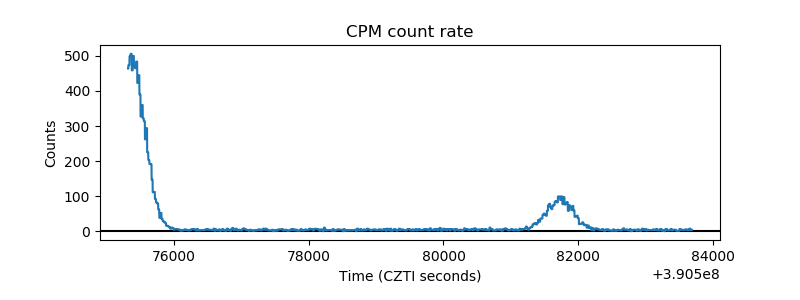 |
| CZT Counter | 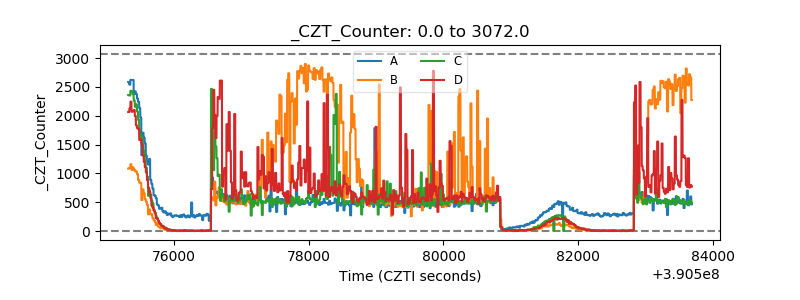 |
| +2.5 Volts monitor | 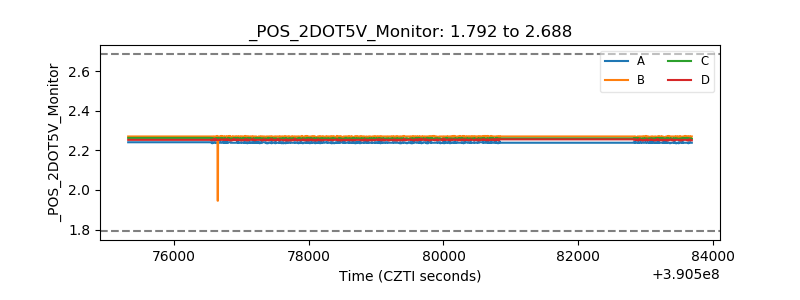 |
| +5 Volts monitor | 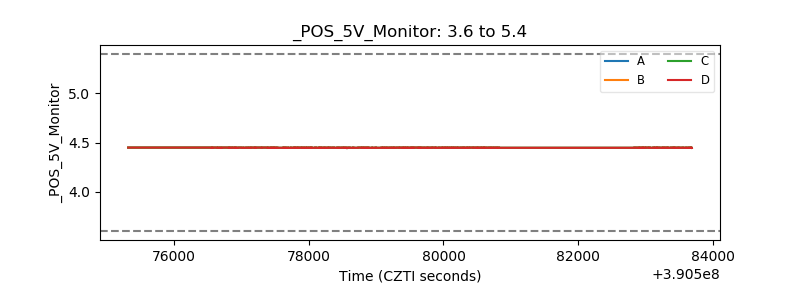 |
| _ROLL_ROT | 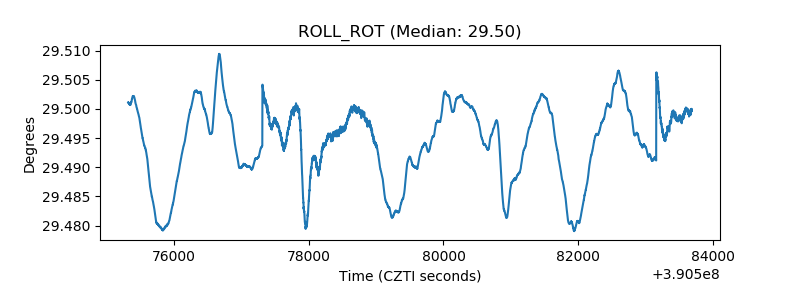 |
| _Roll_DEC | 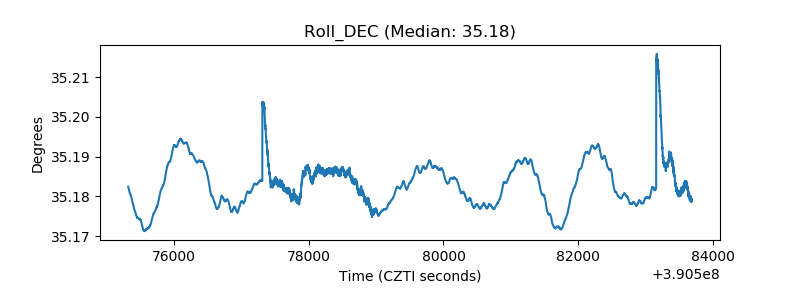 |
| _Roll_RA | 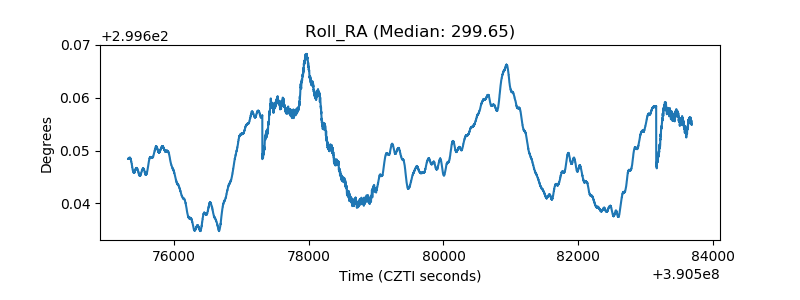 |
| Veto Counter | 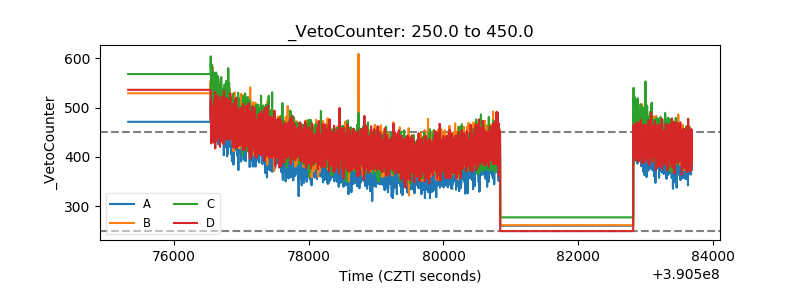 |